Wells Fargo: revenue and profit grow double-digits, but trailing operating cash flow turned negative by $19 billion

On July 14, 2026, Wells Fargo reported Q2 2026 results: revenue grew 8.6% YoY to $22,622 million, net profit rose 16.6% to $6,407 million. However, trailing twelve-month operating cash flow was minus $19,000 million, raising questions about earnings quality. The shares look rather attractive: the bank is growing faster than the market, expanding margins, but investors should watch its ability to generate cash.
Key takeaways
— Q2 revenue grew 8.6% to $22,622 million, accelerating from previous quarters
— EBITDA margin expanded to 42.8% from 39.9% a year earlier, helped by higher net interest income and fees
— Net profit rose 16.6% to $6,407 million, supported by revenue growth and cost control
— Trailing twelve-month operating cash flow is negative at minus $19,000 million, driven by aggressive loan portfolio growth
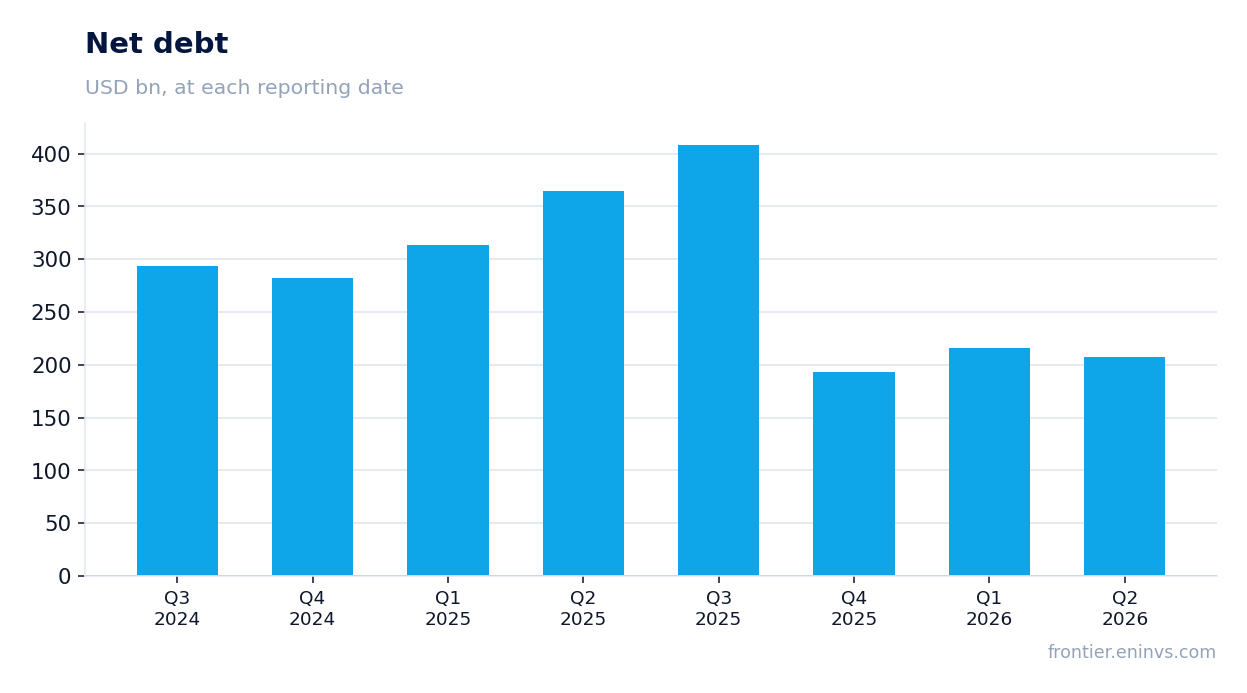
— Net debt fell $6.7 billion in the quarter but rose $20.8 billion over the year, reflecting massive credit expansion
— Corporate and Investment Banking segment revenue grew 16% YoY, largely thanks to investment banking and trading
— Return on equity (ROE) stood at 14.3%, above the average for large US banks
Attractiveness
Key figures, USD bn
| Metric | Q2 2025 | Q2 2026 | Change |
|---|---|---|---|
| Revenue | 20.8 | 22.6 | +8.6% |
| EBITDA | 8.30 | 9.69 | +16.7% |
| Net profit | 5.49 | 6.41 | +16.6% |
| Operating cash flow | -11.2 | 6.78 | to profit |
| EBITDA margin | 39.9% | 42.8% | +2.9 pp |
| Net margin | 26.4% | 28.3% | +1.9 pp |
Q2 revenue grew 8.6% to $22,622 million, accelerating from previous quarters
In Q2 2026, Wells Fargo reported revenue of $22,622 million, up 8.6% YoY. This is a notable acceleration from 4.5–6.4% growth in previous quarters. The main drivers were net interest income, up 5% to $12,317 million, and noninterest income, up 13% to $10,305 million.
Interest income growth was supported by a 12% YoY increase in average loans to $1,026,479 million. Noninterest income was boosted by asset management fees (+13%), investment banking fees (+35%), and trading revenues (+1%).
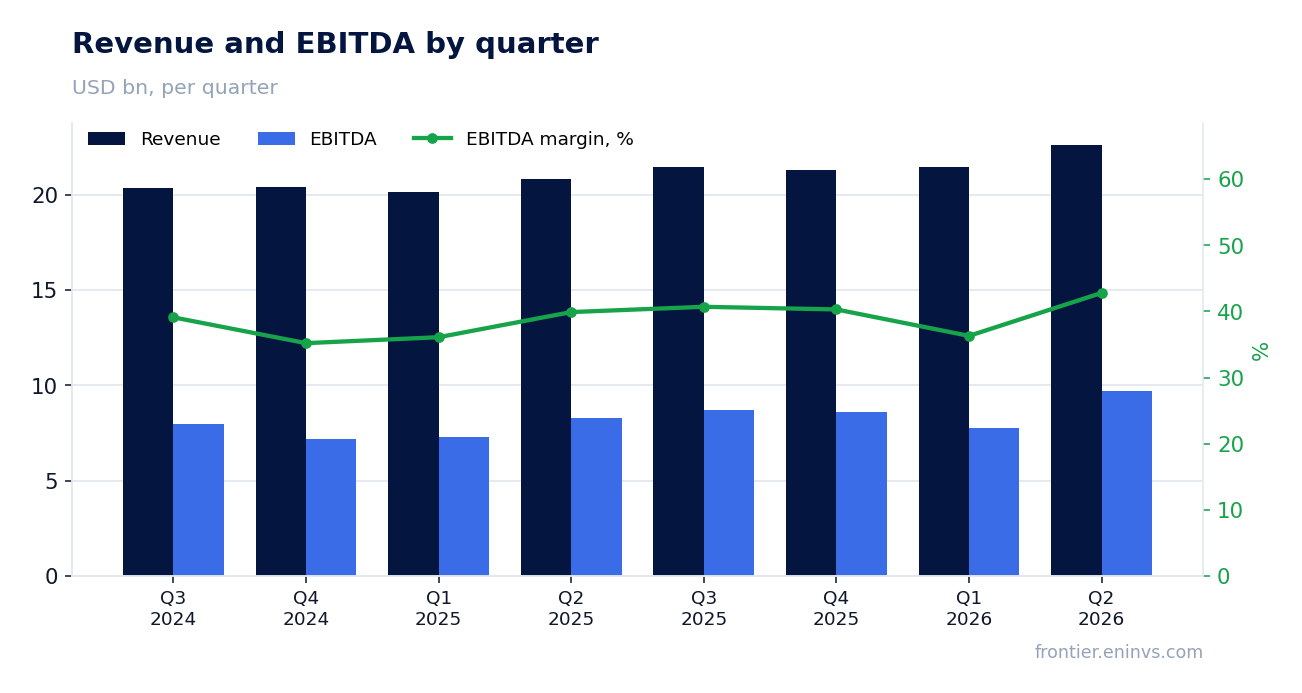
EBITDA margin expanded to 42.8% from 39.9% a year earlier, helped by higher net interest income and fees
EBITDA in Q2 reached $9,686 million, up 16.7% YoY. EBITDA margin expanded to 42.8% from 39.9%, reflecting faster revenue growth than expenses: noninterest expenses rose only 2% to $13,661 million.
Margin expansion is driven by operating leverage: the bank grows revenue faster than costs. Particularly notable is cost control on personnel, down 8% QoQ, and efficiency gains in Consumer Banking and Commercial Banking segments.
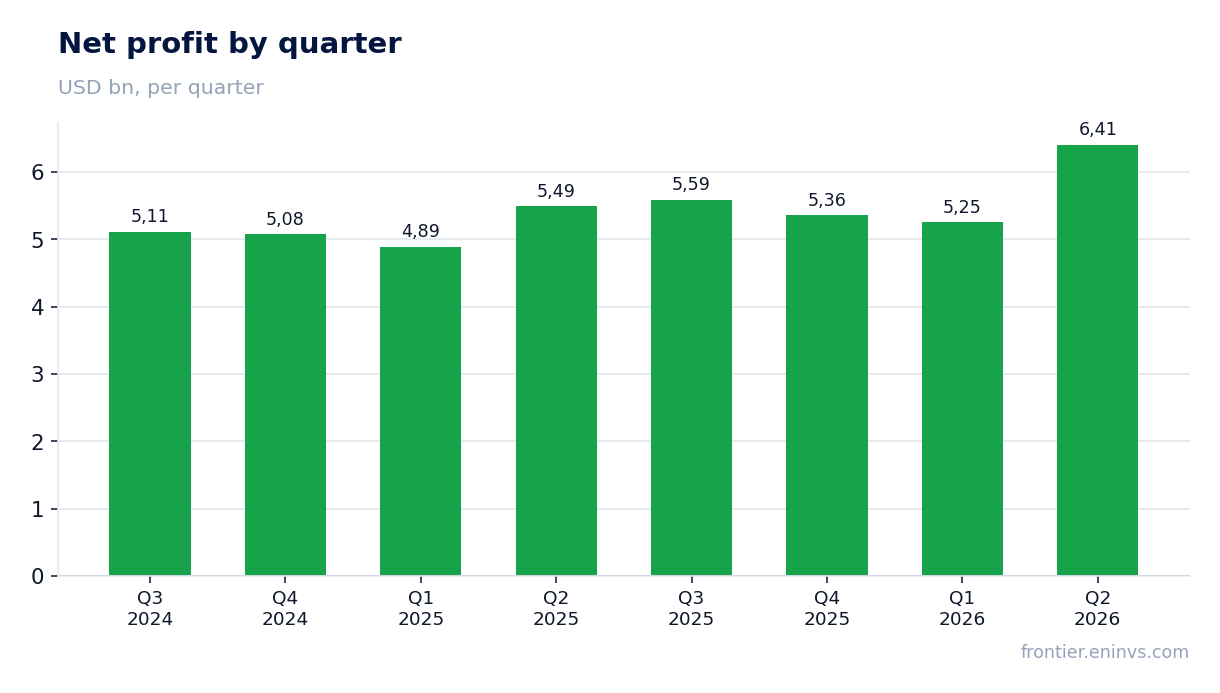
Net profit rose 16.6% to $6,407 million, supported by revenue growth and cost control
Wells Fargo's Q2 net profit was $6,407 million, up 16.6% YoY. Growth was driven by higher revenue and contained expenses, while credit loss provisions fell 9% to $914 million.
Earnings per share rose to $2.00 from $1.60 a year earlier. Return on equity (ROE) over the trailing twelve months was 14.3%, above the average for large US banks.
Trailing twelve-month operating cash flow is negative at minus $19,000 million, driven by aggressive loan portfolio growth
Over the trailing twelve months (LTM), Wells Fargo's operating cash flow was minus $19,000 million. This is unusual for a bank but explained by massive loan portfolio growth: average loans rose 12% YoY to $1,026,479 million, requiring significant cash outflows for new lending.
Quarterly OCF is highly volatile: from -$11,216 million in Q2 2025 to +$9,143 million in Q1 2026. In Q2 2026, OCF was $6,775 million, indicating normalization, but the twelve-month cumulative result remains negative due to aggressive credit expansion.
Net debt fell $6.7 billion in the quarter but rose $20.8 billion over the year, reflecting massive credit expansion
At the end of Q2 2026, Wells Fargo's net debt stood at $193,035 million, down $6.7 billion from the previous quarter. However, over the trailing twelve months, net debt rose $20.8 billion, reflecting financing for aggressive loan portfolio growth.
Debt growth accompanies balance sheet expansion: assets rose 15% YoY to $2,282,201 million. The bank is growing lending faster than deposits, requiring additional funding through borrowings.
Corporate and Investment Banking segment revenue grew 16% YoY, largely thanks to investment banking and trading
Corporate and Investment Banking segment revenue grew 16% YoY in Q2 to $5,425 million. Investment banking fees were $948 million (+35% YoY), and trading revenues (FICC and Equities) rose 10% and 64%, respectively.
The segment was the main growth driver: net profit increased 34% to $2,329 million. Return on allocated capital reached 19.2% versus 14.9% a year earlier.
Return on equity (ROE) stood at 14.3%, above the average for large US banks
Over the trailing twelve months, Wells Fargo's ROE was 14.3%, above the average for large US banks. In Q2 2026, ROE reached 15.0% versus 12.8% a year earlier, reflecting profit growth and lower equity due to share buybacks.
The bank continues returning capital to shareholders: dividends rose to $0.45 per share (+13% YoY), and shares outstanding fell 6% YoY to 3,028.5 million.
Valuation on the latest reported figures
| Metric | Value |
|---|---|
| Operating cash flow (LTM) | -19.0 bn |
| ROE | 14.3% |
Bottom line
Wells Fargo delivered a strong quarter: revenue and profit growing double-digits, margins expanding, ROE above 14%. However, earnings quality raises questions: trailing operating cash flow is negative, and net debt rose $20.8 billion over the year. The bank is lending aggressively, supporting current results but creating risks for future provisions. At current valuation, the shares look rather attractive, but investors should watch the bank's ability to generate cash flow and control credit risks.
Open the company's financial profile WFC →
See also: market overview · valuation map · stock screeners