Walmart Inc.: a strong quarter, but the market sees a ceiling
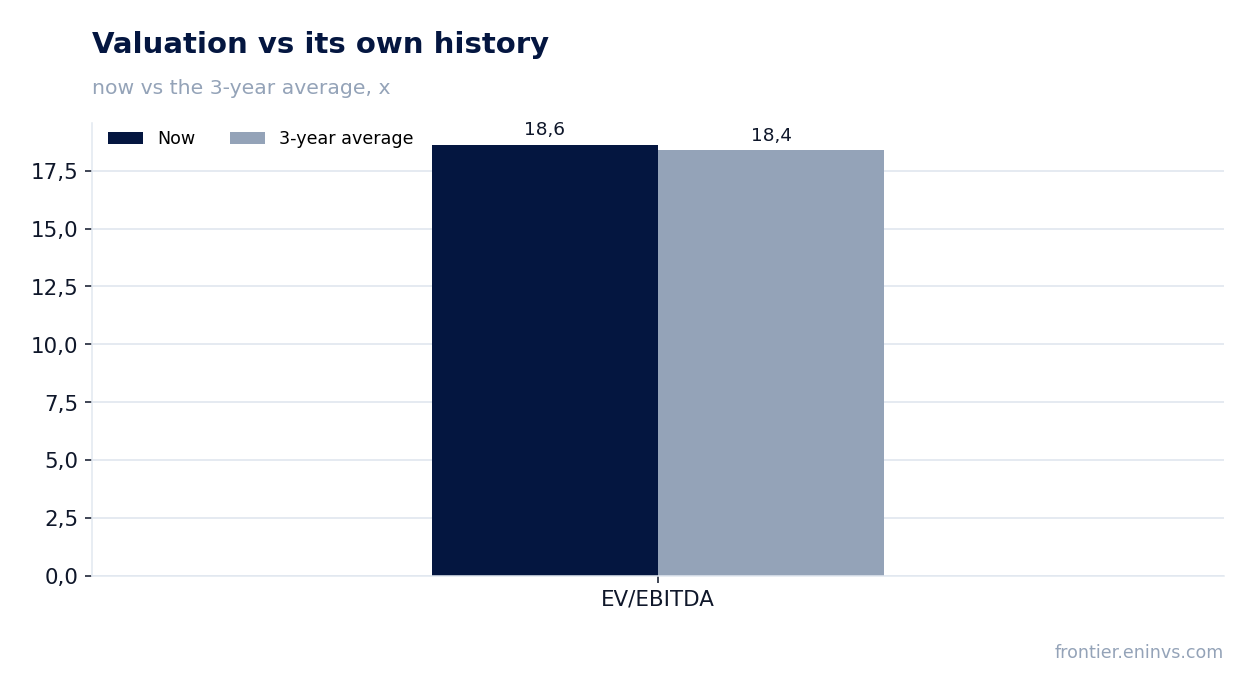
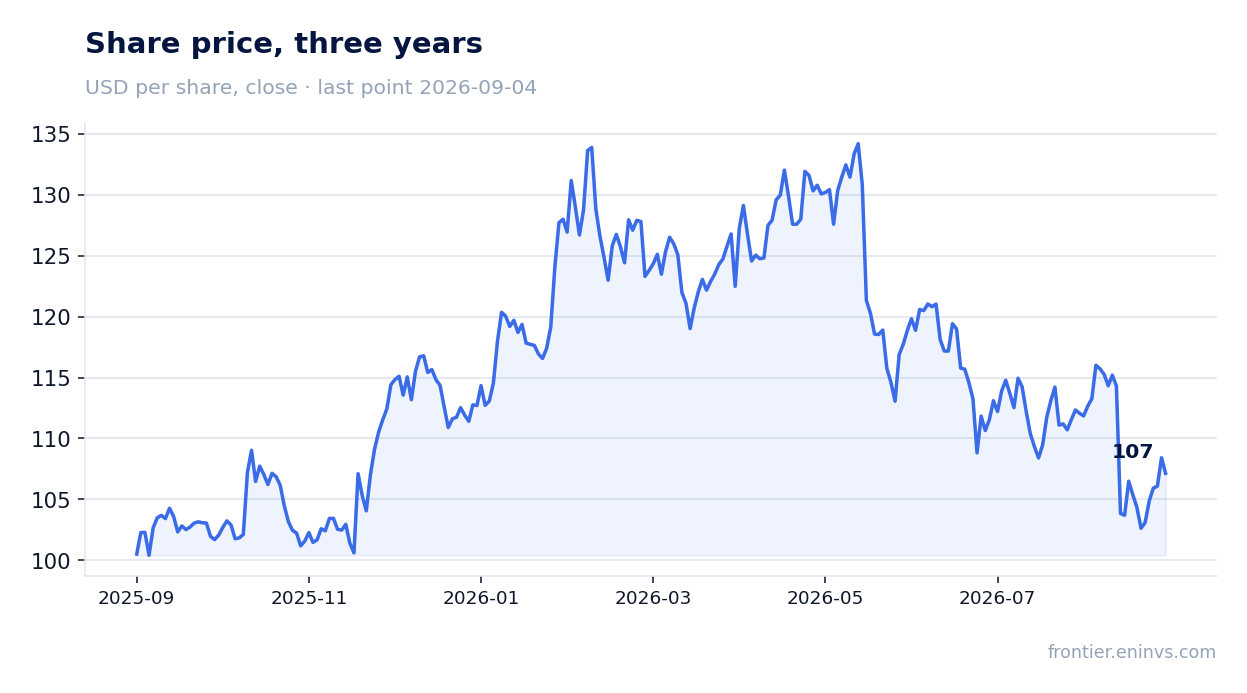
On August 20, 2026, Walmart Inc. reported results for the second quarter of fiscal 2027 (the quarter ended July 31, 2026). Revenue grew 5.9% (5.1% in constant currency), operating income rose 28.8%, but net profit fell 9.4% due to investment losses. Shares dropped 9.2% on the release day and a further 6.3% by September 4, reflecting market disappointment despite strong operational performance. At the current price, the shares look rather attractive, with EV/EBITDA at 18.6 versus the three-year average of 18.4 and upside potential of 20% on the portal's model.
Key takeaways
— Revenue grew 5.9% driven by eCommerce, which rose 23% globally
— Operating income jumped 28.8% due to tariff refunds and improved business mix
— Net profit fell 9.4% due to investment losses and a tax matter
— EBITDA margin expanded to 7.2% from 6.1% a year earlier, but net margin declined
— Net debt fell to $28.4 billion, with net debt/EBITDA at 1.15
— The company raised its full-year guidance: adjusted operating income growth of 7.0–8.5%
— Shares fell 9.2% on the release day despite strong results
Attractiveness
Key figures, USD bn
| Metric | Q2 2025 | Q2 2026 | Change |
|---|---|---|---|
| Revenue | 177 | 186 | +4.9% |
| EBITDA | 10.8 | 13.3 | +23.5% |
| Operating profit | 7.29 | 9.38 | +28.8% |
| Net profit | 7.03 | 6.37 | -9.4% |
| Operating cash flow | 12.9 | 6.90 | -46.7% |
| Capex | 6.42 | 7.50 | +16.7% |
| EBITDA margin | 6.1% | 7.2% | +1.1 pp |
| Net margin | 4.0% | 3.4% | -0.6 pp |
Revenue grew 5.9% driven by eCommerce, which rose 23% globally
In the second quarter of fiscal 2027 (the quarter ended July 31, 2026), Walmart Inc.'s total revenue reached $187.9 billion, up 5.9% from a year earlier. In constant currency, growth was 5.1%. The main driver was global eCommerce, with sales up 23%, with strong results in the Walmart U.S. (+24%) and Sam's Club U.S. (+26%) segments.
In the Walmart U.S. segment, sales rose 3.5% to $125.2 billion, with comparable sales (excluding fuel) up 2.6%, reflecting transaction growth of 1.5% and average ticket growth of 1.1%. The international segment grew 12.8% (7.9% in constant currency) to $35.2 billion, helped by favorable currency effects of $1.5 billion.
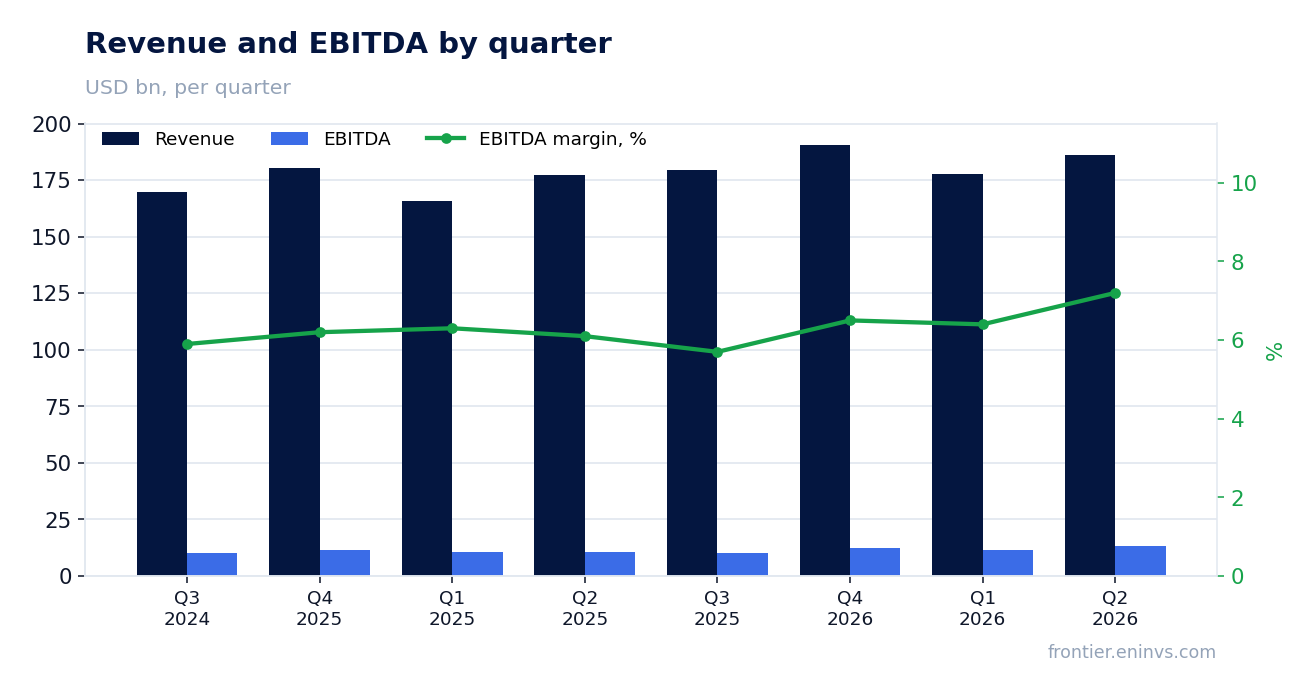
Operating income jumped 28.8% due to tariff refunds and improved business mix
Operating income in the second quarter rose 28.8% to $9.38 billion. The company attributes this to tariff refunds received, partially offset by price investments, as well as improved business mix and eCommerce economics. Excluding the impact of tariff refunds and price investments, operating income growth was at the top end of guidance.
In the Walmart U.S. segment, operating income rose 20.6% to $8.12 billion, helped by gross margin expansion of 158 basis points due to tariff refunds and improved assortment. In Sam's Club U.S., operating income jumped 44.3% to $0.68 billion, also driven by tariff refunds and membership growth.
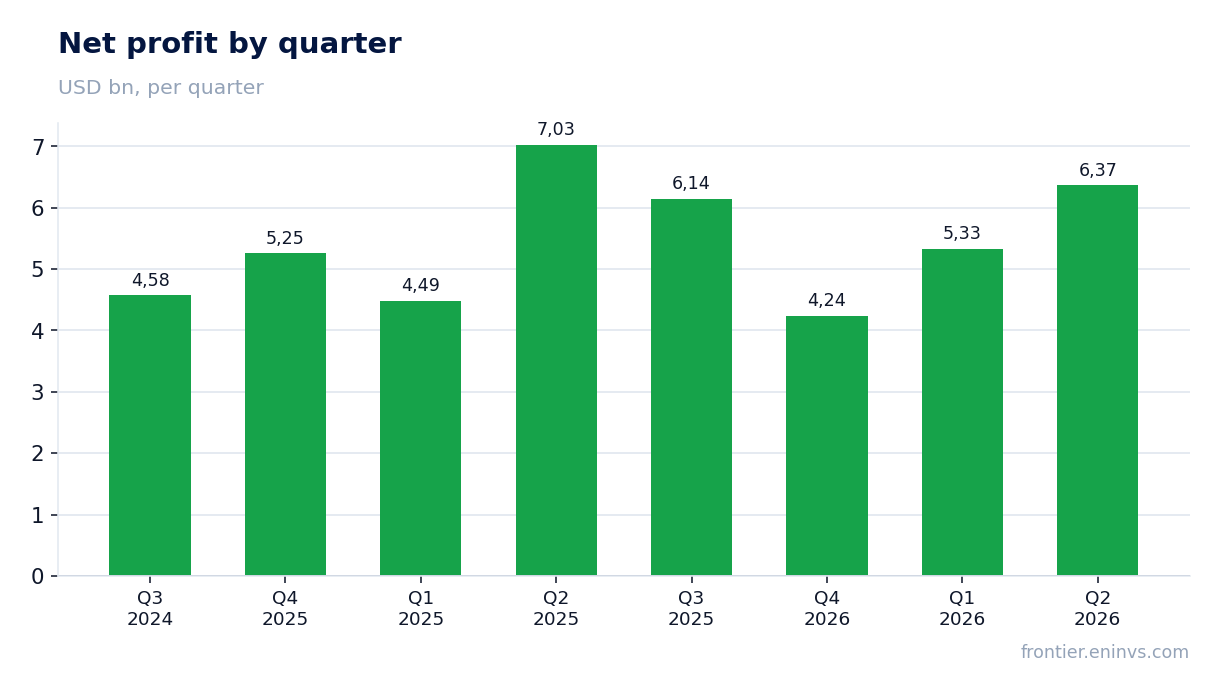
Net profit fell 9.4% due to investment losses and a tax matter
Net profit attributable to Walmart Inc. shareholders in the second quarter was $6.37 billion, down 9.4% from a year earlier. The decline occurred despite higher operating income, as the company recorded net investment losses of $0.12 per share and simultaneously benefited from a tax matter of $0.11 per share.
Adjusted earnings per share were $0.81, above the prior-year figure ($0.88 on a GAAP basis, but adjusted). Excluding one-off items, operational dynamics were strong, but the market focused on the decline in GAAP profit.
EBITDA margin expanded to 7.2% from 6.1% a year earlier, but net margin declined
In the second quarter, EBITDA margin was 7.2% versus 6.1% in the same quarter a year earlier. This reflects operational efficiency and the effect of tariff refunds. However, net margin declined to 3.4% from 4.0% due to investment losses and higher tax rates.
Over the trailing twelve months (LTM), EBITDA reached $48.9 billion, and net profit $22.1 billion. EBITDA margin for LTM is about 6.7%, lower than the quarterly figure, but reflects the resilience of the business.
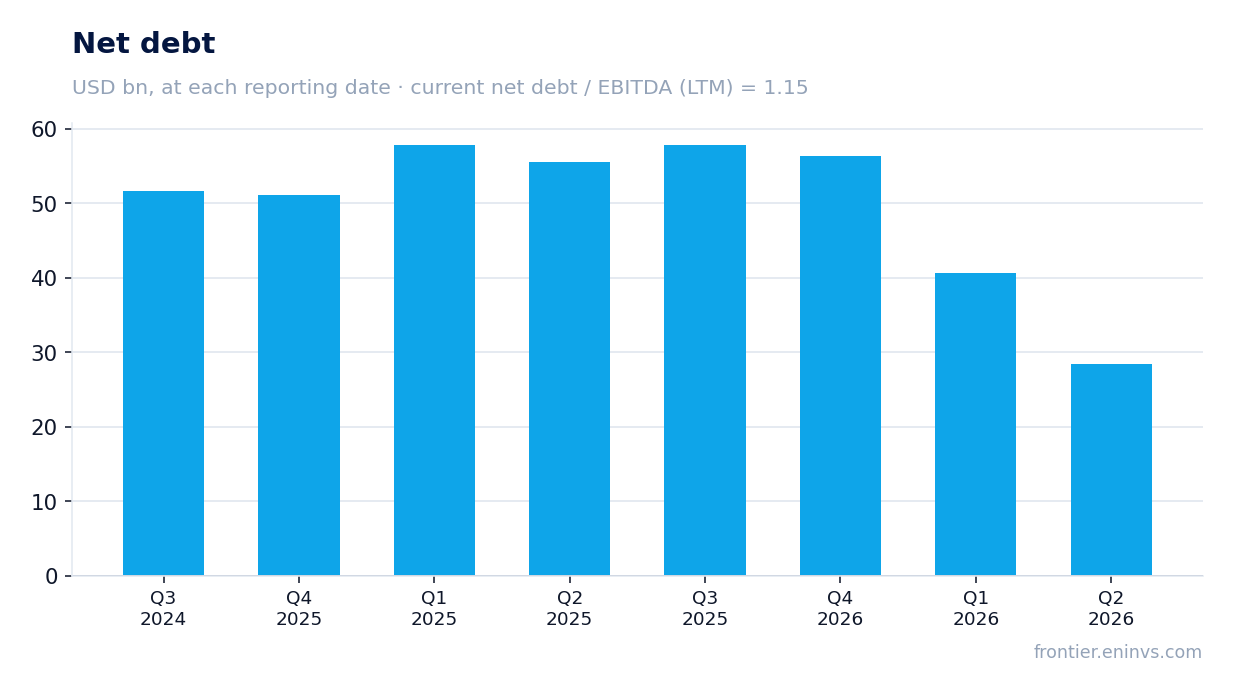
Net debt fell to $28.4 billion, with net debt/EBITDA at 1.15
At the end of the second quarter, Walmart Inc.'s net debt stood at $28.4 billion, significantly lower than a year earlier ($55.6 billion). The decline over the last 12 months was $27.2 billion. The net debt to EBITDA ratio for the trailing twelve months is 1.15.
Operating cash flow for the first half was $19.7 billion, up $1.4 billion from a year earlier. Capital expenditures rose to $14.2 billion, leading to a decline in free cash flow to $5.5 billion (versus $6.9 billion a year earlier).
The company raised its full-year guidance: adjusted operating income growth of 7.0–8.5%
Walmart Inc. raised its guidance for fiscal 2027: net sales growth in constant currency is expected at 4.0–5.0% (previously 3.5–4.5%), and adjusted operating income growth at 7.0–8.5% (previously 6.0–8.0%). The adjusted EPS forecast was raised to $2.80–2.87 from $2.75–2.85.
The company also raised its capital expenditure guidance to approximately 4.0% of net sales (previously 3.5%). For the third quarter, it expects sales growth of 3.0–3.75% and adjusted operating income growth of 2.0–4.0% in constant currency, warning of a negative impact from the timing shift of Flipkart's Big Billion Days.
Shares fell 9.2% on the release day despite strong results
Walmart Inc.'s share price before the release was $114.30. On the release day, shares fell 9.2%, and by September 4, 2026, the decline since the report reached 6.3%. Thus, the market reacted negatively, likely due to disappointing net profit and cautious third-quarter guidance.
Nevertheless, fundamentals remain strong: revenue is growing at a solid pace, operating income shows double-digit growth, and debt leverage has decreased. The share decline has created a more attractive entry point for long-term investors.
Valuation on the latest reported figures
| Metric | Value |
|---|---|
| Market cap | 854 bn USD |
| P/E (LTM) | 38.7 |
| EV/EBITDA (LTM) | 18.6 |
| P/B | 8.57 |
| Net debt / EBITDA (LTM) | 1.15 |
| Operating cash flow (LTM) | 41.6 bn |
| ROE | 26.4% |
| Dividend yield (12m) | 0.9% |
| EV/EBITDA, 3-year average | 18.4 |
Bottom line
Walmart Inc.'s second-quarter report showed strong operational dynamics: revenue grew 5.9%, operating income rose 28.8%, and the company raised its full-year guidance. However, net profit declined due to one-off investment losses, which triggered a negative market reaction. At the current price, shares trade at an EV/EBITDA multiple of 18.6, only slightly above the three-year average (18.4), and the portal's model implies upside potential of +20%. Given the strong balance sheet (net debt/EBITDA 1.15) and the raised guidance, the shares look rather attractive, although investors should monitor consumer spending trends and potential new investment volatility.
Open the company's financial profile WMT →
See also: market overview · valuation map · stock screeners