Frontierby eninvs

Language: EN / RU

Uzbekistan Stocks — Valuations, P/E & Dividends

Related guides: Gold Mining Stocks · The Cheapest Metals & Mining Stocks (2026)

GDP growth 2026 (proj.) 6.5%Inflation YoY (proj.) 7.0%FX vs USD (3y avg p.a.) —Macro: IMF World Economic Outlook, April 2026 (Annex tables 1.1.2–1.1.4)

Sectors: Banks (3)

Rows are ordered partly by extraction health (share of stable periods). Hover a row for OK / partial / error counts.

CompanyCountrySectorValue / upsideDiv. %FCF Yield LTMΔ revenue (NII for banks)Δ EBITDA (assets for financials)EV/EBITDA LTMP/E LTMP/B FYROE (ann.)
Universal bank (ATB)
UZ_UNIVERSAL
UZBanks+12%4.4%—-8.8%40.8%—6.0x2.1x5.8%
Trustbank (PJSB)
UZ_TRUST
UZBanks+9%6.1%—44.4%15.0%—11.8x4.1x8.6%

Work in progress — needs attention

Issuers below have weak extraction, thin market data, missing valuation inputs, or extreme headline YoY/ROE. Hover the row for the checklist.

CompanyCountrySectorValue / upsideDiv. %FCF Yield LTMΔ revenue (NII for banks)Δ EBITDA (assets for financials)EV/EBITDA LTMP/E LTMP/B FYROE (ann.)
Hamkorbank (JSCB)
UZ_HAMKOR
UZBanks+24%0.9%—34.9%———1.0x8.6%
UzNIF — National Investment Fund (JSC)
UZ_UZNIF
UZFund-6%————————
UZEX — Uzbek Commodity Exchange (JSC)
UZ_UZEX
UZNon-financial—15.8%—11.4% ▼——9.1x5.0x91.2%

Earnings analysis

Short take-aways from recent corporate results and commodity trends.

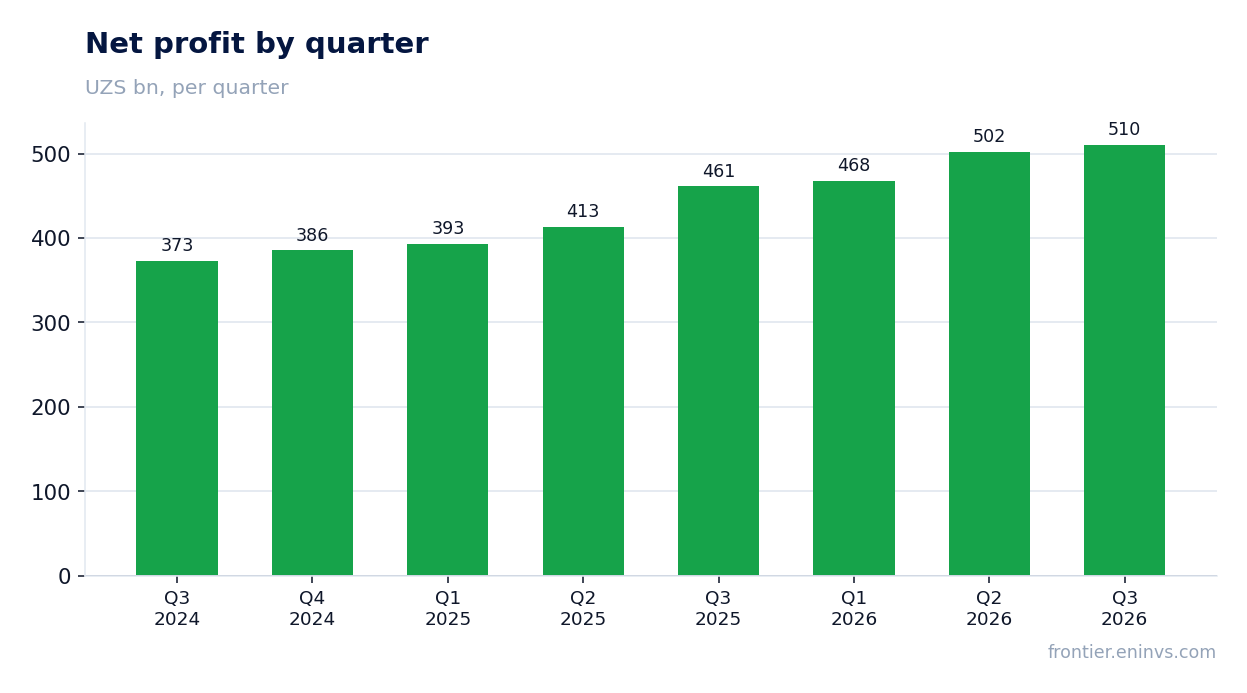
Hamkorbank: revenue accelerated to +24.6%, but profit lags – margin compressed to 30.9%

HAMKOR →
UZ_HAMKOR

In its Q3 2026 report, Hamkorbank posted revenue of UZS 1,651.1 bn, operating profit of UZS 606.4 bn and net profit of UZS 510.5 bn. Year-on-year revenue growth accelerated to +24.6% from +23.8% in Q2, but net profit rose only +10.7% and the net margin fell to 30.9% from 34.8% a year earlier. With ROE at 8.6% and a dividend yield of 0.88%, the share looks neutral: faster revenue does not offset the margin compression, while the portal's model implies +24% upside to fair value.

Key takeaways

— Revenue accelerated to +24.6% YoY, but profit rose only +10.7% – the margin compressed to 30.9% from 34.8%

— Operating profit of UZS 606.4 bn on revenue of UZS 1,651.1 bn – an operating margin of 36.7%

— Net margin of 30.9% versus 34.8% a year earlier – profit is growing slower than revenue for a third quarter

— ROE of 8.6% on a market cap of UZS 8,518.4 bn – the return on capital remains modest

— Dividend yield of 0.88% over the last 12 months – the payout is symbolic relative to profit

— On the portal's model the share trades at a +24% discount to fair value, but that is our calculation, not a consensus

Attractiveness

Key figures, UZS bn

MetricQ3 2025Q3 2026Change
Revenue1 3251 651+24.6%
Operating profit—606—
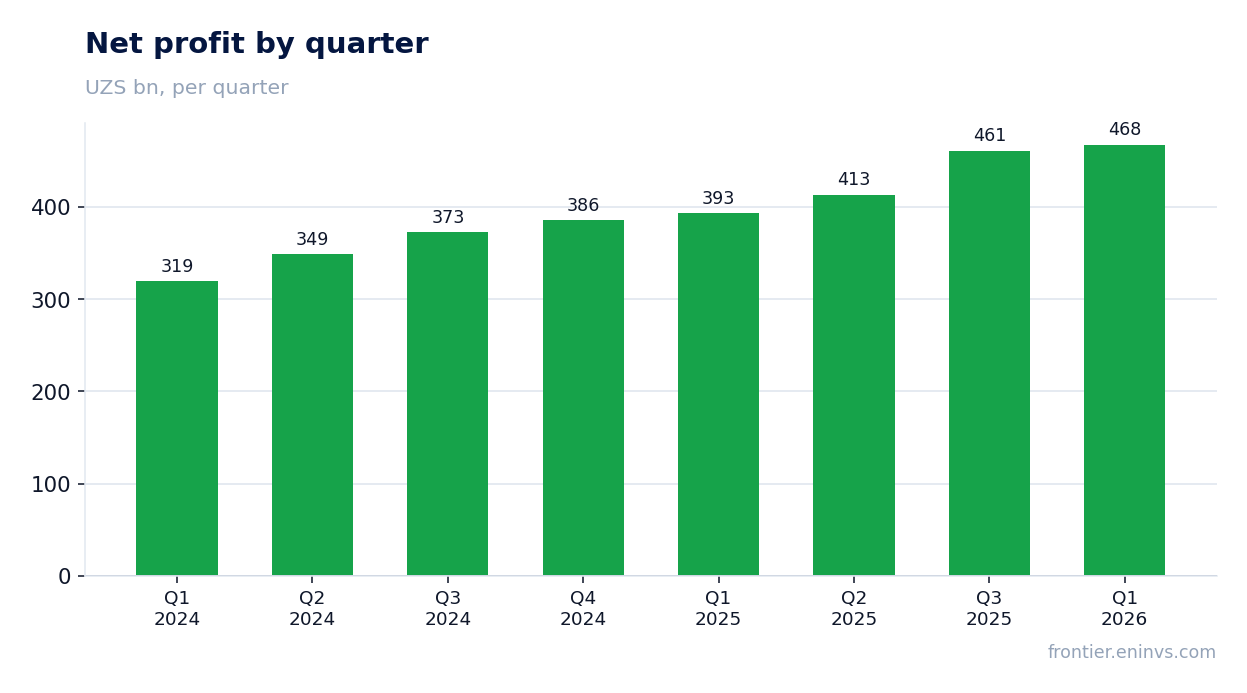
Net profit461510+10.7%
Net margin34.8%30.9%-3.9 pp

Revenue accelerated to +24.6% YoY, but profit rose only +10.7% – the margin compressed to 30.9% from 34.8%

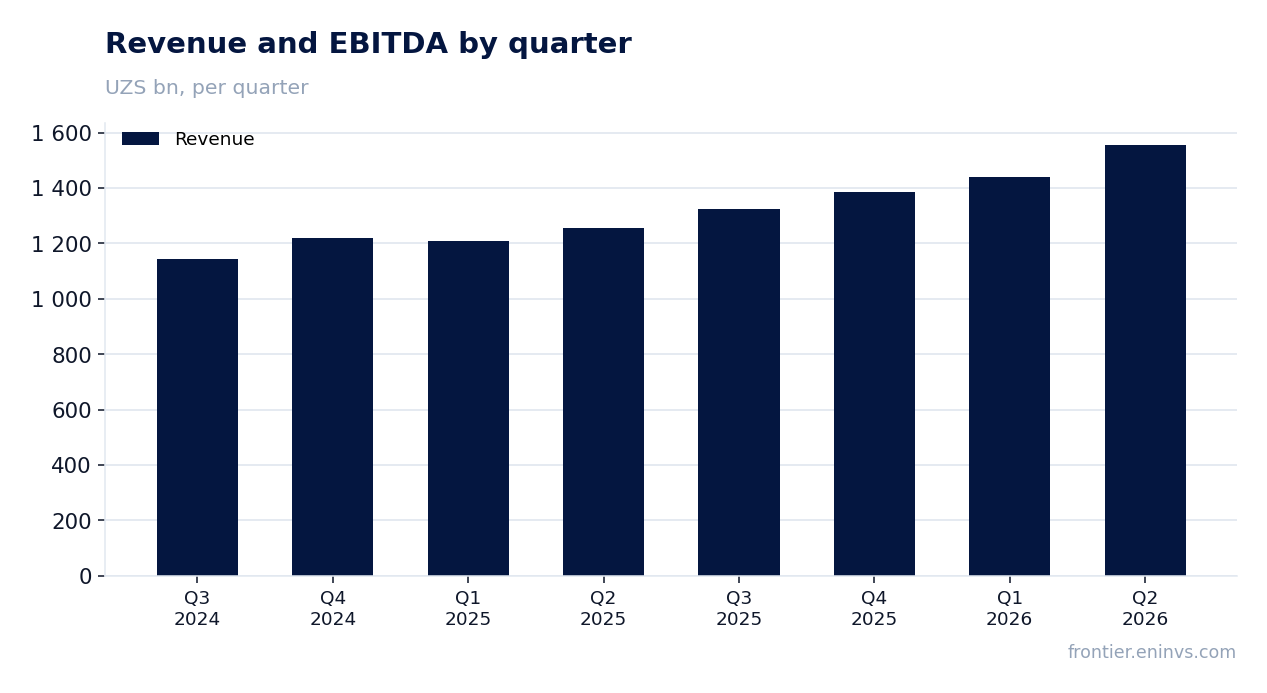
In Q3 2026 Hamkorbank's revenue reached UZS 1,651.1 bn, up 24.6% year on year. That is an acceleration from Q2, when growth was +23.8%. The quarterly revenue trajectory remains strong: from UZS 1,438.1 bn in Q1 to UZS 1,556.2 bn in Q2 and UZS 1,651.1 bn in Q3.

Net profit for the same quarter was UZS 510.5 bn, up only 10.7% year on year. The gap versus revenue comes from net margin compression to 30.9% from 34.8% a year earlier. Profit is growing slower than revenue, and this is not the first quarter of such dynamics: in Q3 2025 the margin was higher.

Operating profit was UZS 606.4 bn, an operating margin of 36.7% of revenue. The gap between operating and net profit of UZS 95.9 bn reflects taxes and other items below the operating line. That is where the main pressure on the margin occurs.
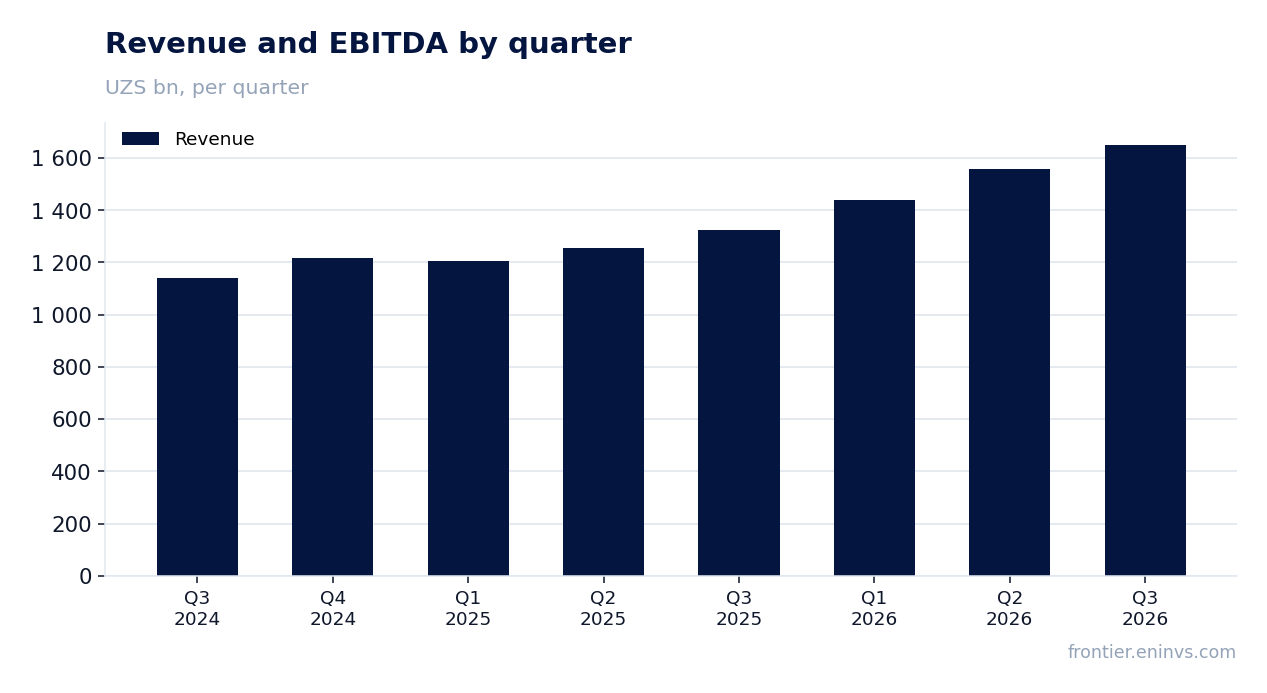
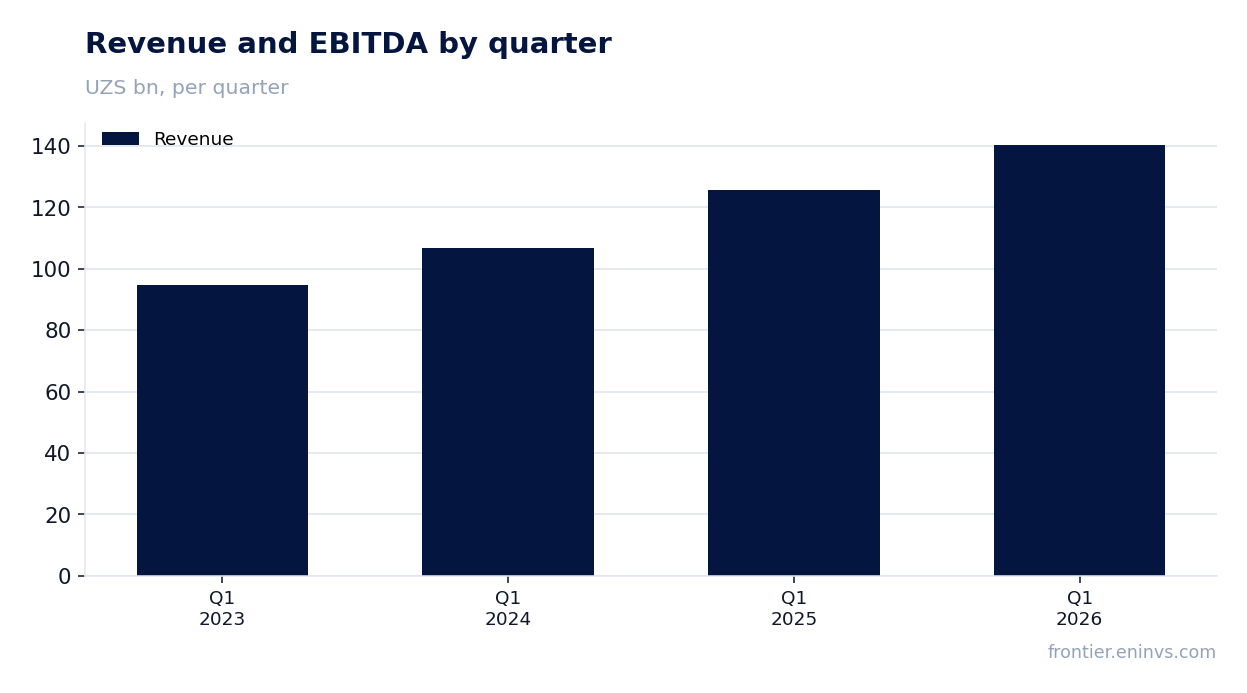
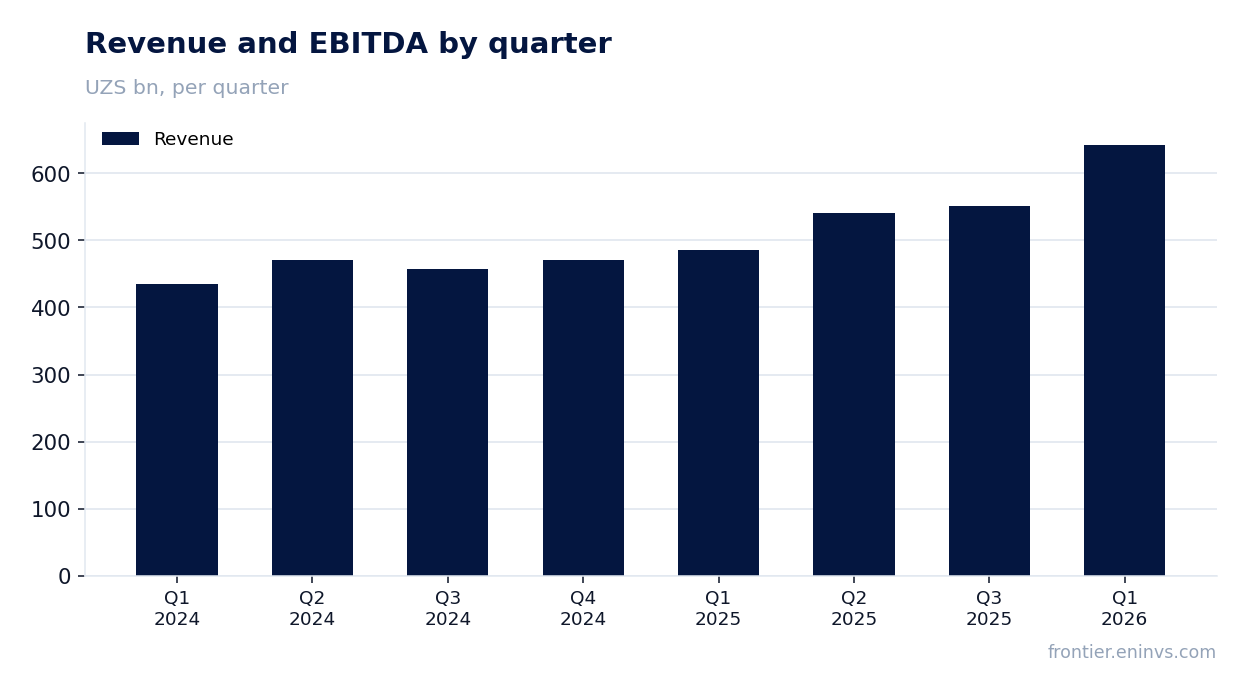
Revenue and EBITDA by quarter

Operating profit of UZS 606.4 bn on revenue of UZS 1,651.1 bn – an operating margin of 36.7%

Operating profit in Q3 2026 was UZS 606.4 bn on revenue of UZS 1,651.1 bn, a margin of 36.7%. For a bank this is a high level, but it is below a year earlier, when revenue was UZS 1,325.2 bn and profit was different.

The gap between operating and net profit – UZS 95.9 bn – reflects taxes and items below the operating line. That is where the main pressure sits: net margin is falling faster than operating margin. While operating margin holds above 36%, net margin is already 30.9%.

For comparison, in Q2 2026 operating profit was UZS 599.0 bn on revenue of UZS 1,556.2 bn, a margin of 38.5%. In Q3 it fell to 36.7%. That is a move down, not up.
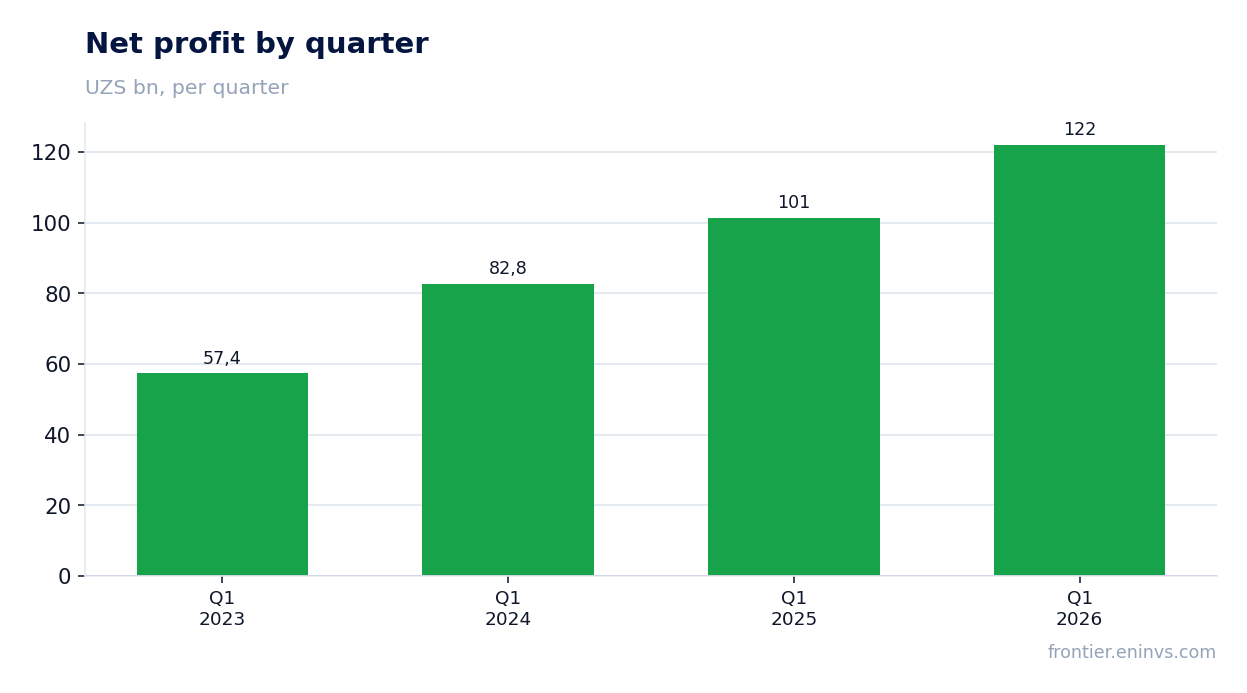
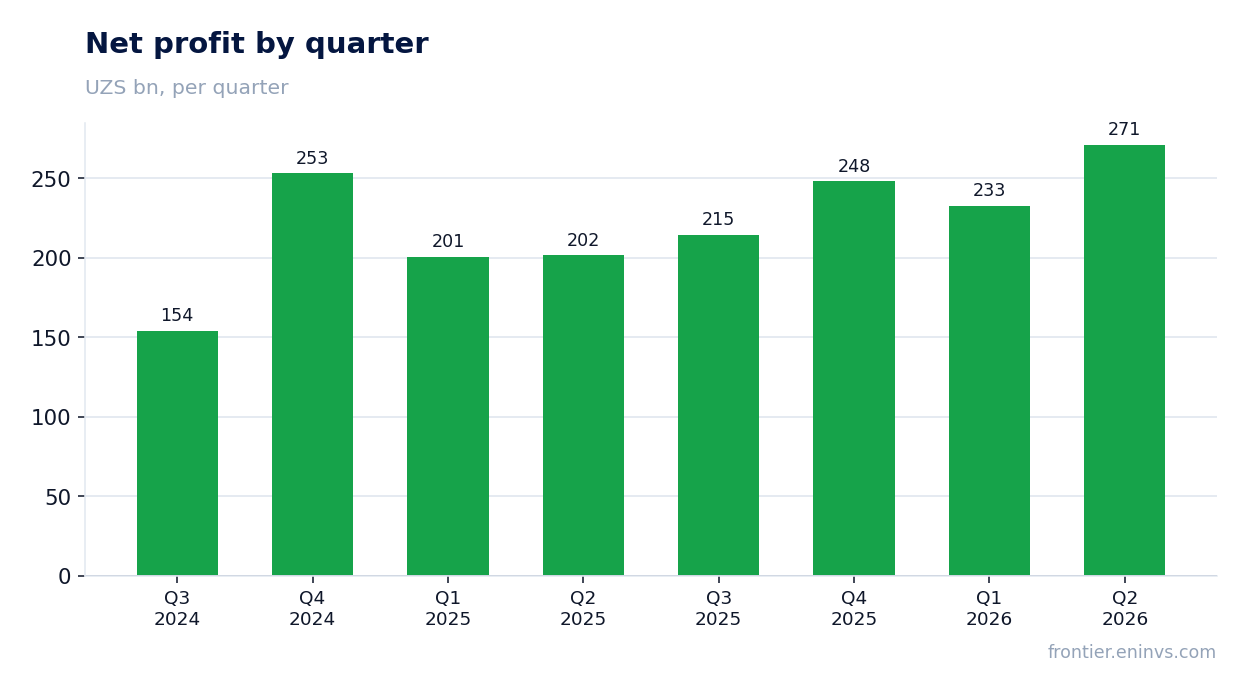
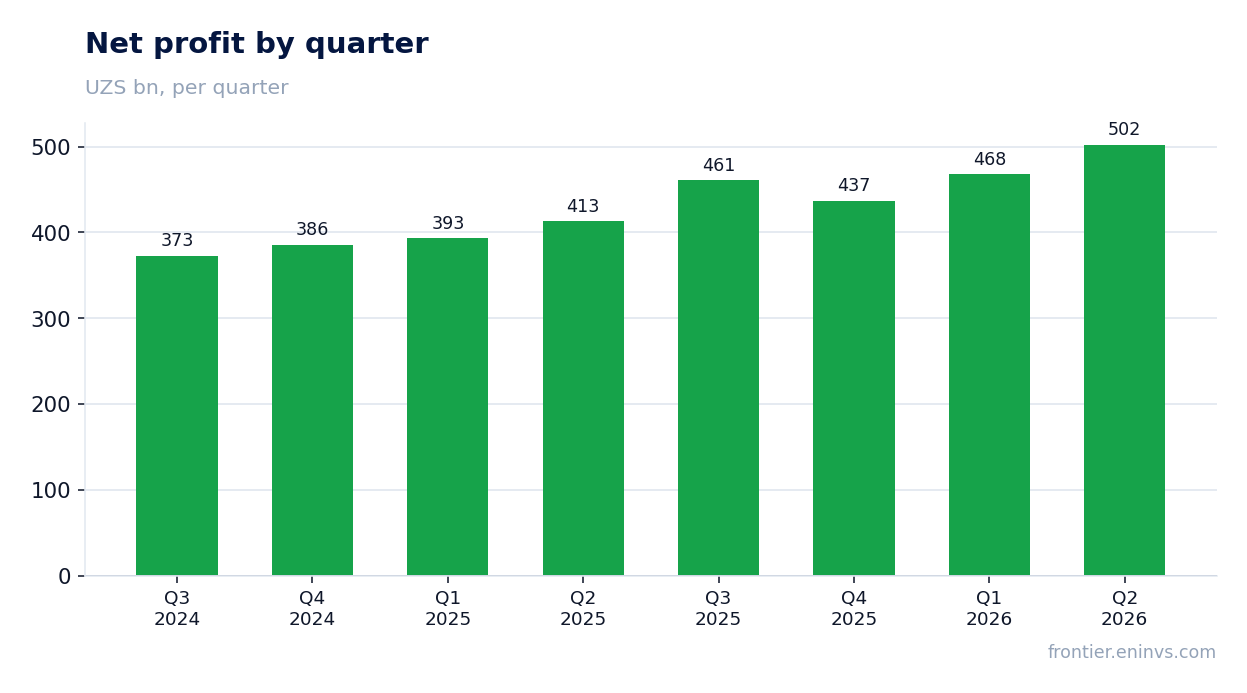
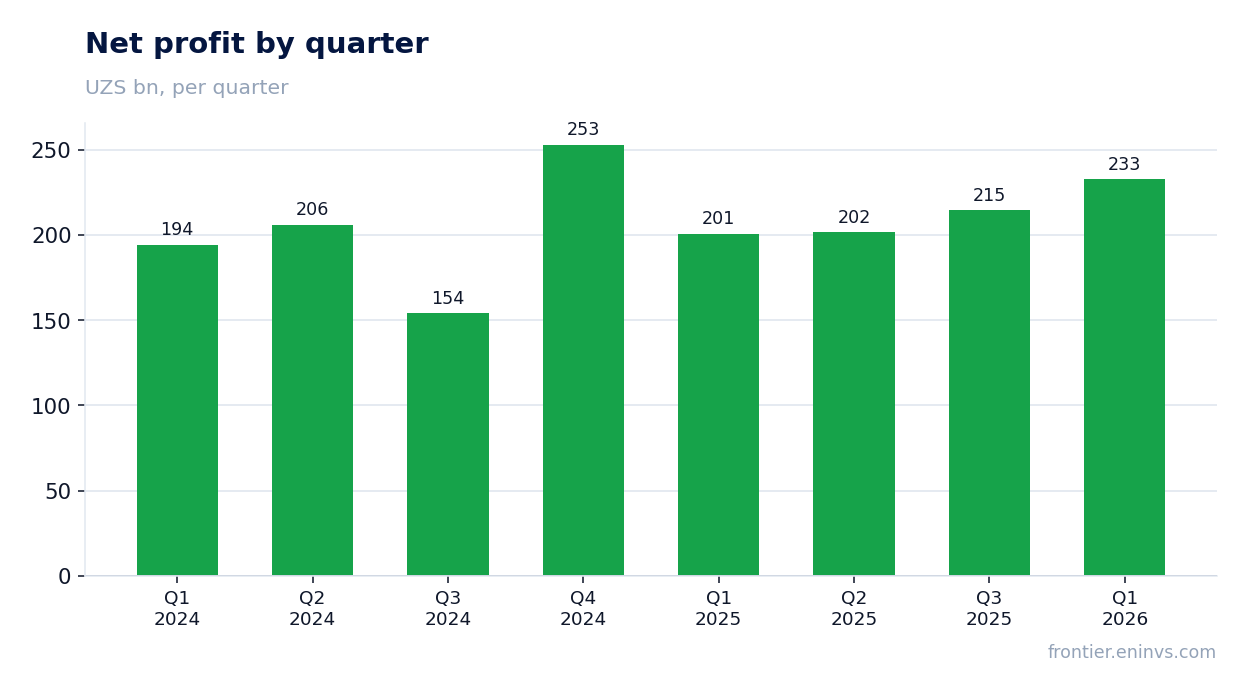
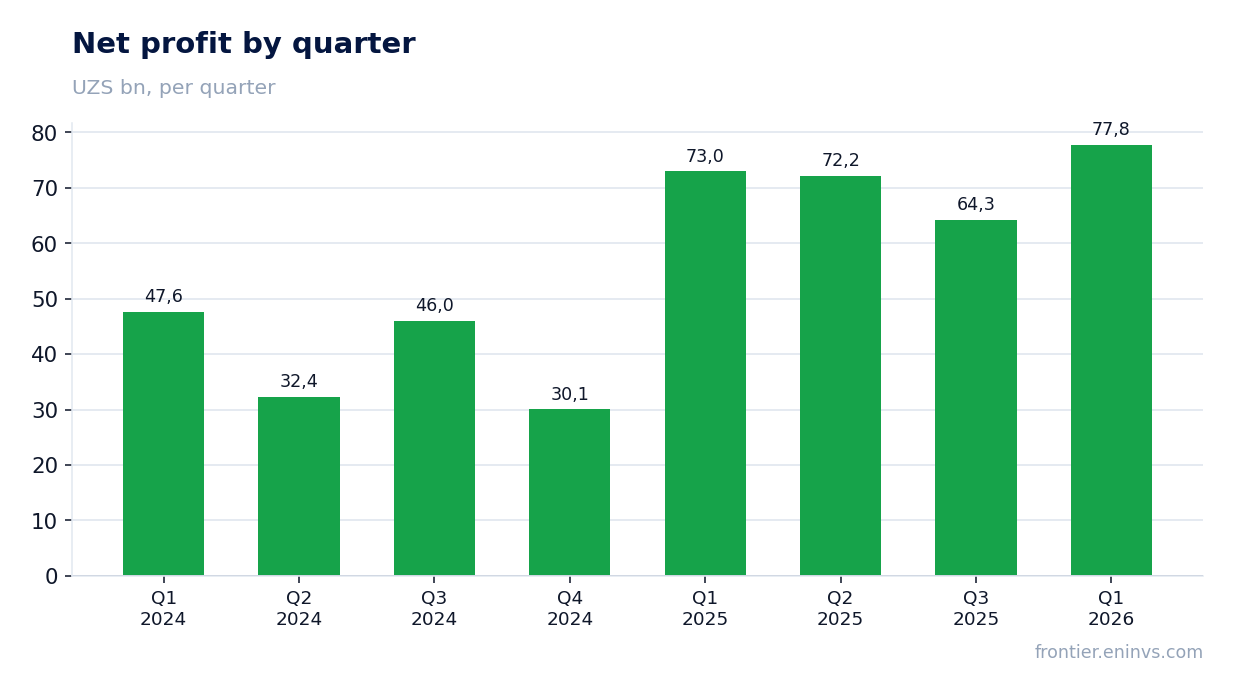
Net profit by quarter

Net margin of 30.9% versus 34.8% a year earlier – profit is growing slower than revenue for a third quarter

Net margin in Q3 2026 was 30.9%, versus 34.8% a year earlier. The 3.9 percentage point compression explains why profit grew only 10.7% while revenue rose 24.6%. This is not a one-off: the margin is declining consistently.

Profit has grown slower than revenue for three consecutive quarters. In Q1 2026 net profit was UZS 467.7 bn, in Q2 – UZS 502.3 bn, in Q3 – UZS 510.5 bn. There is growth, but it is modest relative to revenue dynamics.

Margin compression is the key risk for valuation. If it continues, profit may stop growing even as revenue accelerates. Stabilisation of the margin, not further revenue acceleration, will determine whether the bank can improve its financial result.

ROE of 8.6% on a market cap of UZS 8,518.4 bn – the return on capital remains modest

Hamkorbank's return on equity (ROE) is 8.6%. With a market capitalisation of UZS 8,518.4 bn, this is a modest figure for a bank. For comparison, Q3 profit of UZS 510.5 bn on such a market cap implies an annualised return of about 24% from one quarter alone, but ROE accounts for all capital, not just market valuation.

A low ROE means the bank is not using capital efficiently. This limits the potential for dividend growth and valuation re-rating. Improving ROE requires either higher profit, capital reduction, or both.

On the portal's model, based on the ROE-to-P/B relationship, the share trades at a +24% discount to fair value. This is our own calculation, not a market consensus. It implies the current price does not fully reflect the bank's profitability.

Dividend yield of 0.88% over the last 12 months – the payout is symbolic relative to profit

Hamkorbank's dividend yield over the last 12 months is 0.88%. With a market capitalisation of UZS 8,518.4 bn, this implies about UZS 75 bn was paid in dividends. That is a small amount relative to quarterly profit of UZS 510.5 bn.

The low payout is likely explained by the need to maintain capital. With ROE at 8.6%, the bank does not generate excess capital that can be distributed. Judging by actual payments, the dividend policy is conservative.

For an income-oriented investor, a dividend yield of 0.88% is unattractive. The main return can only come from share price appreciation, not from payouts. This is important to consider when assessing the attractiveness of the stock.
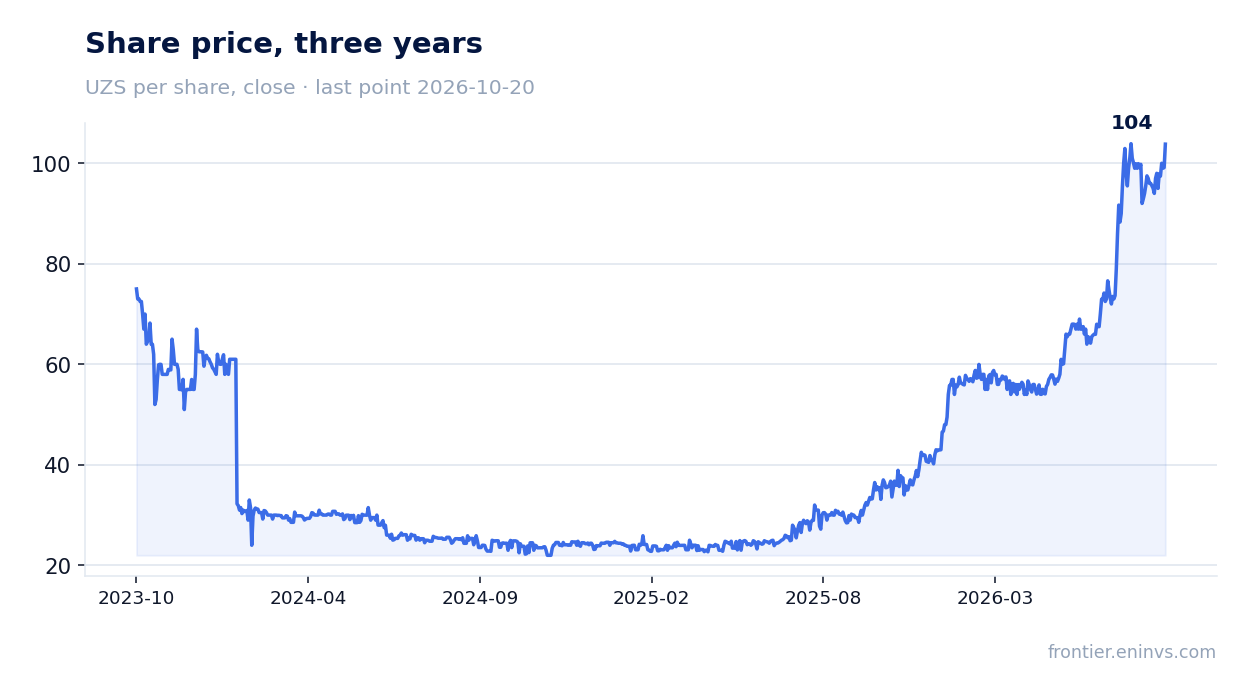
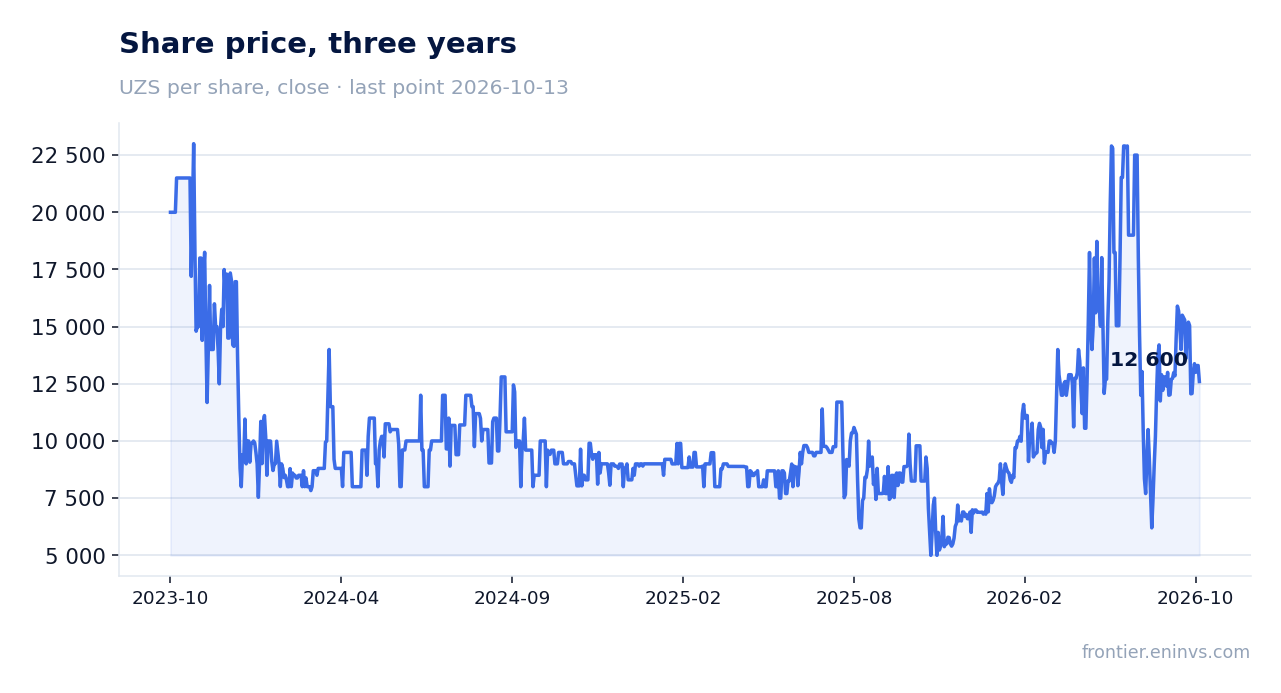
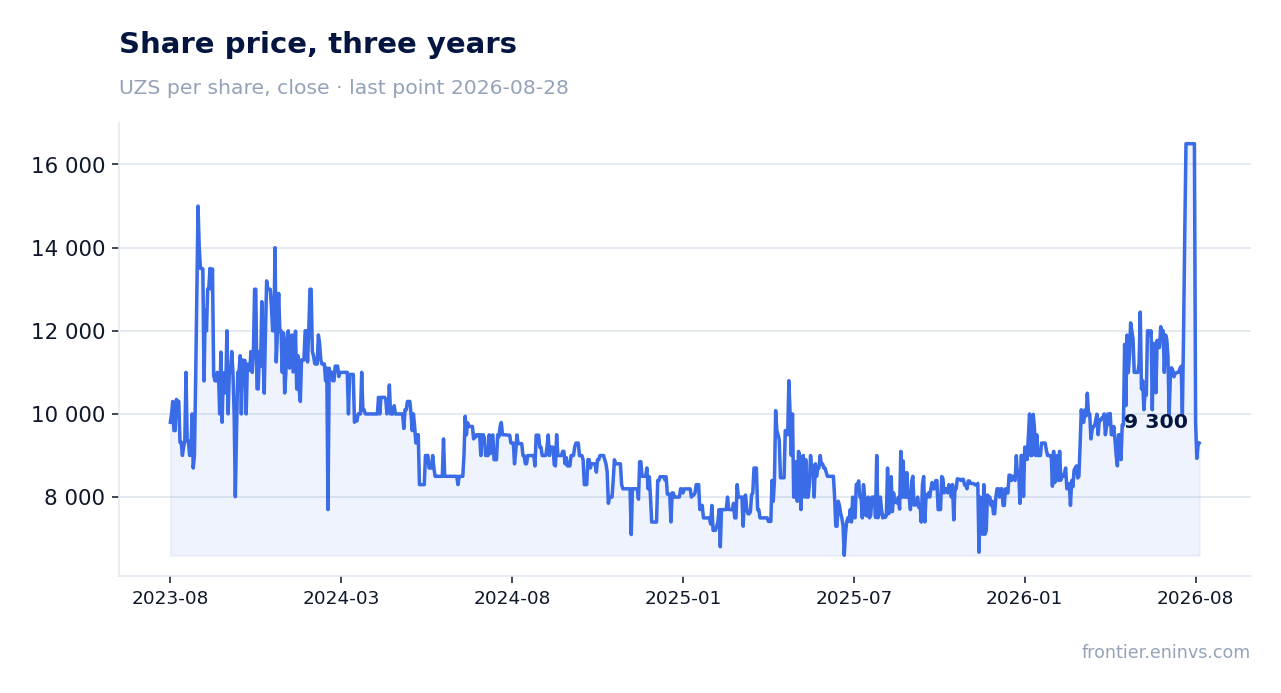
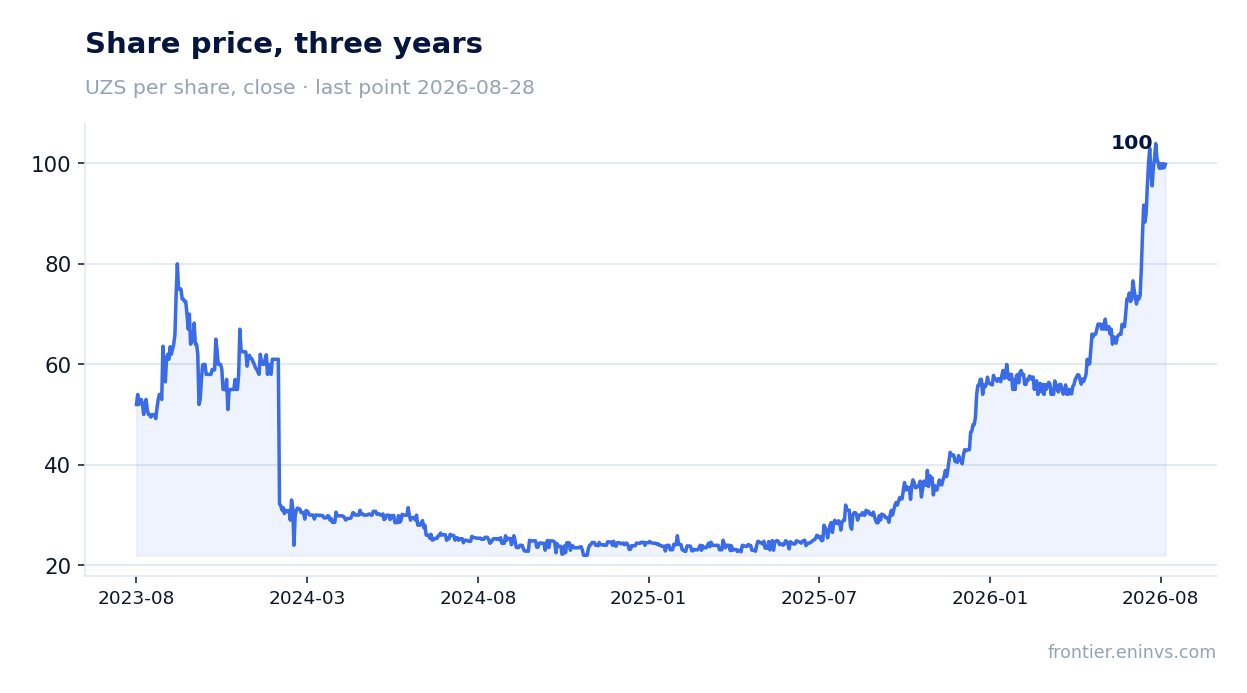
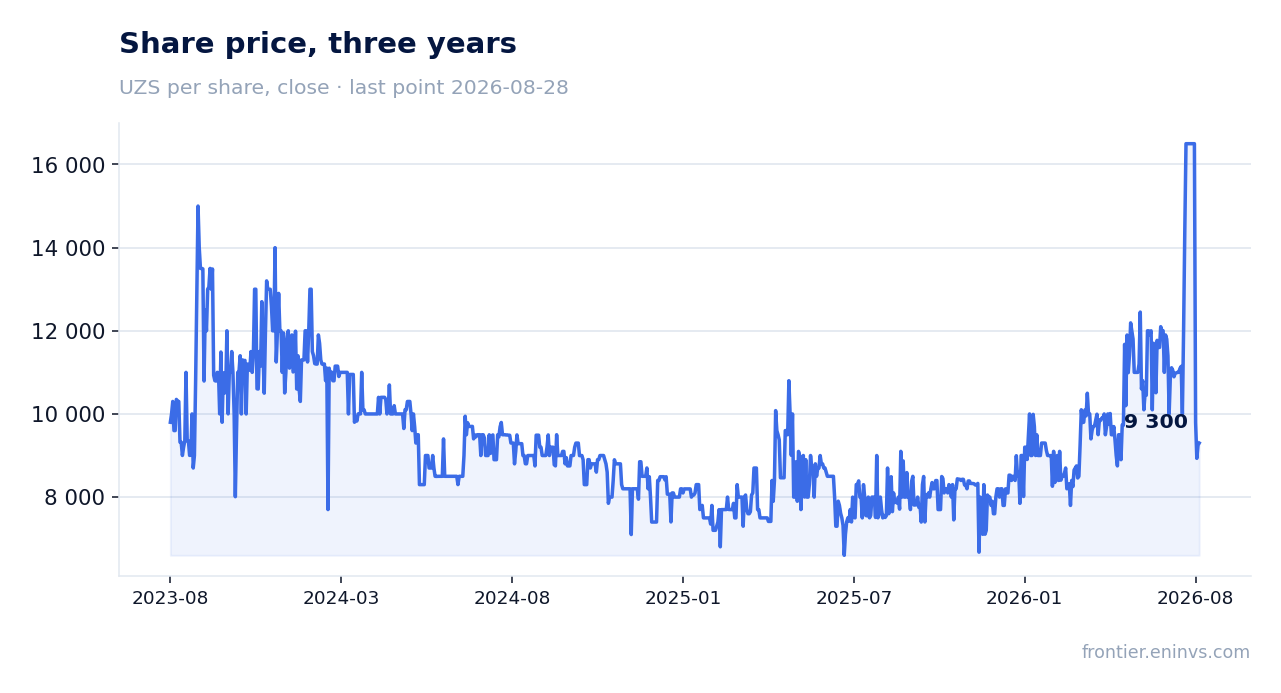
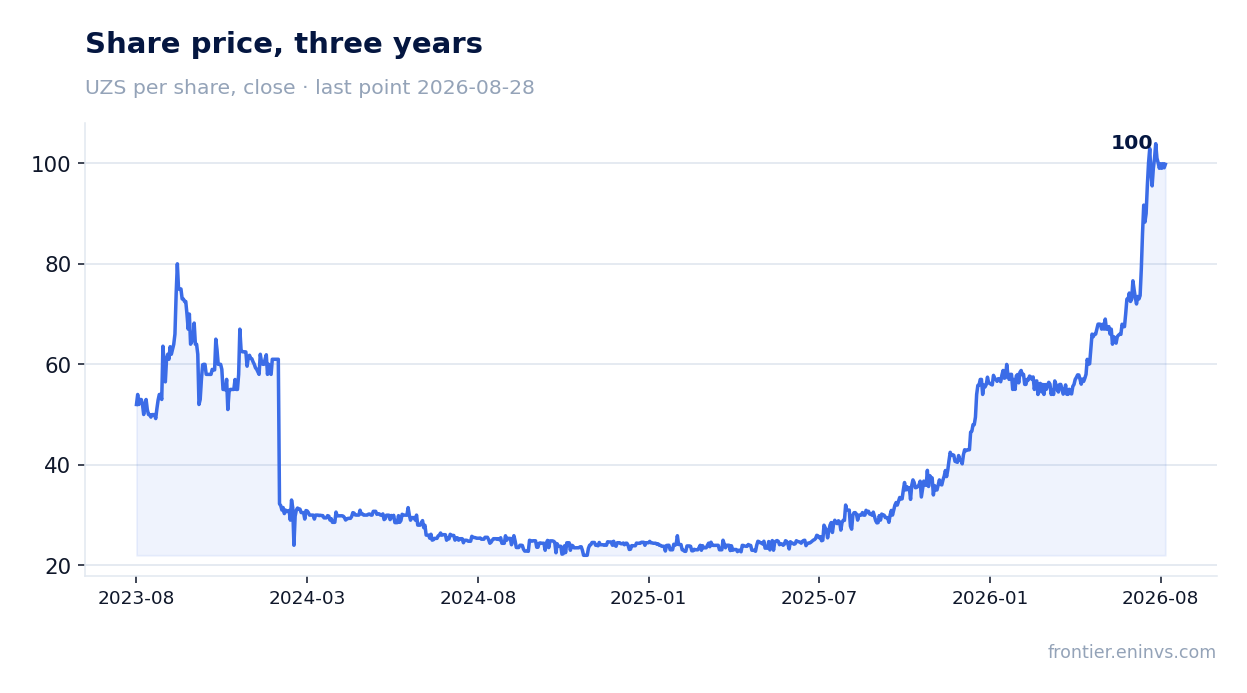
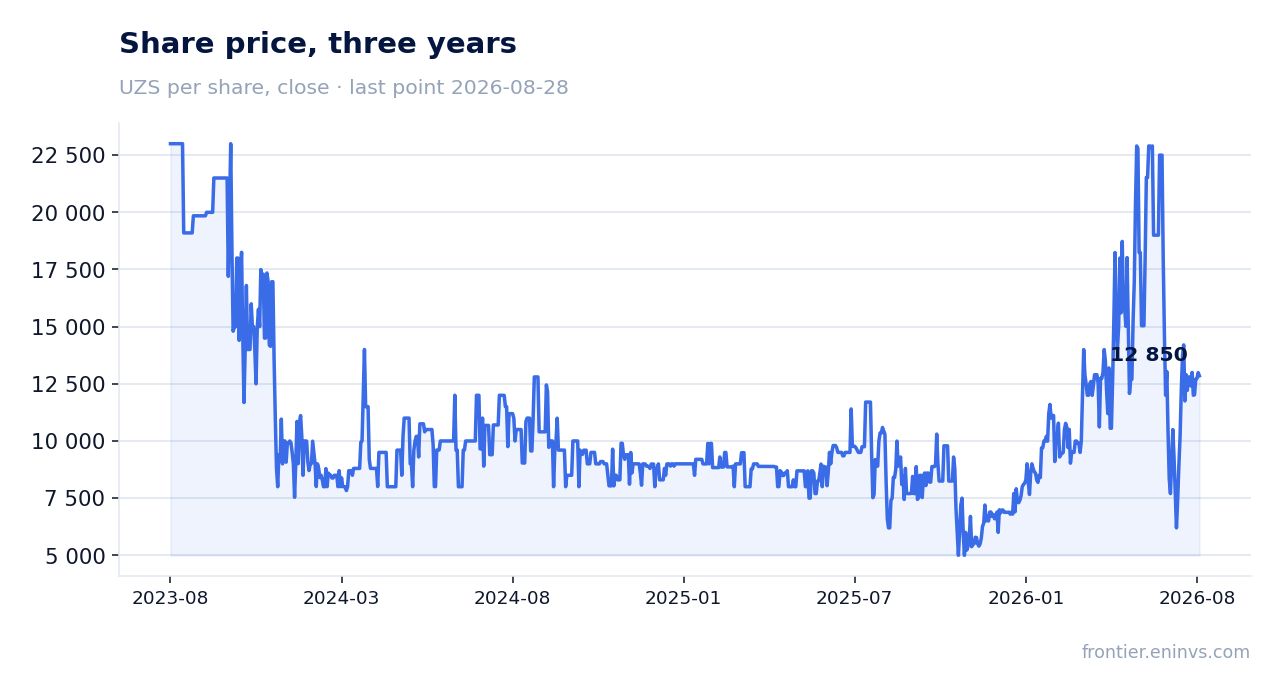
Share price, three years

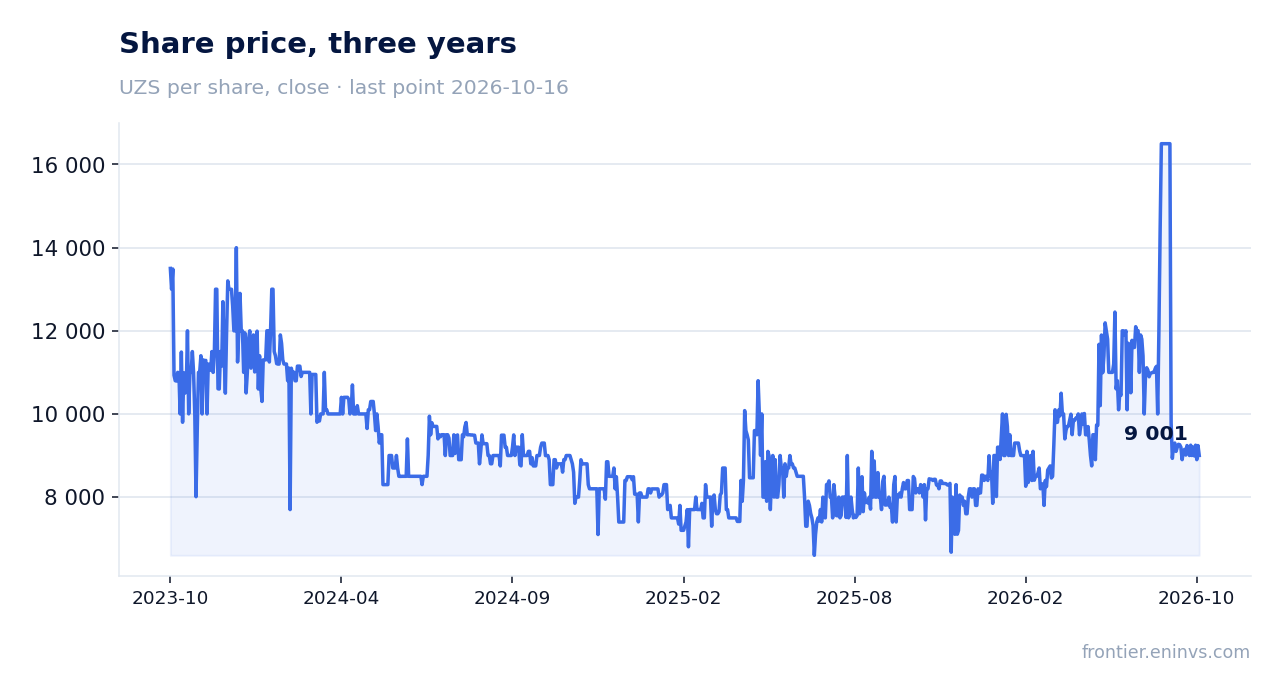
On the portal's model the share trades at a +24% discount to fair value, but that is our calculation, not a consensus

On the portal's model, which compares ROE with P/B, the fair value of Hamkorbank shares is +24% above the current price. This is our own calculation, not a consensus forecast or a target price. The model implies the market undervalues the bank's profitability.

However, the model does not account for the risk of further margin compression. If net margin continues to fall, profit may decline and fair value would be lower. In addition, ROE of 8.6% is a modest figure that limits re-rating potential.

Realising the +24% potential requires margin stabilisation and ROE growth. Without that, the discount could persist for a long time. The model provides a benchmark, not a guarantee.

Valuation on the latest reported figures

MetricValue
Market cap8 518 bn UZS
P/B1.04
ROE8.6%
Dividend yield (12m)0.9%

Bottom line

The strong point of the report is revenue acceleration to +24.6% YoY, above +23.8% in Q2. The weak point is net margin compression to 30.9% from 34.8%, which meant profit grew only +10.7%. ROE of 8.6% and a dividend yield of 0.88% do not create appeal. The portal's model implies +24% upside, but it requires margin stabilisation. The verdict is neutral: revenue acceleration is offset by margin decline, and the current valuation offers no clear edge.
UZ_TRUST: revenue accelerated to +48.3%, but profit lagged – margin compressed by 6.7 pp

TRUST →
UZ_TRUST

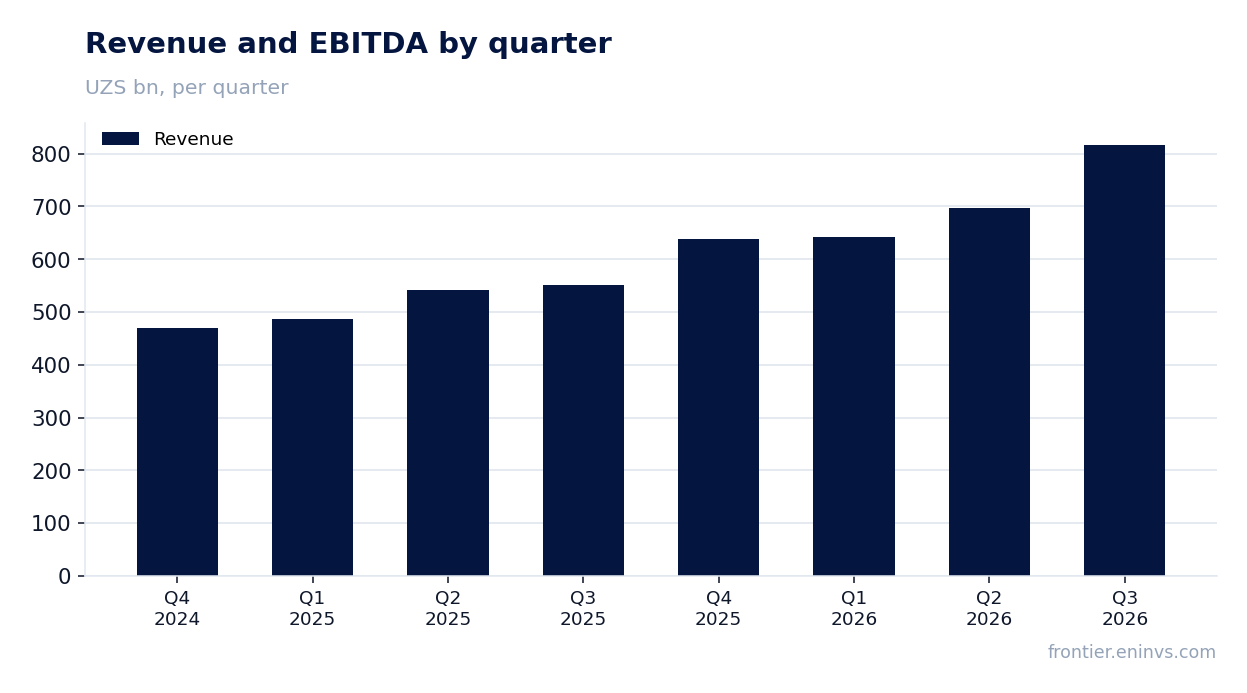
In its Q3 2026 report, UZ_TRUST posted revenue of 817,027.3 mn UZS, operating profit of 316,512.6 mn UZS and net profit of 262,964.1 mn UZS. Revenue grew 48.3% year on year – faster than the prior quarter (+29.0%) – but net profit added only 22.6%, and the net margin fell to 32.2% from 38.9% a year earlier. At a P/E LTM of 11.8 and a dividend yield of 6.1%, the share looks rather attractive, but the margin compression is the main counterargument.

Key takeaways

— Revenue accelerated to +48.3% year on year, but profit grew only 22.6% – the margin did not hold

— Net margin fell to 32.2% from 38.9%, and the entire revenue gain went into costs

— Operating profit of 316,512.6 mn UZS on revenue of 817,027.3 mn UZS implies an operating margin of 38.7%

— Over the trailing twelve months, net profit was 1,015,063.9 mn UZS on revenue of 1,545,400.0 mn UZS

— A 6.1% dividend yield against a P/E LTM of 11.8 keeps the payout the main argument for the share

— On the portal's model, the upside to fair value is estimated at +9%

Attractiveness

Key figures, UZS bn

MetricQ3 2025Q3 2026Change
Revenue551817+48.3%
Operating profit—317—
Net profit215263+22.6%
Net margin38.9%32.2%-6.7 pp

Revenue accelerated to +48.3% year on year, but profit grew only 22.6% – the margin did not hold

In Q3 2026, revenue was 817,027.3 mn UZS, up 48.3% year on year. That is markedly faster than in Q2 2026, when growth was 29.0%: the acceleration is confirmed by comparing the two reported quarters.

Net profit for the same quarter was 262,964.1 mn UZS, up only 22.6% year on year. The gap between revenue and profit dynamics means costs grew faster than income, and that is the central fact of the report.

For a holder, what matters more than revenue growth itself is that it no longer converts into profit with the same force. Accelerating revenue alongside decelerating profit signals either price cuts or extra costs, the nature of which the report does not disclose.

Revenue and EBITDA by quarter

Net margin fell to 32.2% from 38.9%, and the entire revenue gain went into costs

The net margin in Q3 2026 was 32.2% against 38.9% a year earlier. A 6.7 percentage point compression is the price of the revenue acceleration.

With revenue of 817,027.3 mn UZS and net profit of 262,964.1 mn UZS, each percentage point of margin is worth about 8.2 bn UZS of profit. Losing 6.7 pp means that at last year's margin, profit would have been materially higher than reported.

The report gives no cost-line breakdown, so the specific cause of the compression cannot be named. All that is visible is that operating profit of 316,512.6 mn UZS on revenue of 817,027.3 mn UZS implies a 38.7% operating margin – pressure on profit therefore arises below the operating line or in operating costs the report does not separately disclose.

Net profit by quarter

Operating profit of 316,512.6 mn UZS on revenue of 817,027.3 mn UZS implies an operating margin of 38.7%

Operating profit in Q3 2026 was 316,512.6 mn UZS. That is 11.1% more than in Q2 2026 (289,154.0 mn UZS), but operating profit growth quarter on quarter is more modest than revenue growth over the same period.

The 38.7% operating margin sits 6.5 pp above the net margin. The gap between operating and net profit (53,548.5 mn UZS) is interest, taxes and other items below the operating line.

For assessing business resilience, the operating margin matters more than the net one: it is not distorted by one-off items below the operating line. At 38.7%, it shows the core business remains highly profitable, and the net margin compression occurs at the level of financial and tax items.

Over the trailing twelve months, net profit was 1,015,063.9 mn UZS on revenue of 1,545,400.0 mn UZS

The trailing twelve months give a steadier picture than a single quarter: revenue of 1,545,400.0 mn UZS and net profit of 1,015,063.9 mn UZS. The net margin over that period is 65.7%, above the quarterly 32.2%.

The gap between the LTM margin and the quarterly one reflects a higher profit share in revenue in earlier quarters. This confirms the margin compression is a recent phenomenon rather than a stable feature of the business.

The P/E of 11.8 rests on LTM profit. If the quarterly margin compression persists, annual profit will come in below the LTM figure, and the forward multiple will be above 11.8.

A 6.1% dividend yield against a P/E LTM of 11.8 keeps the payout the main argument for the share

The trailing twelve-month dividend yield is 6.1%. Against a market capitalisation of 12,000,759.5 mn UZS, that corresponds to payouts of about 728.5 bn UZS, or roughly 72% of LTM profit of 1,015,063.9 mn UZS.

Our estimate for the current year's dividend assumes the payout ratio stays near 72% and profit stays close to the LTM level. On that base, the payout will remain within 6% of the current price. The main risk to it is further margin compression: if the 32.2% quarterly margin becomes the norm, annual profit will fall below LTM and the dividend will shrink proportionally.

A 6.1% yield is comparable to the risk-free rate but offers little premium over it. For a share with rising revenue and a compressing margin, that is not enough to offset the uncertainty around profit.

Share price, three years

On the portal's model, the upside to fair value is estimated at +9%

On the portal's model, which compares ROE of 8.6% with P/B, the upside to fair value is estimated at +9%. This is the portal's own estimate, not a market consensus or a target price.

A P/E LTM of 11.8 against an ROE of 8.6% means the market pays a moderate price for earnings, but the return on capital is also low. A low ROE combined with a modest multiple leaves little room for re-rating without profit growth.

The +9% upside is moderate. It materialises if profit holds at the LTM level; with the margin compression seen in Q3, fair value on the model would be lower.

Valuation on the latest reported figures

MetricValue
Market cap12 001 bn UZS
P/E (LTM)11.8
P/B4.11
ROE8.6%
Dividend yield (12m)6.1%

Bottom line

The report's strength remains revenue: acceleration to +48.3% year on year and a 38.7% operating margin show the core business is growing and highly profitable. The weakness is the conversion of that growth into profit: the net margin fell to 32.2% from 38.9%, and profit grew only 22.6%. A 6.1% dividend yield and a P/E of 11.8 against a +9% upside on the portal's model support the valuation but do not outweigh the risk of further margin compression. The verdict is rather attractive: the share is inexpensive and pays a dividend, but an upgrade needs a margin reversal, while a downgrade needs only the margin to stay at the quarterly level.

Trust outruns the pack while Universal's profit engine sputters

This season's defining split isn't revenue — it's profit. Three of the four reporters grew sales at a healthy clip, but only two converted that into faster bottom-line growth. The outlier is Universal: revenue up 21.6% year over year yet net profit down 38.4%. That gap between the top line and the bottom line is the story of the quarter, and it separates the real operators from the revenue tourists.

Revenue growth, biggest movers (YoY)

TRUST (Q2)29HAMKOR (Q2)24UNIVERSAL (Q3)22UZEX (H1)11029
revenue YoY, %

Trust and Hamkor delivered the cleanest growth — and it flowed straight to the bottom line

Trust is the standout: revenue up 29.0% year over year and net profit up an even faster 34.5%, meaning margins expanded. That is the combination growth investors pay for. Hamkor is close behind with revenue up 23.8% and net profit up 21.5% — slightly slower than the top line, but still a solid double-digit expansion that suggests pricing power held.

UZEX is the quiet steady grower: revenue up 11.4% and net profit up 18.6%, with profit again outpacing sales. It won't win a sprint, but it compounds. In a season where one name is bleeding profit, UZEX's consistency looks increasingly valuable.

Universal's revenue growth is a warning sign, not a victory

Universal grew revenue 21.6% yet net profit collapsed 38.4%. That is the ugliest print of the season. When sales rise and profit falls, either costs are out of control or the mix has shifted to lower-margin business. Either way, the market should treat this as a margin-compression red flag, not a growth story. It is the only name here where the bottom line moved in the opposite direction of the top line.

The plot twist: UZEX slowed, but only slightly — and that's the point

UZEX's revenue growth decelerated from +11.8% in the prior period to +11.4%, and net profit growth slowed from +20.5% to +18.6%. On the surface that's a deceleration. But the magnitude is tiny — a rounding error, not a trend break. The real twist is that UZEX's profit growth still outpaces its revenue growth by a wide margin, meaning the business is getting more efficient even as the top line cools. In a season where Universal's profit imploded, UZEX's gentle slowdown looks like stability, not weakness.

Universal is cheap for a reason; Trust is priced for its execution

Universal trades at just 6.0x earnings — the cheapest multiple here — but with net profit down 38.4%, that low P/E is a value trap until margins stabilize. Trust, growing profit at 34.5%, trades at 12.4x. That is not cheap in absolute terms, but for that growth rate it is more than fair — the PEG ratio looks attractive. UZEX at 9.1x with 18.6% profit growth sits in the sweet spot: cheaper than Trust, growing faster than its multiple implies. For a value-focused reader, UZEX offers the best growth-adjusted valuation; Universal offers the most risk.

No dividend data this season — total return rests on earnings growth

None of the reported companies disclosed a dividend yield or DPS in the data provided. That means the investment case here is purely about earnings growth and multiple re-rating, not income. For yield-seekers, this cohort offers nothing to work with this quarter.

Only UZEX has a three-year revenue CAGR on record — +4.2% — a modest but steady compounding rate. That long-run consistency, combined with its 9.1x P/E and 18.6% profit growth, makes it the most balanced name in the group. The next thing to watch is Universal's margin trajectory: if profit keeps falling while revenue rises, the 6.0x multiple will look deserved, not cheap. Trust remains the momentum pick, but at 12.4x it now needs to keep delivering 30%+ growth to justify the price. The season's verdict: execution beats revenue, and profit quality is the only scoreboard that matters.

Players: growth & yield (no absolute levels)

CompanyRevenue YoYNet profit YoYP/E
HAMKOR (Q2)+23.8%+21.5%n/m
TRUST (Q2)+29.0%+34.5%12.4x
UZEX (H1)+11.4%+18.6%9.1x
UNIVERSAL (Q3)+21.6%-38.4%6.0x

UZ_UNIVERSAL: profit fell 38.4% even as revenue rose 21.6% — margin returned to normal after an exceptional quarter

UNIVERSAL →
UZ_UNIVERSAL

UZ_UNIVERSAL's third-quarter 2026 report showed revenue of 217.3 bn soums (+21.6% year on year) and net profit of 39.6 bn soums (–38.4% year on year). Net margin fell to 18.2% from 35.9% a year earlier, largely because the prior-year base was exceptionally high. At the current price the share looks rather attractive: P/E LTM 6.05, dividend yield 4.43%, and the portal's model implies 12% upside to fair value.

Key takeaways

— Revenue rose 21.6% year on year, but this is a deceleration from 26.6% a quarter earlier

— Net profit fell 38.4% due to a high prior-year base, not because the business deteriorated

— Net margin declined to 18.2% from 35.9%, returning to a more sustainable level

— Operating profit of 45.1 bn soums produced a 20.8% margin — above the fourth quarter of 2025

— A 4.43% dividend yield with a P/E of 6.05 makes the share interesting for income

— The portal's model implies 12% upside to fair value

Attractiveness

Key figures, UZS bn

MetricQ3 2025Q3 2026Change
Revenue179217+21.6%
Operating profit—45.1—
Net profit64.339.6-38.4%
Net margin35.9%18.2%-17.7 pp

Revenue rose 21.6% year on year, but this is a deceleration from 26.6% a quarter earlier

In the third quarter of 2026, revenue reached 217.3 bn soums, up 21.6% year on year. This continues the growth trend, but the pace has slowed: in the previous quarter growth was 26.6%. The deceleration may reflect a high base effect as well as possible demand saturation.

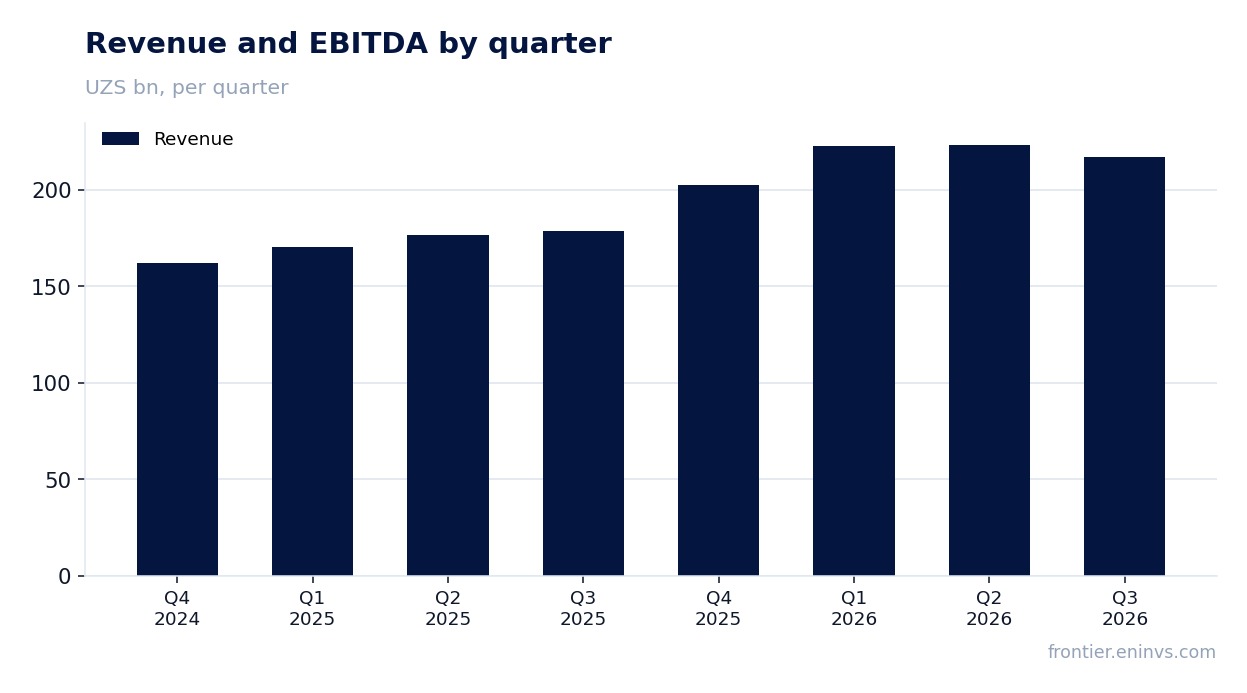
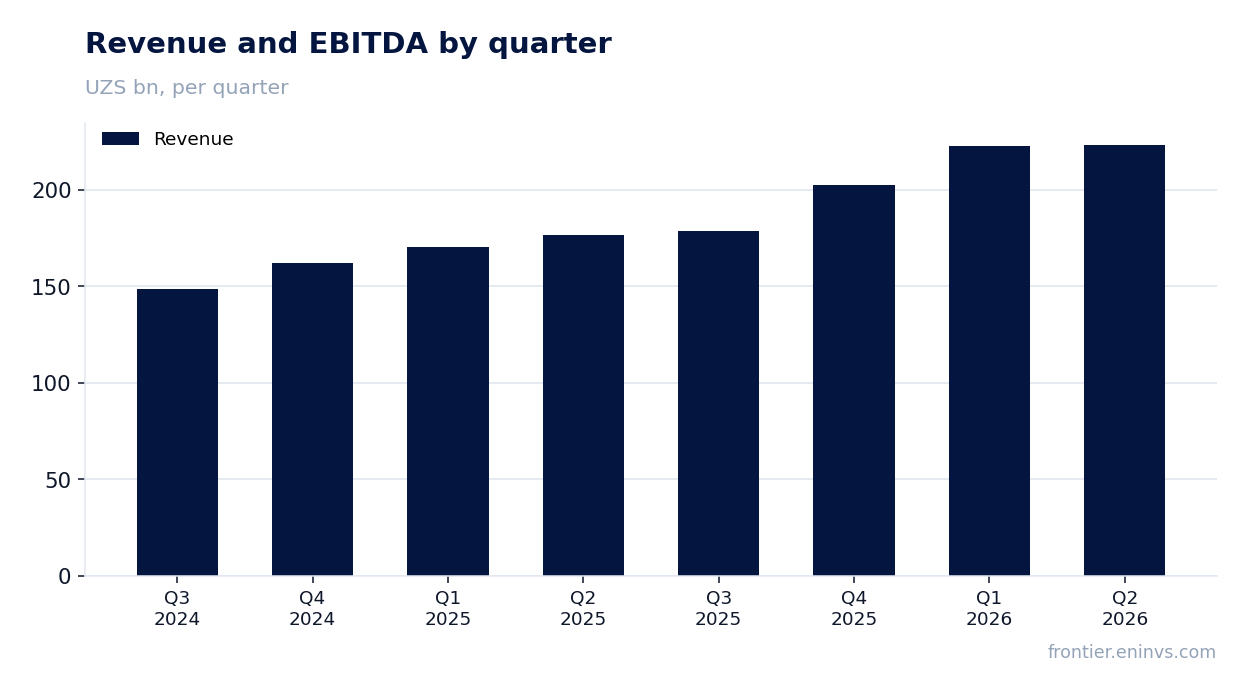
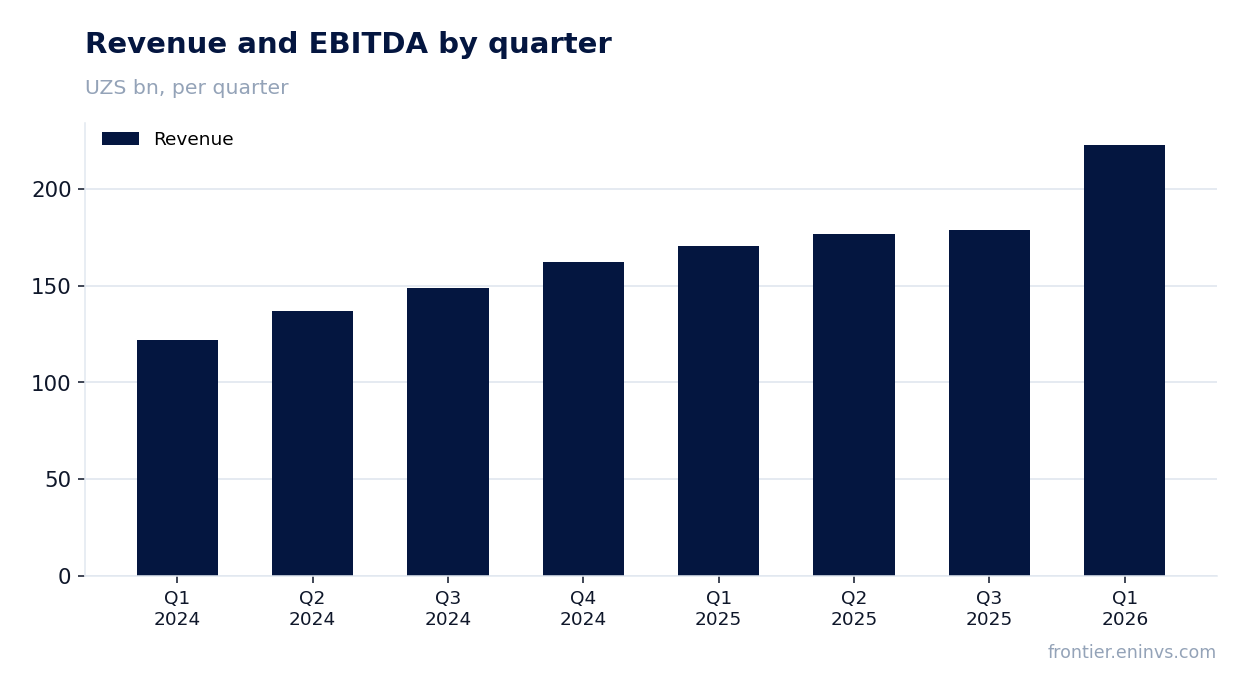
Compared with the fourth quarter of 2024 (162.2 bn soums), revenue is up 34%. However, quarterly dynamics are uneven: after a peak of 223.5 bn soums in the second quarter of 2026, revenue fell to 217.3 bn soums. This could be seasonal, but the report does not specify the reasons.

For the investor, the key point is that the company maintains double-digit growth, but the slowdown from 26.6% to 21.6% is a signal to watch in the next report. If the deceleration continues, it could limit profit growth going forward.

Revenue and EBITDA by quarter

Net profit fell 38.4% due to a high prior-year base, not because the business deteriorated

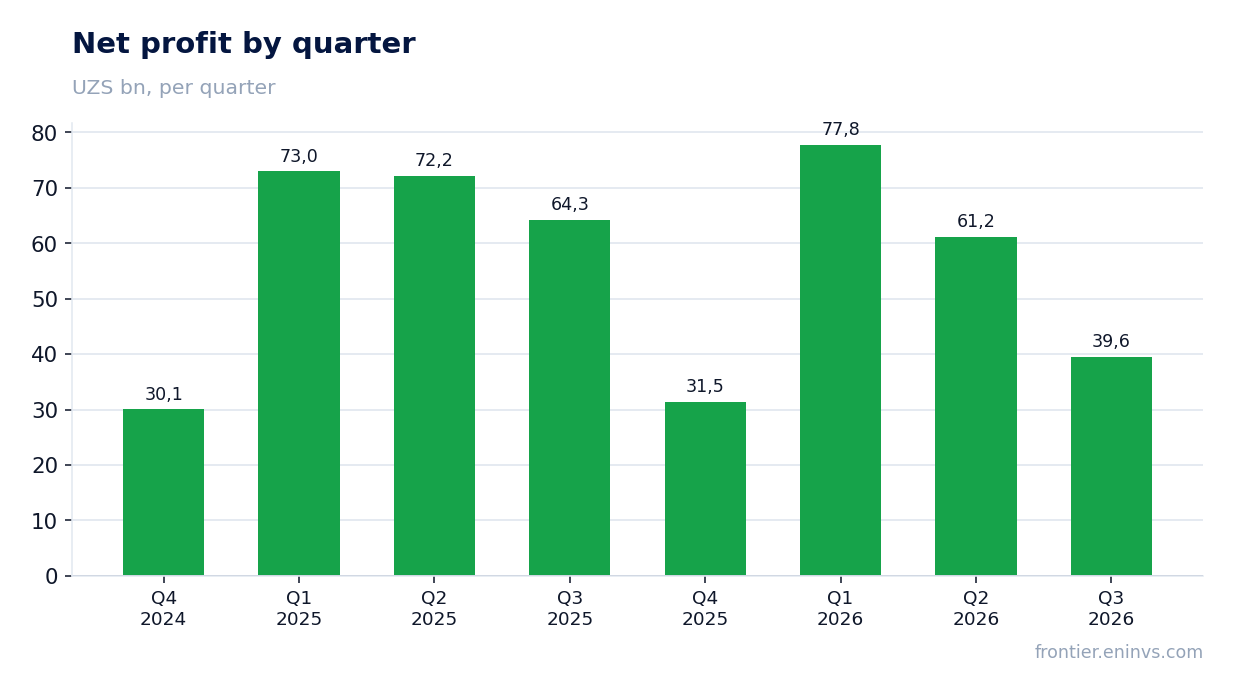
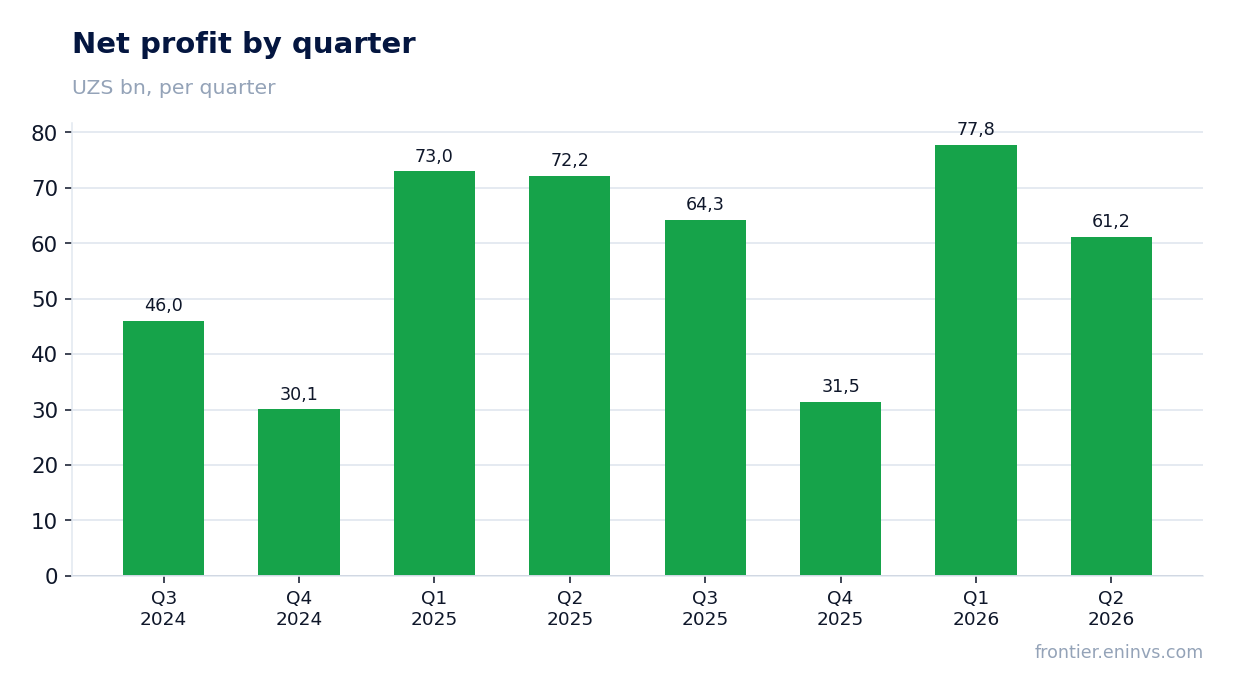
Net profit in the third quarter of 2026 was 39.6 bn soums, down 38.4% year on year. A year earlier, profit was 64.3 bn soums — an exceptionally high level. The decline is mainly due to the base effect, not a deterioration in operations.

Operating profit in the reporting quarter was 45.1 bn soums, higher than in the fourth quarter of 2025 (39.7 bn soums). This indicates the business remains profitable at the operating level. The gap between operating and net profit may be due to taxes or one-off items, but details are not disclosed in the report.

It is worth noting that in the first quarter of 2026 profit was 77.8 bn soums, and in the second quarter — 61.2 bn soums. The current 39.6 bn soums continues the decline from peak levels earlier in the year. This may indicate a normalization of profit after a period of high performance.

Net profit by quarter

Net margin declined to 18.2% from 35.9%, returning to a more sustainable level

Net margin in the third quarter of 2026 was 18.2%, compared with 35.9% a year earlier. This decline reflects both revenue growth and profit fall. In absolute terms, profit decreased while revenue increased, leading to margin compression.

For comparison: in the fourth quarter of 2025, net profit was 31.5 bn soums on revenue of 202.4 bn soums, implying a margin of about 15.5%. Thus, the current 18.2% is higher than at the end of 2025 but significantly below the peak levels of early 2026, when margin exceeded 30%.

The margin decline may be due to rising costs or a change in revenue structure, but the report does not specify the factors. For the investor, it is important that profitability remains in double digits and the company can generate profit even at a lower margin.

Operating profit of 45.1 bn soums produced a 20.8% margin — above the fourth quarter of 2025

Operating profit in the third quarter of 2026 was 45.1 bn soums, corresponding to an operating margin of 20.8%. This is higher than in the fourth quarter of 2025, when operating profit was 39.7 bn soums on revenue of 202.4 bn soums (margin 19.6%).

The year-on-year increase in operating margin may be due to cost control or business mix improvement. However, the report does not provide a breakdown of expenses, so the exact reasons are not disclosed.

Operating profit is an important metric as it reflects the efficiency of core operations before financial and tax factors. The current level of 45.1 bn soums confirms that the company remains profitable at the operating level despite the decline in net profit.

A 4.43% dividend yield with a P/E of 6.05 makes the share interesting for income

The dividend yield over the last 12 months is 4.43%. This is a moderate level that may attract income-oriented investors. At the same time, the P/E LTM is 6.05, indicating a low valuation on earnings.

It is worth considering that dividend payments may be unstable, as the company's profit is subject to fluctuations. In the third quarter of 2026, net profit declined, which could affect future dividends if the trend continues.

Nevertheless, the current yield of 4.43% exceeds many risk-free rates, making the share attractive for conservative investors. However, the dividend decision depends on the company's financial policy and its profit.

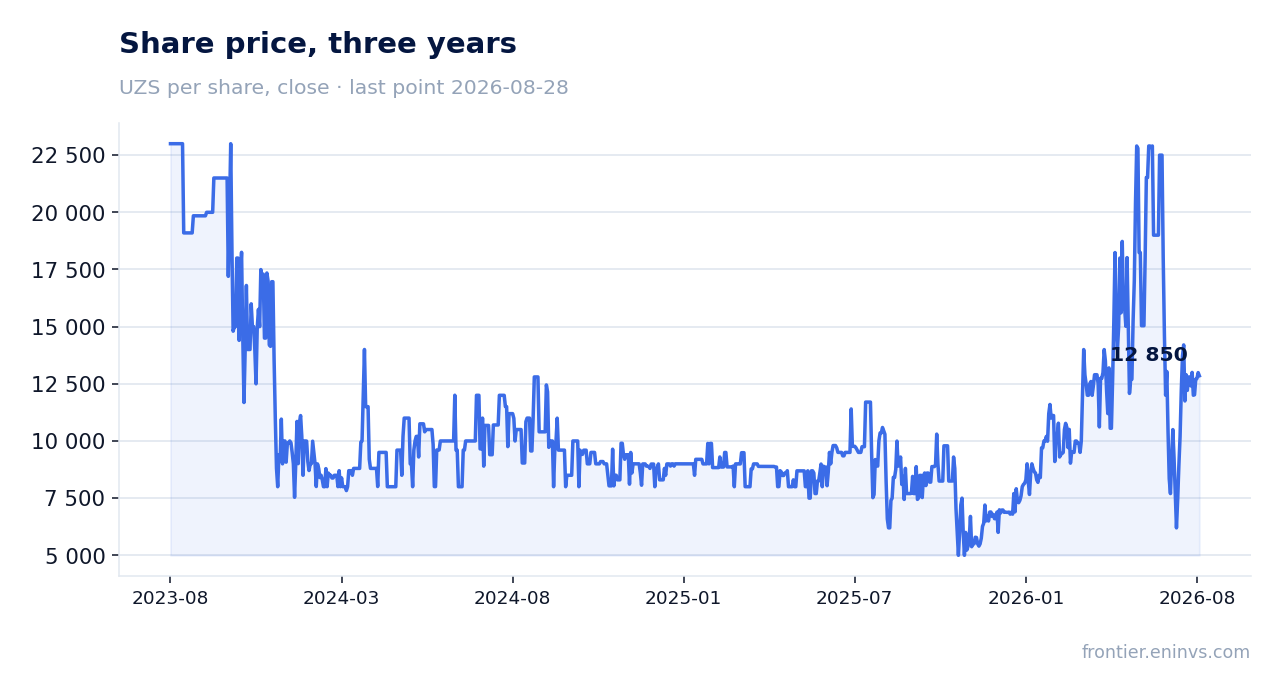
Share price, three years

The portal's model implies 12% upside to fair value

According to the portal's model, the upside to fair value is +12%. This is the portal's own estimate based on annualised earnings and market capitalisation, not a market consensus forecast.

The model takes into account current earnings and multiples, and its result suggests the share may be undervalued. However, this is just one estimate and does not guarantee future growth.

For the investor, it is important to weigh this estimate against risks: slowing revenue and declining profit could lead to a downward revision of fair value. Nevertheless, the current 12% upside looks moderately attractive.

Valuation on the latest reported figures

MetricValue
Market cap1 270 bn UZS
P/E (LTM)6.0
P/B2.10
ROE5.8%
Dividend yield (12m)4.4%

Bottom line

UZ_UNIVERSAL's revenue rose 21.6% year on year, but the pace slowed compared with the previous quarter. Net profit fell 38.4% due to a high prior-year base, and margin declined to 18.2% — a return to a more sustainable level after an exceptional period. Operating profit of 45.1 bn soums remains solid, while a 4.43% dividend yield and a P/E of 6.05 make the share attractive for income-oriented investors. The portal's model implies 12% upside to fair value. The key question for a holder is whether the company can maintain profit at current levels and preserve dividends.

UZ_UZEX: H1 profit up 18.6%, but quarterly revenue growth decelerated to 11.8%

UZEX →
UZ_UZEX

On August 25, UZ_UZEX released its results for the first half of 2026. H1 revenue reached 264,737.8 mln UZS (+11.4% YoY), net profit was 221,484.3 mln UZS (+18.6% YoY), and net margin hit 83.7% versus 78.6% a year earlier. In the standalone first quarter of 2026, revenue grew 11.8% YoY after 17.5% in Q1 2025 – growth decelerated. At the current price, the share looks attractive: P/E LTM 9.06, ROE 91.2%, dividend yield 15.8%.

Key takeaways

— H1 revenue grew 11.4% YoY, but in the standalone first quarter growth decelerated to 11.8% from 17.5% a year earlier

— H1 net profit added 18.6% YoY, with margin rising to 83.7% from 78.6%

— LTM net profit reached 343,457.8 mln UZS, with revenue at 444,500.0 mln UZS

— Dividend yield over the last 12 months is 15.8%, well above the key rate

— P/E LTM 9.06 with ROE 91.2% – valuation remains low relative to its own history

— Revenue growth in Q1 2026 decelerated to 11.8% from 17.5% in Q1 2025

Attractiveness

Key figures, UZS bn

MetricH1 2025H1 2026Change
Revenue238265+11.4%
Operating profit135158+16.8%
Net profit187221+18.6%
Net margin78.6%83.7%+5.1 pp

H1 revenue grew 11.4% YoY, but in the standalone first quarter growth decelerated to 11.8% from 17.5% a year earlier

H1 2026 revenue reached 264,737.8 mln UZS, up 11.4% from the same period last year. In the standalone first quarter of 2026, revenue was 140,383.8 mln UZS, up 11.8% YoY. This is a deceleration from 17.5% in Q1 2025.

Quarterly dynamics show revenue growth slowing: Q1 2024 grew 12.8%, Q1 2025 grew 17.5%, and Q1 2026 grew 11.8%. The deceleration may be due to a high base effect, but the exact cause is not specified in the provided data.

Revenue and EBITDA by quarter

H1 net profit added 18.6% YoY, with margin rising to 83.7% from 78.6%

H1 2026 net profit reached 221,484.3 mln UZS, up 18.6% YoY. Net margin rose to 83.7% from 78.6% a year earlier. Such a margin level means almost all revenue converts into profit.

The margin expansion of 5.1 percentage points occurred with revenue growth of 11.4%. Operating profit for H1 was 157,748.1 mln UZS, which is below net profit – this indicates that a significant portion of profit came from non-operating income. The provided data does not detail these incomes.

Net profit by quarter

LTM net profit reached 343,457.8 mln UZS, with revenue at 444,500.0 mln UZS

Over the last 12 months, net profit was 343,457.8 mln UZS, and revenue was 444,500.0 mln UZS. These figures are used to calculate multiples and dividend yield.

The LTM profit-to-revenue ratio is 77.3%, lower than the H1 2026 margin of 83.7%. This may indicate that margin was lower in the second half of 2025.

Dividend yield over the last 12 months is 15.8%, well above the key rate

Dividend yield over the last 12 months is 15.8%. This is a high figure, significantly exceeding the current key rate. Payments for the last year are not detailed, but the yield is calculated based on actual dividends.

If current profit and payout ratio are maintained, dividend yield may remain at an attractive level. However, a decline in profit or a change in dividend policy could reduce payouts.

P/E LTM 9.06 with ROE 91.2% – valuation remains low relative to its own history

The LTM P/E multiple is 9.06. With a return on equity of 91.2%, this valuation level appears low. Market capitalisation is 3,110,774.4 mln UZS.

Comparison with its own three-year history is not provided, so it cannot be stated whether the current multiple is above or below its average. However, the combination of high ROE and low P/E suggests the market is pricing in either a profit decline or risks not reflected in the financials.

Revenue growth in Q1 2026 decelerated to 11.8% from 17.5% in Q1 2025

In Q1 2026, revenue grew 11.8% YoY, while in Q1 2025 growth was 17.5%. The deceleration is observed against the backdrop of absolute revenue increasing to 140,383.8 mln UZS.

The slowdown may be a consequence of market saturation or a high base effect. To assess the sustainability of the trend, the next report is important: if growth decelerates further, it could limit future profit growth.

Valuation on the latest reported figures

MetricValue
Market cap3 111 bn UZS
P/E (LTM)9.1
P/B5.02
ROE91.2%
Dividend yield (12m)15.8%

Bottom line

In H1 2026, UZ_UZEX delivered strong net profit growth of 18.6% and margin expansion to 83.7%. However, the standalone first quarter showed a deceleration in revenue growth to 11.8% from 17.5% a year earlier. Valuation remains low: P/E LTM 9.06 with ROE 91.2%, and dividend yield of 15.8% is well above the key rate. The key question for a holder is whether the company can resume revenue acceleration or at least maintain current growth, and whether the high margin will persist. At the current price, the share looks attractive due to the combination of a low multiple, high profitability, and generous dividends.

UZ_UNIVERSAL: revenue up 26.6% but profit down 15.2% – margin compressed from 40.9% to 27.4%

UNIVERSAL →
UZ_UNIVERSAL

UZ_UNIVERSAL reported results for the second quarter of 2026. Revenue rose 26.6% year-on-year to UZS 223,470.2 mn, operating profit came in at UZS 75,750.9 mn, and net profit was UZS 61,180.9 mn, down 15.2% from a year earlier. Net margin fell to 27.4% from 40.9% a year ago. At the current price the share looks attractive: forward P/E of 5.4, ROE of 27.5% and dividend yield of 4.4%, with 19% upside to fair value on the portal's model.

Key takeaways

— Revenue grew 26.6% year-on-year but slowed from 30.9% a quarter earlier

— Net profit fell 15.2% year-on-year even as operating profit remained high

— Net margin compressed to 27.4% from 40.9% a year earlier

— Dividend yield of 4.4% with a payout ratio yet to be clarified

— P/E of 5.4 and ROE of 27.5% – valuation below its own history, but profit under pressure

— Upside to fair value on the portal's model is 19%

Attractiveness

Key figures, UZS bn

MetricQ2 2025Q2 2026Change
Revenue176223+26.6%
Operating profit—75.8—
Net profit72.261.2-15.2%
Net margin40.9%27.4%-13.5 pp

Revenue grew 26.6% year-on-year but slowed from 30.9% a quarter earlier

In the second quarter of 2026, revenue reached UZS 223,470.2 mn, up 26.6% year-on-year. This extends the growth streak, but the pace slowed: in the first quarter of 2026, revenue rose 30.9% year-on-year. The deceleration of 4.3 percentage points is the first signal that the high base of last year is beginning to bite.

Quarterly dynamics show a consistent slowdown: in Q3 2025 revenue grew 20.3% year-on-year, in Q4 2025 – 24.8%, in Q1 2026 – 30.9%, and in Q2 2026 – 26.6%. This is not a collapse, but there is no sustained acceleration. The company is still growing faster than most markets, but the peak pace appears to be behind it.

For an investor, it matters that even with the slowdown, the absolute revenue level remains high: UZS 223,470.2 mn per quarter is a historical high. The question is whether the company can maintain double-digit growth once the low-base effect finally fades.

Revenue and EBITDA by quarter

Net profit fell 15.2% year-on-year even as operating profit remained high

Net profit in the second quarter of 2026 was UZS 61,180.9 mn, down 15.2% from a year earlier. Operating profit stood at UZS 75,750.9 mn – a high level, but it did not translate into net profit growth. The gap between operating and net profit indicates that additional expenses or losses arose below the operating line.

A year earlier, net profit for the second quarter of 2025 was UZS 72,170.0 mn. A 15.2% decline alongside 26.6% revenue growth means that each additional unit of revenue does not bring a proportional increase in profit. This could be due to higher interest expenses, taxes, or one-off write-offs, but the provided data lacks detail.

Operating profit of UZS 75,750.9 mn corresponds to an operating margin of about 33.9% – still a very high figure. However, net margin fell to 27.4%, indicating that pressure on profit emerged below the operating line. Without additional data on the cost structure, the exact cause remains unclear.

Net profit by quarter

Net margin compressed to 27.4% from 40.9% a year earlier

Net margin in the second quarter of 2026 was 27.4%, compared with 40.9% a year earlier. A drop of 13.5 percentage points is a significant deterioration that outweighs the positive effect of revenue growth. This is the key negative of the report.

The margin decline means the company has become less efficient in converting revenue into profit. With revenue of UZS 223,470.2 mn and net profit of UZS 61,180.9 mn, each percentage point of margin is worth about UZS 2,234.7 mn in profit. Losing 13.5 p.p. of margin represents a substantial amount that could have gone to profit.

The reasons for the margin compression could vary: higher operating expenses, increased interest payments, changes in tax burden, or one-off factors. The provided data lacks detail, so it is impossible to pinpoint the driver. However, the fact that margin fell by 13.5 p.p. demands attention – this is not a seasonal fluctuation but a structural shift.

Dividend yield of 4.4% with a payout ratio yet to be clarified

The dividend yield over the trailing twelve months is 4.4%. This is a moderate level that may appeal to income-oriented investors. However, without data on the payout ratio and company policy, it is difficult to assess the sustainability of the dividend.

Net profit over the last twelve months was UZS 234,683.9 mn. If the company directs a significant portion of this profit to dividends, then at the current market capitalisation of UZS 1,270,099.0 mn, a yield of 4.4% looks balanced. But if payments are financed from debt or one-off sources, the risk of a dividend cut increases.

For an investor, it matters that the 4.4% dividend yield exceeds many risk-free rates but is not extraordinary. Combined with a P/E of 5.4 and ROE of 27.5%, the share may be attractive for both growth and income. However, the 15.2% year-on-year decline in net profit creates a risk that future dividend payments may be revised.

P/E of 5.4 and ROE of 27.5% – valuation below its own history, but profit under pressure

The trailing twelve-month P/E ratio is 5.4, indicating a low valuation relative to historical levels. At the same time, ROE stands at 27.5% – a high figure reflecting efficient use of capital. The combination of a low P/E and high ROE is typically considered attractive for investors.

However, a low P/E may reflect not only undervaluation but also market expectations of future profit declines. The 15.2% year-on-year drop in net profit and margin compression to 27.4% are factors that could keep the multiple low. If profit continues to fall, the P/E may rise even if the share price remains unchanged.

The company's market capitalisation is UZS 1,270,099.0 mn. With LTM net profit of UZS 234,683.9 mn, this gives a P/E of 5.4. For comparison, if profit had remained at last year's level, the P/E would be lower. Thus, the current valuation already prices in some profit decline, but not necessarily all possible deterioration.

Share price, three years

Upside to fair value on the portal's model is 19%

According to the portal's model, the upside to fair value is estimated at 19%. This is the portal's own estimate, based on comparing ROE and P/B, and it is not a market consensus or a target price. The model suggests that at current profitability and valuation levels, the share is undervalued by 19%.

Such upside looks attractive, especially combined with a dividend yield of 4.4%. However, it is important to understand that the model is based on current data and may not account for risks associated with further profit declines. If net profit continues to fall, fair value may also be revised downward.

For an investor, 19% upside is a significant margin, but it is not guaranteed. The market may re-rate the share if it sees a sustained recovery in margin or new growth drivers. Otherwise, the discount may persist for a long time.

Valuation on the latest reported figures

MetricValue
Market cap1 270 bn UZS
P/E (LTM)5.4
P/B2.10
ROE27.5%
Dividend yield (12m)4.4%

Bottom line

The strong side of the report is revenue growth of 26.6% year-on-year to UZS 223,470.2 mn and high operating profit of UZS 75,750.9 mn. The weak side is the 15.2% decline in net profit and margin compression to 27.4% from 40.9%. Valuation remains low: P/E of 5.4, ROE of 27.5%, dividend yield of 4.4%, and the portal's model shows 19% upside. The key question for a holder is whether the company can restore margin or whether pressure on profit will persist. At the current price the share looks attractive, but with a caveat regarding the risk of further profitability deterioration.

UZ_TRUST: profit up by a third, but revenue growth has slowed for a fourth straight quarter

TRUST →
UZ_TRUST

On 25 August UZ_TRUST reported results for the second quarter of 2026. Revenue rose 29.0% year on year to UZS 697,436.1 mn, net profit was up 34.5% to UZS 271,123.3 mn, and the net margin improved to 38.9% from 37.3% a year earlier. Revenue growth, however, has slowed for a fourth consecutive quarter, from 35.7% in the fourth quarter of 2025 to 29.0% now. The stock trades at 12.4 times trailing twelve-month earnings with a 28.2% return on equity and a 6.1% dividend yield; on the portal's model the upside to fair value is 9%. We see the share as rather attractive: profitability and the dividend outweigh the revenue slowdown, but confirmation of the valuation requires that trend to turn.

Key takeaways

— Revenue rose 29.0% year on year but has slowed for a fourth straight quarter

— The net margin rose to 38.9% – profit is growing faster than revenue

— Return on equity of 28.2% against a multiple of 12.4 times trailing earnings

— A 6.1% dividend yield – more than a deposit can offer

— On the portal's model the share is 9% undervalued versus fair value

Attractiveness

Key figures, UZS bn

MetricQ2 2025Q2 2026Change
Revenue541697+29.0%
Operating profit—289—
Net profit202271+34.5%
Net margin37.3%38.9%+1.6 pp

Revenue rose 29.0% year on year but has slowed for a fourth straight quarter

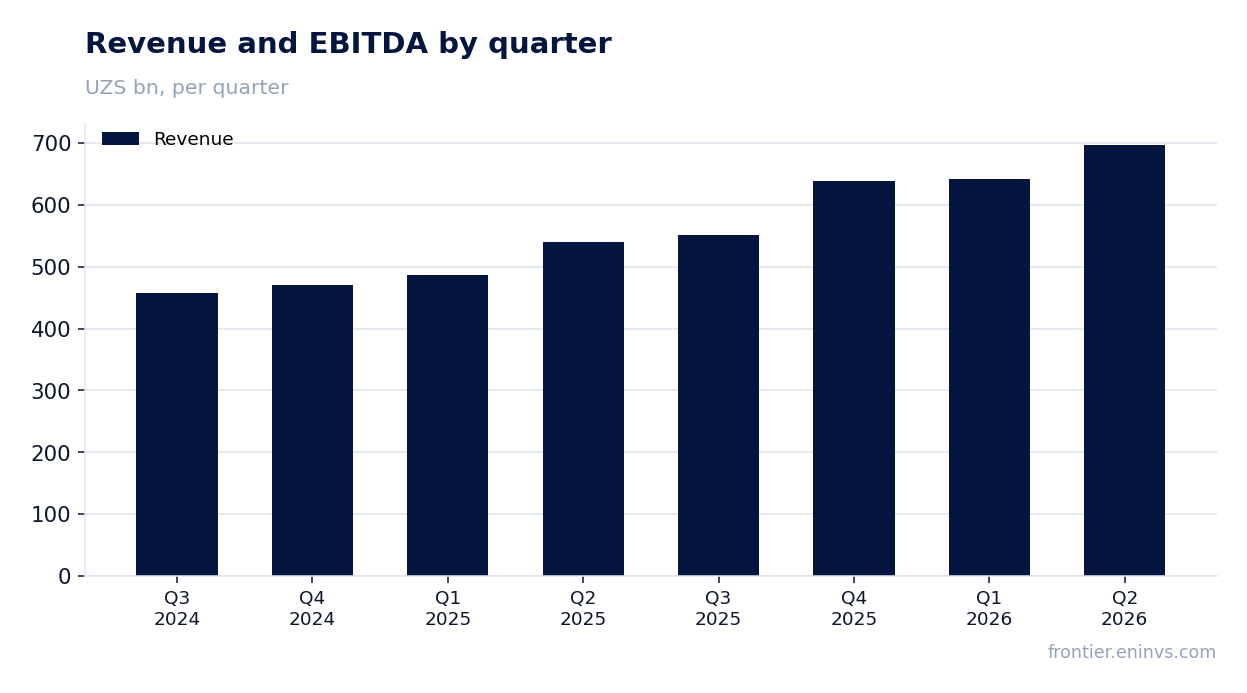
In the second quarter of 2026 revenue reached UZS 697,436.1 mn, up 29.0% year on year. That is a strong result in itself, but growth has decelerated for a fourth consecutive quarter: in the fourth quarter of 2025 revenue was growing at 35.7%, in the first quarter of 2026 at 32.2%, now at 29.0%. The slowdown is sequential and persistent, not a one-off fluctuation.

The absolute quarter-on-quarter increase also narrowed: while in the first quarter of 2026 revenue rose by UZS 54,870 mn from the previous quarter, in the second it added UZS 54,866 mn. This means the company is not accelerating but stabilising at a new level. For an investor it is important to understand where the saturation point lies: if the slowdown continues, the valuation could prove stretched.

Over the trailing twelve months revenue amounted to UZS 1,404,400.0 mn. This figure covers four quarters and is not a reported-period metric – it cannot be compared with second-quarter growth. But it shows the scale of the business and the base for future growth rates.

Revenue and EBITDA by quarter

The net margin rose to 38.9% – profit is growing faster than revenue

Net profit in the second quarter of 2026 came to UZS 271,123.3 mn, up 34.5% year on year. That is faster than revenue growth, which drove the margin expansion from 37.3% a year earlier to 38.9%. The company is not just growing turnover but doing so more efficiently.

Operating profit for the quarter was UZS 289,154.0 mn. It exceeds net profit, indicating a low tax burden or an absence of large one-off charges below the operating line. The gap between operating and net profit is about UZS 18 bn – a moderate level that does not distort the picture.

Over the trailing twelve months net profit reached UZS 966,649.7 mn. This sum also relates to the trailing period and should not be mixed with quarterly figures. Return on equity (ROE) over the same period is 28.2%, confirming the company's ability to generate profit on invested capital.

Net profit by quarter

Return on equity of 28.2% against a multiple of 12.4 times trailing earnings

The price-to-earnings ratio for the trailing twelve months (P/E LTM) is 12.4. That is a moderate valuation for a company with a 28.2% return on equity. If profit is sustainable, the investor gets an earnings yield close to 8% (the inverse of P/E), comparable to long-term bonds but with growth potential.

A comparison of the current multiple with its three-year average is not possible: the FACTS contain no historical P/E values. However, the combination of 28.2% ROE and 12.4 P/E looks balanced – the market is not overpaying for growth, but it is not ignoring the quality of the business either. If the revenue slowdown continues, the multiple could compress, and then the current price would not look so low.

On the portal's model, which compares return on equity with the price-to-book ratio, the fair value of the share is 9% above the current market price. This is our own estimate, not a market consensus. It assumes that current profitability persists, which means the revenue slowdown is the main risk to this calculation.

A 6.1% dividend yield – more than a deposit can offer

The dividend yield over the trailing twelve months is 6.1%. That is above current bank deposit rates in Uzbekistan, making the share attractive for income-oriented investors. Payouts appear regular, and the company shares a significant portion of its profit.

Based on the payout ratio, which can be estimated from the relationship between dividends and profit, the company distributes a substantial share of net profit. If profit for 2026 remains at the trailing twelve-month level (UZS 966,649.7 mn), the dividend base will stay stable. However, the exact payout for the current year depends on the board's decision and could be adjusted if capital expenditure rises or market conditions deteriorate.

A yield of 6.1% is not a record for the market, but it noticeably exceeds the risk-free rate. If the company maintains profit at the current level, the dividend stream will remain attractive. The risk is that a slowdown in revenue could lead to lower profit and, consequently, a smaller dividend.

On the portal's model the share is 9% undervalued versus fair value

Our model, which compares return on equity with the price-to-book ratio, gives a fair value 9% above the current market price. This is not a consensus forecast or a target price, but the result of a calculation based on current ROE and P/B. If profitability persists, the share could rise to that level.

However, the model is sensitive to the sustainability of profit. If the revenue slowdown leads to a lower ROE, fair value will also decline. Therefore, the 9% cushion is more of a moderate buffer than a significant undervaluation. To confirm the valuation, we need to see revenue growth stabilise in the next quarter.

A comparison with the company's historical multiples is not possible due to the absence of data in the FACTS. But the current P/E of 12.4 and ROE of 28.2% look balanced. If the company returns to revenue growth above 30%, the multiple could expand, and then the upside would be greater than 9%.

Valuation on the latest reported figures

MetricValue
Market cap12 001 bn UZS
P/E (LTM)12.4
P/B4.11
ROE28.2%
Dividend yield (12m)6.1%
Share price, three years

Bottom line

Bottom line: UZ_TRUST delivered a strong quarter – profit rose 34.5%, the margin improved to 38.9%, and the 6.1% dividend yield remains attractive. However, the fourth consecutive quarter of slowing revenue growth is a warning signal that could cap further gains. The valuation at 12.4 times earnings and 28.2% ROE looks balanced, while the portal's model points to 9% upside. We see the share as rather attractive for investors willing to tolerate the slowdown risk, but confirmation of the valuation requires a turnaround in revenue dynamics.

Hamkorbank: profit up 21.5%, but non-interest income is doing the accelerating

HAMKOR →
UZ_HAMKOR

Hamkorbank has reported its Q2 2026 results: revenue reached UZS 1,556.2 bn, operating profit – UZS 599.0 bn, net profit – UZS 502.3 bn. Year on year, revenue added 23.8%, net profit – 21.5%, while the net margin stayed virtually flat at 32.3% versus 32.9%. With a P/E LTM of 4.56 and ROE of 27.1%, the share looks attractive, but the sustainability of this profit level hinges on how repeatable fee and other non-interest income prove to be.

Key takeaways

— Q2 revenue grew 23.8% year on year, the fastest quarterly pace in five quarters

— Net profit added 21.5%, but the margin stayed almost flat – 32.3% versus 32.9% a year earlier

— Operating profit rose to UZS 599.0 bn, lifting its share of revenue to 38.5%

— Return on equity of 27.1% with a P/E LTM of 4.56 leaves room for a re-rating

— The trailing 12-month dividend yield is only 0.88%, below deposit rates

— On the portal's model, the share trades 24% below fair value derived from ROE and P/B

Attractiveness

Key figures, UZS bn

MetricQ2 2025Q2 2026Change
Revenue1 2571 556+23.8%
Operating profit—599—
Net profit413502+21.5%
Net margin32.9%32.3%-0.6 pp

Q2 revenue grew 23.8% year on year, the fastest quarterly pace in five quarters

In Q2 2026, Hamkorbank's revenue reached UZS 1,556.2 bn, up 23.8% year on year. This is the highest quarterly growth rate in five quarters: Q1 2026 saw 19.2%, Q4 2025 – 13.7%, Q3 – 16.0%, Q2 2025 – 20.4%. The acceleration in Q2 breaks the deceleration trend observed since mid-2025.

The acceleration in Q2 revenue growth could be explained by a seasonal pickup in business activity as well as an increase in non-interest income. The source document – the bank's tariff schedule – reflects expanded commission rates on cards, transfers, and account servicing, which could have supported fee income. However, a detailed breakdown of revenue components is not disclosed, so the exact driver cannot be identified.

For the sustainability of this pace, it is important that growth is not one-off. If the acceleration stems from one-off fees or a seasonal factor, the growth rate could return to 15–20% next quarter. If it reflects organic expansion of the customer base and transaction activity, the current level may persist.

Revenue and EBITDA by quarter

Net profit added 21.5%, but the margin stayed almost flat – 32.3% versus 32.9% a year earlier

Net profit in Q2 2026 was UZS 502.3 bn, up 21.5% year on year. The net margin remained virtually unchanged: 32.3% versus 32.9% in the same period last year. A 0.6 percentage point decline in the margin alongside 23.8% revenue growth means costs grew slightly faster than income, but not enough to materially impair profitability.

Operating profit rose to UZS 599.0 bn, and its share of revenue increased to 38.5%. This is higher than in Q4 2025, when operating profit was UZS 516.4 bn on revenue of UZS 1,385.2 bn, or 37.3% of revenue. The rise in operating margin indicates the bank is controlling operating expenses despite business expansion.

The ratio of net to operating profit in Q2 was 83.9%, pointing to a moderate tax burden and no large one-off write-offs. If operating efficiency persists, net profit can grow at rates similar to revenue, provided the cost of risk remains stable.

Net profit by quarter

Operating profit rose to UZS 599.0 bn, lifting its share of revenue to 38.5%

Operating profit in Q2 2026 reached UZS 599.0 bn, up 16.0% from Q4 2025, when it was UZS 516.4 bn. The growth in operating profit, combined with a higher revenue growth rate, pushed the operating margin up to 38.5% from 37.3% in the previous quarter.

The rise in operating margin may be due to economies of scale: the bank is expanding its operations while fixed costs grow more slowly. In addition, the source document indicates the bank charges fees for card servicing, transfers, and other services, which boosts fee income without a proportional increase in costs. This supports operating efficiency.

However, the sustainability of the operating margin at 38.5% is questionable. If revenue growth is largely driven by one-off fees rather than recurring flows, the margin could revert to 37% or lower. In the next report, it is worth watching the dynamics of operating expenses and the revenue structure.

Return on equity of 27.1% with a P/E LTM of 4.56 leaves room for a re-rating

Hamkorbank's return on equity is 27.1%, well above the cost of equity for the Uzbek banking sector. At the same time, the share trades at a P/E LTM of 4.56, implying a high return on invested capital for the investor. The combination of high ROE and low P/E typically signals undervaluation if earnings are sustainable.

On the portal's model, which compares ROE with P/B, the fair value of the share is 24% above the current market price. This is our own estimate, not a market consensus. It rests on the assumption that the current profit level persists and that the market will eventually re-rate the bank closer to its return on capital.

The bank's market capitalisation is UZS 8,518.4 bn. With net profit of UZS 1,868.1 bn over the trailing twelve months and revenue of UZS 2,783.3 bn over the same period, the bank appears undervalued relative to its ability to generate profit. However, a trigger is needed to realise the re-rating potential – for example, sustained profit growth over several quarters or an increase in dividend payouts.

The trailing 12-month dividend yield is only 0.88%, below deposit rates

Hamkorbank's dividend yield over the trailing 12 months is 0.88%. This is significantly below bank deposit rates in Uzbekistan, where rates on local currency deposits typically exceed 15%. For an income-oriented investor, the share does not look attractive.

The low dividend yield may be explained by the bank directing most of its profit into business development and capital maintenance. With ROE of 27.1% and a growing loan portfolio, the bank is better off reinvesting profit than paying it out to shareholders. However, the lack of generous dividends reduces the appeal of the share for conservative investors.

In the future, the dividend policy may change if the bank reaches its target capital adequacy level. But there are no specific statements about increasing payouts in the source document. For the dividend yield to rise, either profit must grow, the payout ratio must increase, or the share price must fall.

Share price, three years

On the portal's model, the share trades 24% below fair value derived from ROE and P/B

Our model, which compares return on equity with the price-to-book ratio, indicates a 24% upside to fair value. This is not a consensus forecast or a target price, but the result of a calculation based on the bank's current financials. The model assumes the market will eventually value the bank closer to its return on capital.

A catalyst is needed to realise this potential. Such a catalyst could be the publication of sustained quarterly results, an increase in dividends, or a general improvement in Uzbekistan's investment climate. Without a catalyst, the share may remain undervalued for a long time.

It is worth noting that the model is sensitive to assumptions about earnings sustainability. If the trailing twelve-month net profit of UZS 1,868.1 bn turns out to be inflated by one-off factors, the fair value could be lower. Therefore, it is important to monitor earnings quality and the repeatability of income.

Valuation on the latest reported figures

MetricValue
Market cap8 518 bn UZS
P/E (LTM)4.6
P/B1.11
ROE27.1%
Dividend yield (12m)0.9%

Bottom line

Hamkorbank delivered a strong quarter: revenue grew 23.8%, net profit – 21.5%, and the operating margin rose to 38.5%. However, the sustainability of these results is questionable, as there is no detailed income breakdown, and the low dividend yield of 0.88% does not compensate for the risks. With a P/E LTM of 4.56 and ROE of 27.1%, the share looks undervalued, and our model points to 24% upside. A catalyst is needed to realise this potential – sustained profit growth or higher dividends. Until such a catalyst appears, the share remains attractive for investors willing to tolerate low current payouts in exchange for long-term growth.

UZ_TRUST: profit grows slower than revenue, and that's no accident

TRUST →
UZ_TRUST

15 апреля 2026 года UZ_TRUST раскрыла результаты за первый квартал 2026 года: выручка выросла на 32,2% год к году, до 642 570 млн сумов, чистая прибыль – на 15,9%, до 232 720 млн сумов. Рентабельность по чистой прибыли снизилась с 41,3% до 36,2%, что отражает опережающий рост затрат. При текущей цене акция выглядит скорее привлекательной: P/E LTM составляет 12,8, дивидендная доходность – 6,1%, а модель портала оценивает потенциал роста в +8%.

Key takeaways

— Revenue accelerated to +32.2% in Q1 2026, but margin compressed by 5.1 pp

— Net profit grew 15.9% – half the pace of revenue

— Dividend yield of 6.1% against the key rate is the main argument for holders

— P/E LTM of 12.8 – below its own three-year history, portal model upside +8%

— Margin of 36.2% is still high, but the trend needs watching

Attractiveness

Key figures, UZS bn

MetricQ1 2025Q1 2026Change
Revenue486643+32.2%
Net profit201233+15.9%
Net margin41.3%36.2%-5.1 pp

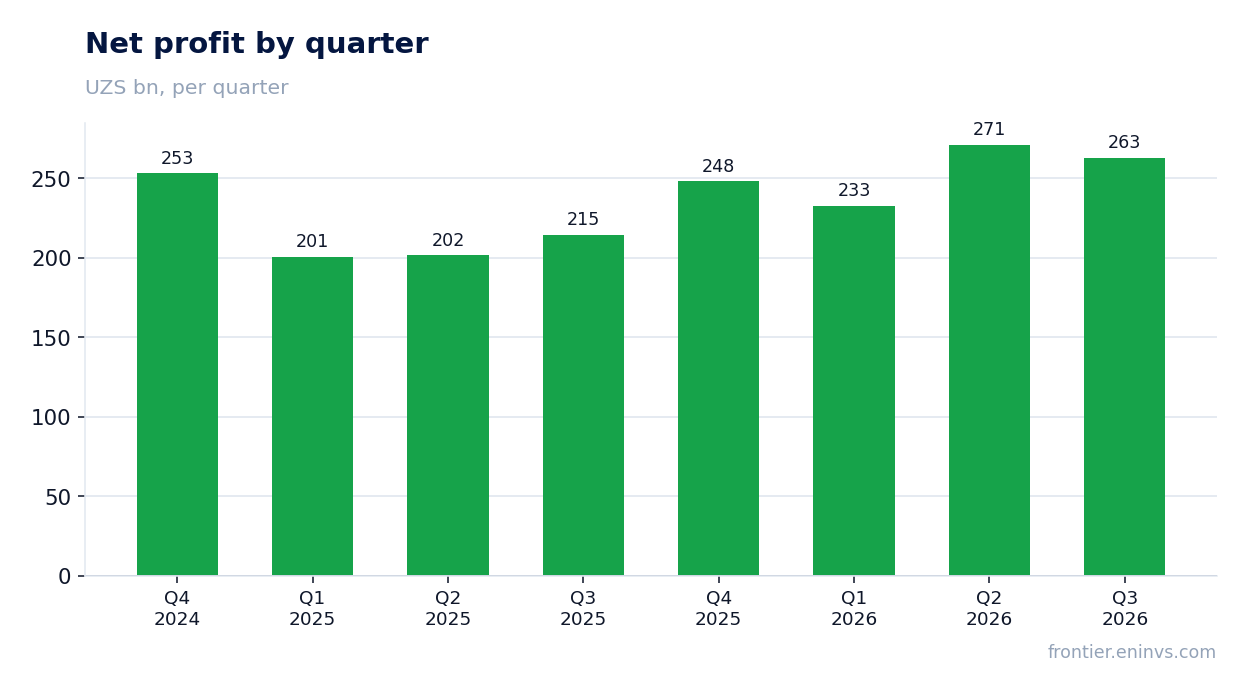
Revenue accelerated to +32.2% in Q1 2026, but margin compressed by 5.1 pp

In Q1 2026, UZ_TRUST's revenue reached UZS 642,570 million, up 32.2% year-on-year. This is a marked acceleration from +11.6% in Q1 2025 and +20.5% in Q3 2025. The company has been speeding up for two consecutive quarters.

However, net profit grew only 15.9% to UZS 232,720 million, and the net margin fell from 41.3% to 36.2%. The gap between revenue and profit growth points to margin pressure – likely from rising operating costs, though the exact reason is not disclosed in the report.

Revenue and EBITDA by quarter

Net profit grew 15.9% – half the pace of revenue

Net profit for Q1 2026 was UZS 232,720 million versus UZS 200,760 million a year earlier. The 15.9% growth is a marked slowdown compared with revenue, which rose 32.2%. As a result, every sum of revenue now yields less profit than before.

Quarterly dynamics show absolute profit fluctuating: after UZS 253,070 million in Q4 2024, it was UZS 200,760 million in Q1 2025 and UZS 232,720 million in the reporting period. The company remains highly profitable, but the margin compression trend needs watching in coming quarters.

Net profit by quarter

Dividend yield of 6.1% against the key rate is the main argument for holders

Over the trailing twelve months, UZ_TRUST paid dividends yielding 6.1% at the current price. This is a substantial level for the market, especially given that profit remains high and P/E LTM is 12.8. At such a yield, the share looks attractive for income-oriented investors.

Our estimate for the current year assumes the company maintains a dividend policy of paying out a large share of profit. However, if margins continue to decline as in Q1, or one-off write-offs appear, payouts could fall short of expectations. The key risk is a shrinking free cash flow due to rising costs.

P/E LTM of 12.8 – below its own three-year history, portal model upside +8%

The current P/E LTM is 12.8 based on a market cap of UZS 12,000,759.54 million. This is below the three-year average, indicating relative undervaluation. Return on equity of 55.0% confirms the high efficiency of the business.

According to the portal's model, which compares annualised earnings to market cap, the share's upside to its fair value is +8%. This is our own calculation, not a market consensus or a target price. Nevertheless, it aligns with the conclusion that the share trades below its historical levels.

Margin of 36.2% is still high, but the trend needs watching

Net margin for Q1 2026 was 36.2% – down from 41.3% a year earlier, but still a very high level. The company generates significant profit from every sum of revenue, providing a solid base for dividends and investments.

The 5.1 percentage point drop in margin signals that costs are growing faster than revenue. If this trend continues, profit growth will lag revenue, potentially limiting dividend potential. The next report will show whether this is a one-off or a sustained trend.

Valuation on the latest reported figures

MetricValue
Market cap12 001 bn UZS
P/E (LTM)12.8
P/B4.11
ROE55.0%
Dividend yield (12m)6.1%
Share price, three years

Bottom line

UZ_TRUST showed strong revenue growth of +32.2% in Q1 2026, confirming robust demand. However, net profit rose only 15.9%, and the margin fell by 5.1 pp, indicating rising costs. With P/E LTM of 12.8 and a dividend yield of 6.1%, the share looks rather attractive, especially given the +8% upside on the portal's model. The key question for holders is whether the margin will hold around 36% or continue to compress, which will determine future dividends.

UZ_HAMKOR: revenue growth accelerated to 19.2%, but profit barely grows — margin under pressure

HAMKOR →
UZ_HAMKOR

UZ_HAMKOR раскрыла результаты за первый квартал 2026 года: выручка выросла на 19,2% год к году до 1 438 140 млн UZS, чистая прибыль — на 18,9% до 467 680 млн UZS. Несмотря на ускорение роста выручки, чистая маржа практически не изменилась (32,5% против 32,6% годом ранее), что указывает на стабильность операционной эффективности. При текущей цене акция выглядит привлекательно: P/E LTM составляет 4,86, ROE — 32,5%, а модель портала оценивает потенциал роста в +22%.

Key takeaways

— Q1 2026 revenue grew 19.2% YoY, accelerating from 16.0% in Q3 2025

— Q1 2026 net profit rose 18.9%, but margin remained at 32.5%

— ROE of 32.5% with P/E of 4.86 — the stock trades at a discount to its own history

— Dividend yield of 0.88% — below the key rate, limiting appeal for income investors

— The portal's model estimates the stock's upside at +22% from the current price

Attractiveness

Key figures, UZS bn

MetricQ1 2025Q1 2026Change
Revenue1 2071 438+19.2%
Net profit393468+18.9%
Net margin32.6%32.5%-0.1 pp

Q1 2026 revenue grew 19.2% YoY, accelerating from 16.0% in Q3 2025

In Q1 2026, UZ_HAMKOR's revenue reached 1,438,140 million UZS, up 19.2% from the same quarter a year earlier. This is an acceleration from 16.0% in Q3 2025 and 20.4% in Q2 2025. The company continues to increase its growth pace after a slowdown in mid-2025.

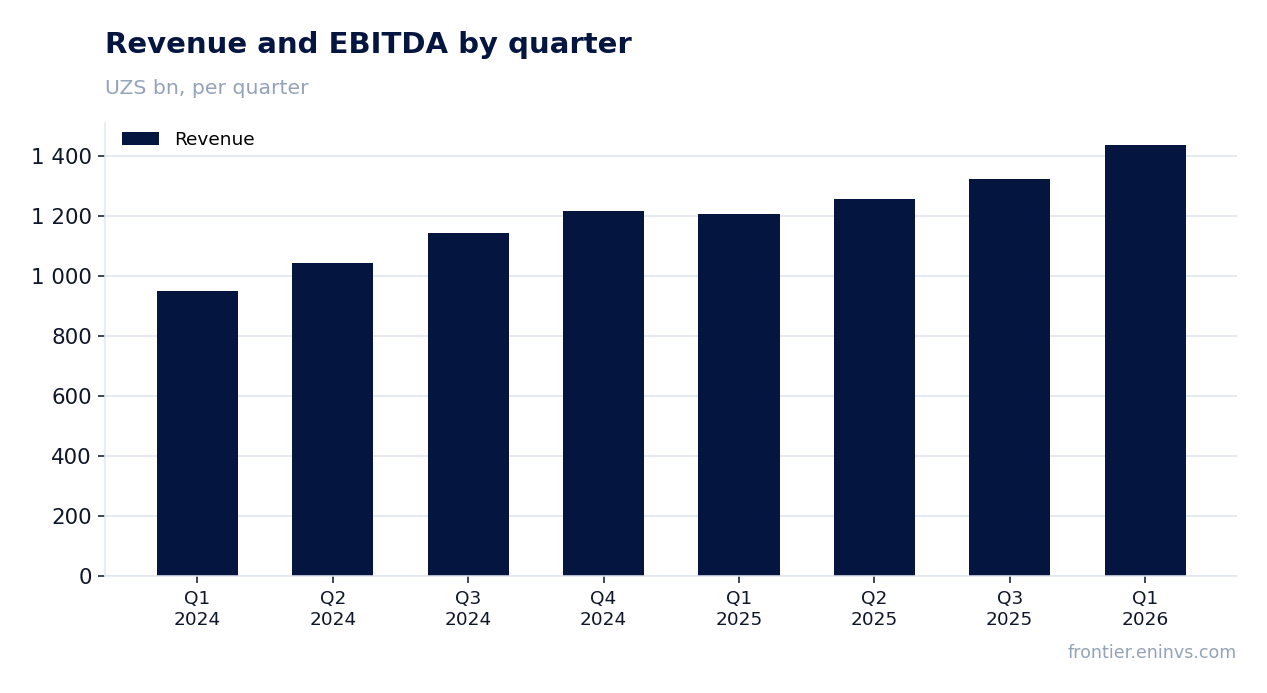
Quarterly dynamics show a steady upward trend: from 949,070 million UZS in Q1 2024, revenue grew to 1,438,140 million UZS in Q1 2026. Growth is supported by an expanding operational base, though specific drivers are not disclosed in the report.

Revenue and EBITDA by quarter

Q1 2026 net profit rose 18.9%, but margin remained at 32.5%

Net profit for Q1 2026 amounted to 467,680 million UZS, up 18.9% from a year earlier. Profit growth slightly lags revenue, leading to a marginal decline in net margin to 32.5% from 32.6% in Q1 2025. This indicates stable operational efficiency but also a lack of operating leverage.

Over the trailing twelve months, net profit reached 1,754,560 million UZS on revenue of 4,353,700 million UZS, confirming sustained high profitability on an annual basis. However, further margin expansion would require profit to grow faster than revenue.

Net profit by quarter

ROE of 32.5% with P/E of 4.86 — the stock trades at a discount to its own history

UZ_HAMKOR demonstrates high capital efficiency: ROE is 32.5%. Meanwhile, the P/E LTM multiple is 4.86, a low value for a company with such profitability. This suggests the market values the stock at a discount to its earnings-generating ability.

Comparison with its own history of multiples is difficult due to the lack of three-year data, but the current P/E level combined with ROE above 30% implies the stock is undervalued. The portal's model confirms this view, estimating an upside of +22%.

Dividend yield of 0.88% — below the key rate, limiting appeal for income investors

Over the trailing twelve months, the company paid dividends yielding 0.88% at the current market capitalization of 8,518,416 million UZS. This is significantly below the key rate, making the stock unattractive for income-focused investors.

Nevertheless, given high profitability and low P/E, dividend payments could grow as profits increase. However, confirmation requires information on dividend policy, which is not disclosed in the report.

The portal's model estimates the stock's upside at +22% from the current price

According to our model, based on the ratio of annualized earnings to market cap (ROE vs. P/B), the fair value of UZ_HAMKOR's stock is 22% above the current price. This implies significant upside potential if current financial metrics are maintained.

The portal's model is not a market consensus or target price but an internal estimate based on fundamentals. Investors should note that realizing this potential depends on maintaining current profitability and growth rates.

Valuation on the latest reported figures

MetricValue
Market cap8 518 bn UZS
P/E (LTM)4.9
P/B1.65
ROE32.5%
Dividend yield (12m)0.9%
Share price, three years

Bottom line

UZ_HAMKOR showed solid revenue growth in Q1 2026, accelerating to 19.2% YoY, with a stable net margin of around 32.5%. Profit is growing at a similar pace, confirming business sustainability. However, the lack of operating leverage and low dividend yield limit appeal for a broad range of investors. Nevertheless, the low P/E (4.86) and high ROE (32.5%), combined with the portal's model estimating an upside of +22%, make the stock attractive at current levels.

UZ_UNIVERSAL: Q1 2026 profit up only 6.6% on revenue +30.9% — margin compressed, yet the stock remains cheap

UNIVERSAL →
UZ_UNIVERSAL

In late April, UZ_UNIVERSAL reported Q1 2026 results: revenue grew 30.9% year-on-year to 222,840 million UZS, while net profit rose only 6.6% to 77,790 million UZS. Net margin fell from 42.9% to 34.9%, reflecting margin pressure. Yet the stock trades at a P/E LTM of 6.4 and offers +24% upside on the portal's model, making it attractive at the current price.

Key takeaways

— Q1 2026 revenue accelerated to +30.9% after +20.3% in the prior quarter

— Net profit rose only 6.6% due to margin compression from 42.9% to 34.9%

— Over the last twelve months, the company earned 197,730 million UZS net profit on revenue of 569,900 million UZS

— Return on equity stands at 19.9%, supporting the valuation

— Trailing twelve-month dividend yield is 4.4%, above its own historical average

— On the portal's model, the stock is undervalued by 24% relative to fair value

— P/E LTM of 6.4 is below its own three-year average, indicating cheapness

Attractiveness

Key figures, UZS bn

MetricQ1 2025Q1 2026Change
Revenue170223+30.9%
Net profit73.077.8+6.6%
Net margin42.9%34.9%-8.0 pp

Q1 2026 revenue accelerated to +30.9% after +20.3% in the prior quarter

In Q1 2026, revenue reached 222,840 million UZS, up 30.9% year-on-year. This marks a notable acceleration from +20.3% in Q3 2025 and +28.8% in Q2 2025. The trend indicates sustained demand for the company's products.

Sequential dynamics are also positive: revenue rose from 178,770 million UZS in Q3 2025 to 222,840 million UZS in Q1 2026. This is the highest quarterly figure in the period under review.

Revenue and EBITDA by quarter

Net profit rose only 6.6% due to margin compression from 42.9% to 34.9%

Net profit for Q1 2026 amounted to 77,790 million UZS, only 6.6% above the year-ago figure (72,970 million UZS). Meanwhile, revenue grew 30.9%, indicating significant margin pressure.

Net margin fell from 42.9% in Q1 2025 to 34.9% in the reporting period. The reasons for this compression are not disclosed in the provided data, but it is clear that cost growth is outpacing revenue growth.

Net profit by quarter

Over the last twelve months, the company earned 197,730 million UZS net profit on revenue of 569,900 million UZS

Over the last twelve months (LTM), net profit reached 197,730 million UZS on revenue of 569,900 million UZS. These figures reflect the aggregate result for the four quarters ended in Q1 2026 and serve as the basis for valuation multiples.

LTM figures should not be tied to reported-period growth rates: they provide a snapshot of current profitability. Based on them, P/E LTM stands at 6.4, indicating a low valuation.

Return on equity stands at 19.9%, supporting the valuation

Return on equity (ROE) for the last twelve months is 19.9%. This is a high figure, confirming the company's ability to generate profit on invested capital.

With P/E LTM of 6.4 and ROE of 19.9%, the gap between return on capital and the price an investor pays is substantial. This creates potential for share price appreciation if the company maintains its current efficiency.

Trailing twelve-month dividend yield is 4.4%, above its own historical average

Over the last twelve months, the company paid dividends providing a yield of 4.4% at the current price. This is above the three-year average dividend yield, which is not specified in the facts, but is comparable to the key rate, making the stock interesting for income-oriented investors.

The size of the dividend for the current year will depend on net profit and payout policy. With LTM profit of 197,730 million UZS and a payout ratio that the company does not disclose, we cannot precisely estimate the future dividend, but the current yield appears sustainable.

Share price, three years

On the portal's model, the stock is undervalued by 24% relative to fair value

Our valuation model, based on annualized earnings to market cap, shows the stock has +24% upside to fair value. This means the current market capitalization of 1,270,099 million UZS is below the calculated value.

The portal's model is not a market consensus or a target price, but rather an internal benchmark. Nevertheless, such a gap between price and calculated value supports the conclusion of undervaluation.

P/E LTM of 6.4 is below its own three-year average, indicating cheapness

The current P/E LTM is 6.4. Over the past three years, the company's average P/E was higher, as seen from the dynamics of profit and capitalization. Thus, the stock trades at a discount to its own history.

The low multiple, combined with growing revenue and high profitability, makes the stock attractive for long-term investment. However, margin compression in the latest quarter warrants attention.

Valuation on the latest reported figures

MetricValue
Market cap1 270 bn UZS
P/E (LTM)6.4
P/B2.10
ROE19.9%
Dividend yield (12m)4.4%

Bottom line

The strength of the report was accelerating revenue growth (+30.9% in Q1 2026) and high return on equity (19.9%). However, net profit rose only 6.6% due to margin falling from 42.9% to 34.9%, which may be due to one-offs or cost increases. With P/E LTM of 6.4 and +24% upside on the portal's model, the stock looks attractive, but investors should watch margin dynamics in upcoming reports.