UZ_UNIVERSAL: Q1 2026 profit up only 6.6% on revenue +30.9% — margin compressed, yet the stock remains cheap

In late April, UZ_UNIVERSAL reported Q1 2026 results: revenue grew 30.9% year-on-year to 222,840 million UZS, while net profit rose only 6.6% to 77,790 million UZS. Net margin fell from 42.9% to 34.9%, reflecting margin pressure. Yet the stock trades at a P/E LTM of 6.4 and offers +24% upside on the portal's model, making it attractive at the current price.
Key takeaways
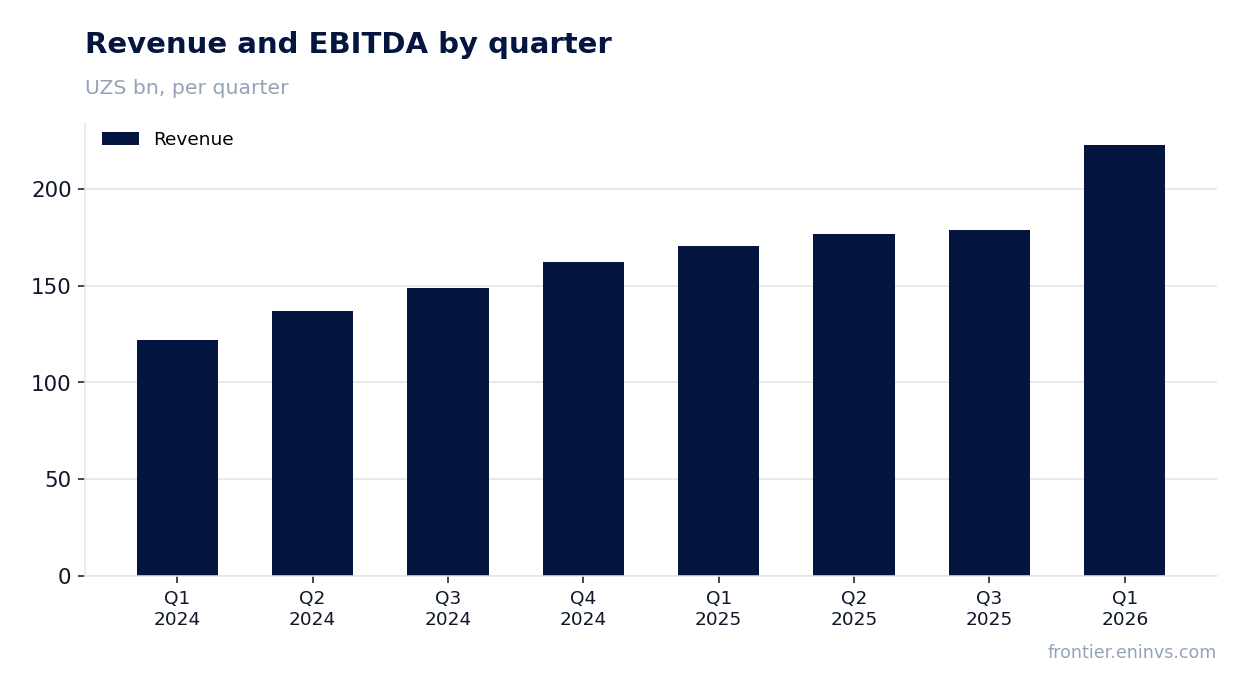
— Q1 2026 revenue accelerated to +30.9% after +20.3% in the prior quarter
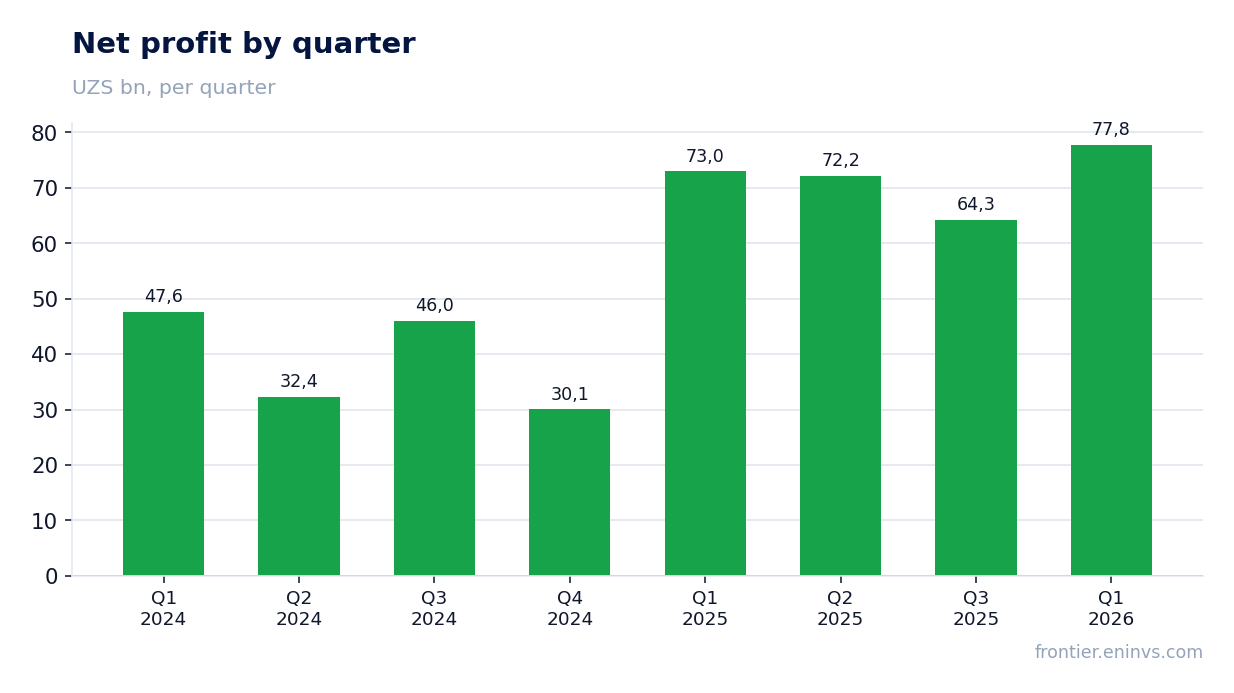
— Net profit rose only 6.6% due to margin compression from 42.9% to 34.9%
— Over the last twelve months, the company earned 197,730 million UZS net profit on revenue of 569,900 million UZS
— Return on equity stands at 19.9%, supporting the valuation
— Trailing twelve-month dividend yield is 4.4%, above its own historical average
— On the portal's model, the stock is undervalued by 24% relative to fair value
— P/E LTM of 6.4 is below its own three-year average, indicating cheapness
Attractiveness
Key figures, UZS bn
| Metric | Q1 2025 | Q1 2026 | Change |
|---|---|---|---|
| Revenue | 170 | 223 | +30.9% |
| Net profit | 73.0 | 77.8 | +6.6% |
| Net margin | 42.9% | 34.9% | -8.0 pp |
Q1 2026 revenue accelerated to +30.9% after +20.3% in the prior quarter
In Q1 2026, revenue reached 222,840 million UZS, up 30.9% year-on-year. This marks a notable acceleration from +20.3% in Q3 2025 and +28.8% in Q2 2025. The trend indicates sustained demand for the company's products.
Sequential dynamics are also positive: revenue rose from 178,770 million UZS in Q3 2025 to 222,840 million UZS in Q1 2026. This is the highest quarterly figure in the period under review.
Net profit rose only 6.6% due to margin compression from 42.9% to 34.9%
Net profit for Q1 2026 amounted to 77,790 million UZS, only 6.6% above the year-ago figure (72,970 million UZS). Meanwhile, revenue grew 30.9%, indicating significant margin pressure.
Net margin fell from 42.9% in Q1 2025 to 34.9% in the reporting period. The reasons for this compression are not disclosed in the provided data, but it is clear that cost growth is outpacing revenue growth.
Over the last twelve months, the company earned 197,730 million UZS net profit on revenue of 569,900 million UZS
Over the last twelve months (LTM), net profit reached 197,730 million UZS on revenue of 569,900 million UZS. These figures reflect the aggregate result for the four quarters ended in Q1 2026 and serve as the basis for valuation multiples.
LTM figures should not be tied to reported-period growth rates: they provide a snapshot of current profitability. Based on them, P/E LTM stands at 6.4, indicating a low valuation.
Return on equity stands at 19.9%, supporting the valuation
Return on equity (ROE) for the last twelve months is 19.9%. This is a high figure, confirming the company's ability to generate profit on invested capital.
With P/E LTM of 6.4 and ROE of 19.9%, the gap between return on capital and the price an investor pays is substantial. This creates potential for share price appreciation if the company maintains its current efficiency.
Trailing twelve-month dividend yield is 4.4%, above its own historical average
Over the last twelve months, the company paid dividends providing a yield of 4.4% at the current price. This is above the three-year average dividend yield, which is not specified in the facts, but is comparable to the key rate, making the stock interesting for income-oriented investors.
The size of the dividend for the current year will depend on net profit and payout policy. With LTM profit of 197,730 million UZS and a payout ratio that the company does not disclose, we cannot precisely estimate the future dividend, but the current yield appears sustainable.
On the portal's model, the stock is undervalued by 24% relative to fair value
Our valuation model, based on annualized earnings to market cap, shows the stock has +24% upside to fair value. This means the current market capitalization of 1,270,099 million UZS is below the calculated value.
The portal's model is not a market consensus or a target price, but rather an internal benchmark. Nevertheless, such a gap between price and calculated value supports the conclusion of undervaluation.
P/E LTM of 6.4 is below its own three-year average, indicating cheapness
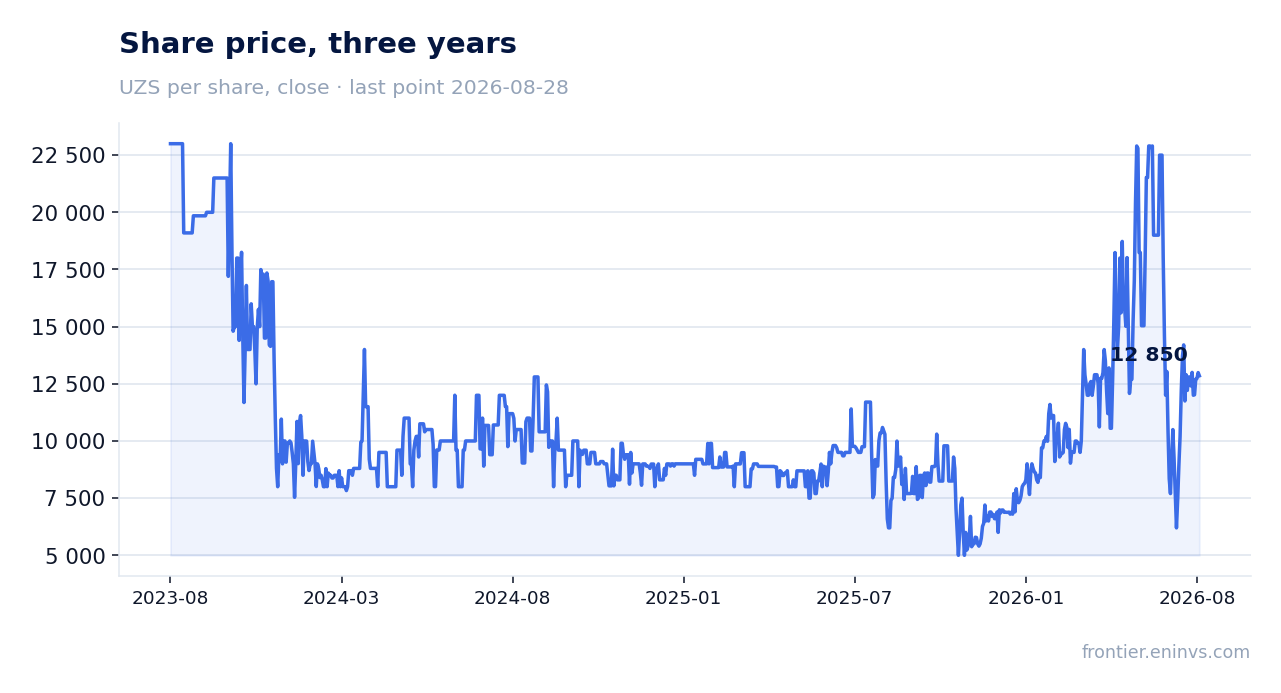
The current P/E LTM is 6.4. Over the past three years, the company's average P/E was higher, as seen from the dynamics of profit and capitalization. Thus, the stock trades at a discount to its own history.
The low multiple, combined with growing revenue and high profitability, makes the stock attractive for long-term investment. However, margin compression in the latest quarter warrants attention.
Valuation on the latest reported figures
| Metric | Value |
|---|---|
| Market cap | 1 270 bn UZS |
| P/E (LTM) | 6.4 |
| P/B | 2.10 |
| ROE | 19.9% |
| Dividend yield (12m) | 4.4% |
Bottom line
The strength of the report was accelerating revenue growth (+30.9% in Q1 2026) and high return on equity (19.9%). However, net profit rose only 6.6% due to margin falling from 42.9% to 34.9%, which may be due to one-offs or cost increases. With P/E LTM of 6.4 and +24% upside on the portal's model, the stock looks attractive, but investors should watch margin dynamics in upcoming reports.
Open the company's financial profile UNIVERSAL →
See also: market overview · valuation map · stock screeners