AngloGold Ashanti: quarterly profit up 49.8%, but the portal's model sees 31% downside
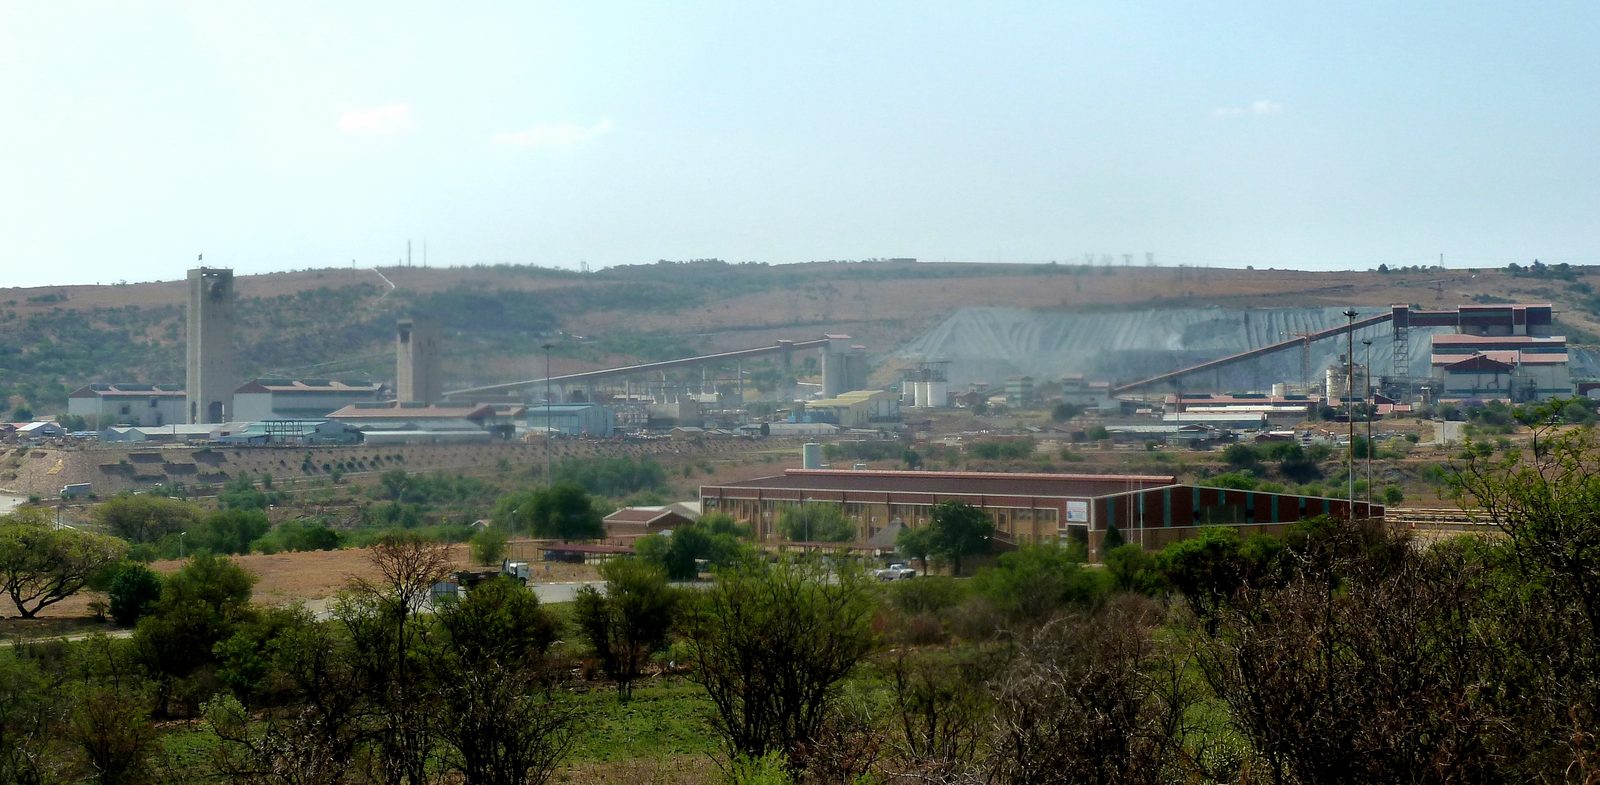
On August 25, AngloGold Ashanti reported Q2 2026 results: revenue grew 27.0% YoY, EBITDA – 55.8%, net profit – 49.8%. While the stock trades at a discount to its own three-year history on EV/EBITDA, our portal's model sees 31% downside, making the share rather unattractive.
Key takeaways
— Q2 revenue grew 27.0% amid high gold prices
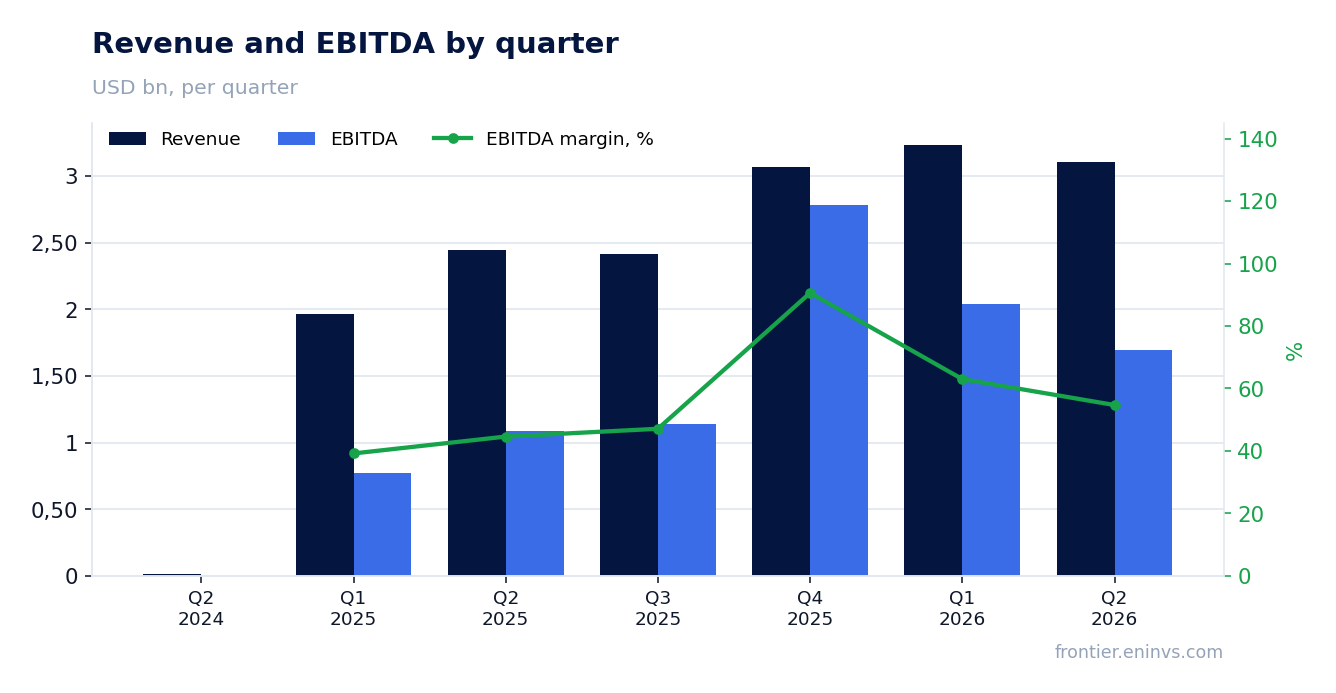
— EBITDA margin expanded to 54.7% from 44.6% a year ago, driven by operating leverage
— Net profit rose 49.8%, but part of the growth may be due to one-off factors
— The company continues to generate strong operating cash flow, covering capex and dividends
— Net debt is negative, providing financial flexibility
— EV/EBITDA multiple is below the three-year average, but the portal's model suggests overvaluation
Attractiveness
Key figures, USD bn
| Metric | Q2 2025 | Q2 2026 | Change |
|---|---|---|---|
| Revenue | 2.44 | 3.10 | +27.0% |
| EBITDA | 1.09 | 1.70 | +55.8% |
| Operating profit | 1.00 | 1.58 | +58.5% |
| Net profit | 0.67 | 1.00 | +49.8% |
| Operating cash flow | 1.02 | 1.43 | +40.7% |
| Capex | 0.35 | 0.49 | +39.1% |
| EBITDA margin | 44.6% | 54.7% | +10.1 pp |
| Net margin | 27.4% | 32.3% | +4.9 pp |
Q2 revenue grew 27.0% amid high gold prices
In Q2 2026, AngloGold Ashanti's revenue reached USD 3,104 million, up 27.0% from the same quarter a year earlier. Growth was driven by favorable gold prices, keeping revenue at record levels.
Quarterly dynamics show deceleration: Q1 2026 growth was 64.8%, while Q2 2026 was 27.0%. Nevertheless, absolute revenue remains high, reflecting sustained demand for precious metals.
EBITDA margin expanded to 54.7% from 44.6% a year ago, driven by operating leverage
EBITDA for Q2 2026 rose 55.8% YoY to USD 1,698 million, with EBITDA margin reaching 54.7% versus 44.6% a year earlier. Margin expansion is due to operating leverage: revenue growth outpaces cost growth.
Quarterly EBITDA in Q2 was lower than in Q1 (1,698 vs. 2,039 million), reflecting some decline in gold prices during the quarter, but annual dynamics remain strong.
Net profit rose 49.8%, but part of the growth may be due to one-off factors
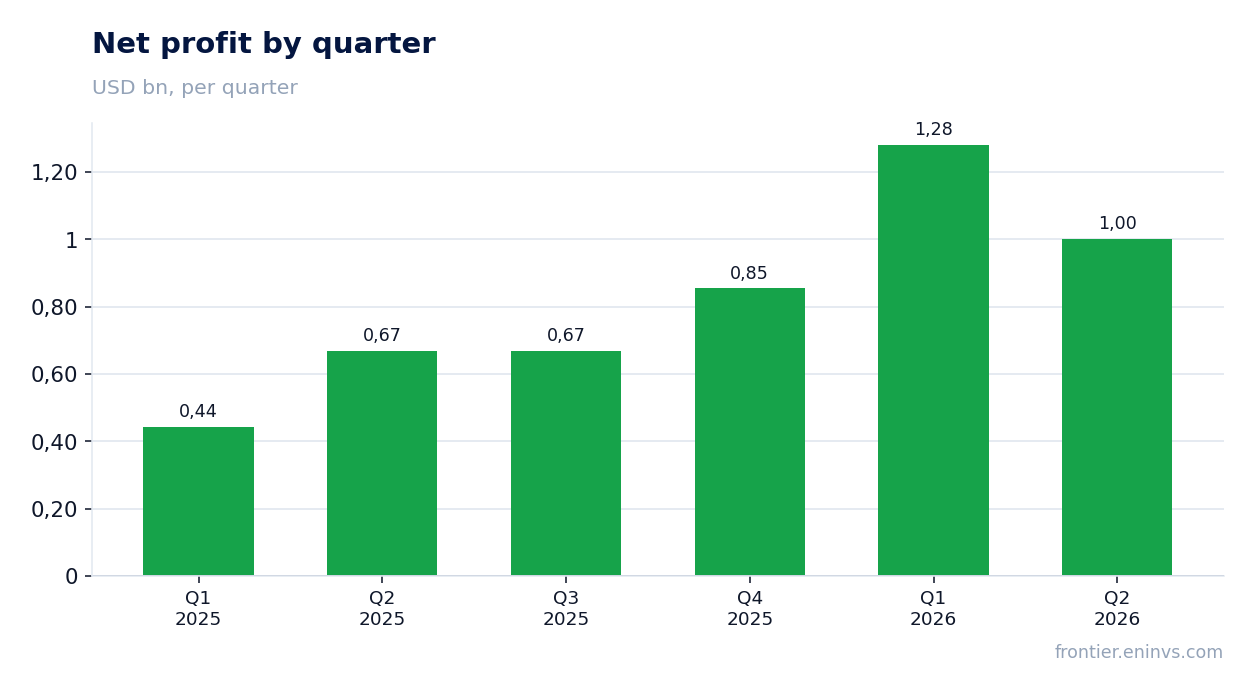
Net profit in Q2 2026 was USD 1,002 million, up 49.8% from a year earlier. Net margin increased to 32.3% from 27.4%.
Profit may include one-off items, as operating profit grew 58.5% while net profit grew 49.8%, indicating less proportional growth after taxes and interest. However, without additional data, the exact nature of these factors cannot be determined.
The company continues to generate strong operating cash flow, covering capex and dividends
Operating cash flow in Q2 2026 was USD 1,432 million, well above capex of USD 487 million. Free cash flow remains positive, allowing dividends and investments to be funded without increasing debt.
Over the trailing twelve months, operating cash flow reached USD 4,800 million, confirming the sustainability of cash generation. Dividend yield for the same period was 4.19%, which looks attractive given positive free cash flow.
Net debt is negative, providing financial flexibility
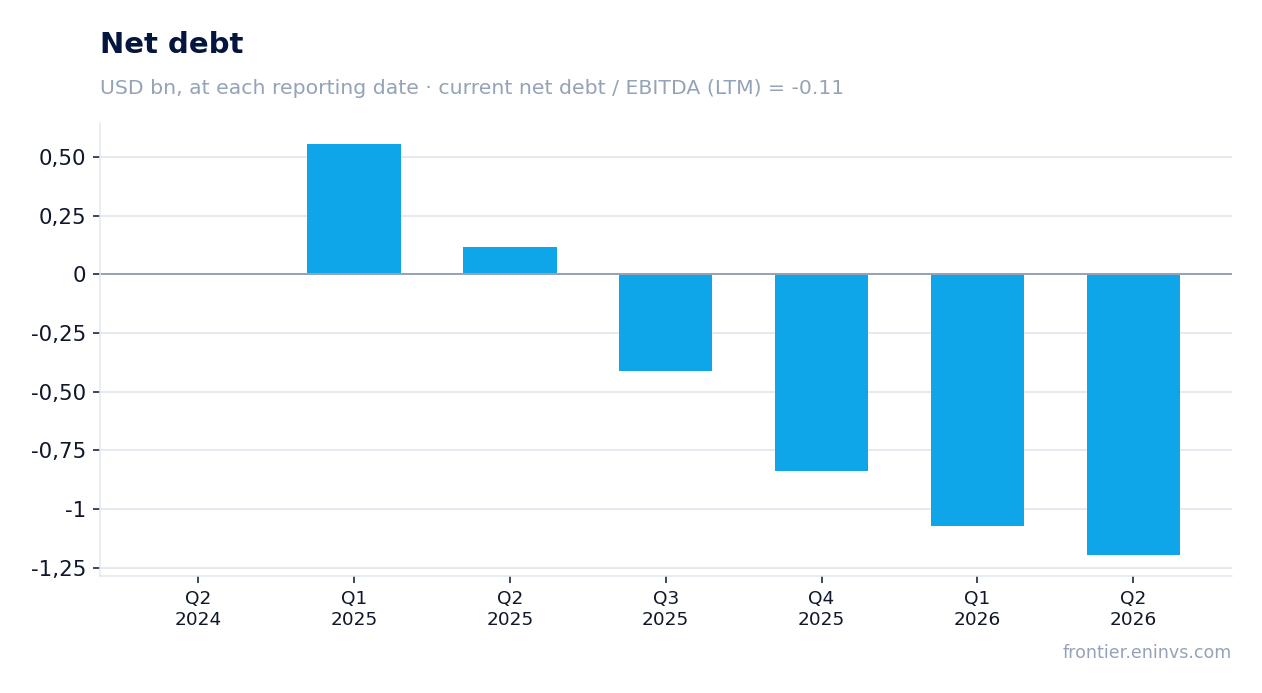
As of end-Q2 2026, the company had a net cash position of USD 1,198 million (negative net debt). Over the quarter, net cash improved by USD 0.1 billion, and over the last 12 months by USD 1.3 billion.
Net debt to EBITDA for the trailing twelve months is -0.11, reflecting low leverage. This gives the company room to increase capex or shareholder returns without harming the balance sheet.
EV/EBITDA multiple is below the three-year average, but the portal's model suggests overvaluation
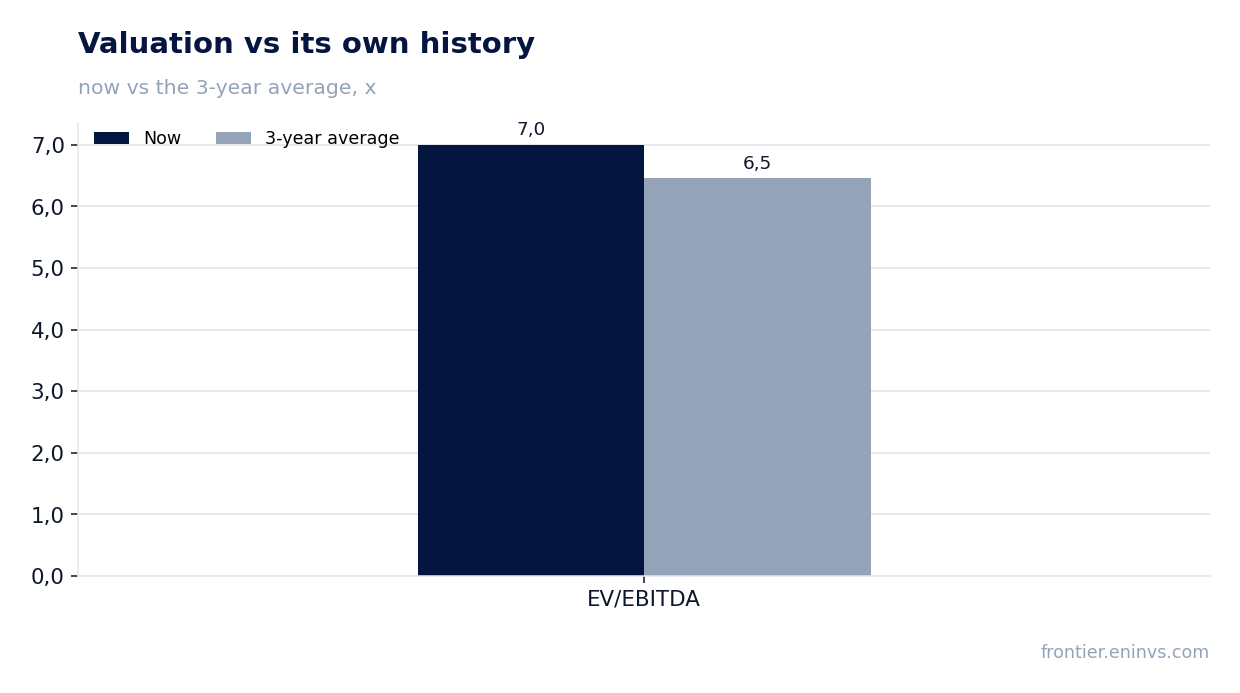
Current EV/EBITDA multiple is 7.0, which is above the three-year average of 6.46, indicating a slight premium to its own history. P/E for the trailing twelve months is 14.4.
However, according to the portal's model, which re-prices EBITDA at current gold prices and applies a target EV/EBITDA, the stock has -31% downside. This suggests that the market has already priced in high expectations, and the current valuation may be stretched.
Valuation on the latest reported figures
| Metric | Value |
|---|---|
| Market cap | 54.8 bn USD |
| P/E (LTM) | 14.4 |
| EV/EBITDA (LTM) | 7.0 |
| P/B | 6.77 |
| Net debt / EBITDA (LTM) | -0.11 |
| Operating cash flow (LTM) | 4.80 bn |
| ROE | 45.8% |
| Dividend yield (12m) | 4.2% |
| EV/EBITDA, 3-year average | 6.5 |
Bottom line
AngloGold Ashanti's Q2 2026 report shows strong growth in revenue, EBITDA, and net profit, supported by high gold prices. The company generates significant operating cash flow, has negative net debt, and pays a dividend yield of 4.19%. However, the current valuation, according to the portal's model, suggests 31% downside, making the shares rather unattractive at current levels. A change in view would require either a lower share price to levels consistent with the model, or further gold price increases justifying the current valuation.
Open the company's financial profile ANG →
See also: market overview · valuation map · stock screeners