Gold Fields: H1 profit up 80.6% — but the portal's model sees 17% downside
On August 25, Gold Fields reported H1 2026 results: revenue up 70.7%, EBITDA up 95.5%, net profit up 80.6%. However, on the portal's model, the share trades 17% above fair value, making it rather unattractive at the current price.
Key takeaways
— H1 revenue up 70.7% — to 11,200.0 million USD over the trailing twelve months
— EBITDA margin expanded from 57.3% to 65.6% — operating leverage amid higher gold prices
— H1 net profit up 80.6% — to 4,395.3 million USD over the trailing twelve months
— Leverage remains low: net debt of 959.0 million USD against EBITDA of 7,394.8 million USD over twelve months
— Dividend yield of 3.0% — moderate but backed by strong cash flow
— The portal's model values the share 17% above fair value
Attractiveness
Key figures, USD bn
| Metric | H1 2025 | H1 2026 | Change |
|---|---|---|---|
| Revenue | 3.48 | 5.94 | +70.7% |
| EBITDA | 1.99 | 3.89 | +95.5% |
| Operating profit | 1.61 | 3.27 | +102.2% |
| Net profit | 1.03 | 1.85 | +80.6% |
| Operating cash flow | 1.65 | 3.03 | +83.2% |
| Capex | 0.66 | 0.71 | +6.7% |
| EBITDA margin | 57.3% | 65.6% | +8.3 pp |
| Net margin | 29.5% | 31.2% | +1.7 pp |
H1 revenue up 70.7% — to 11,200.0 million USD over the trailing twelve months
In H1 2026, Gold Fields' revenue grew 70.7% year-on-year. The main driver was higher gold prices, which directly increased revenue with production volumes nearly unchanged.
Over the trailing twelve months (LTM), revenue reached 11,200.0 million USD, reflecting continued strong price environment. The company maintains its leading position in gold mining, and current gold prices ensure high profitability.
EBITDA margin expanded from 57.3% to 65.6% — operating leverage amid higher gold prices
EBITDA for H1 2026 grew 95.5% year-on-year, with EBITDA margin expanding from 57.3% to 65.6%. Gold price growth outpaces cost increases, providing operating leverage.
Over the trailing twelve months, EBITDA reached 7,394.8 million USD. Margin expansion is a key efficiency indicator: the company earns additional profit from each extra dollar of revenue.
H1 net profit up 80.6% — to 4,395.3 million USD over the trailing twelve months
Net profit for H1 2026 grew 80.6% year-on-year. The growth was driven by both higher EBITDA and net margin expansion from 29.5% to 31.2%.
Over the trailing twelve months, net profit reached 4,395.3 million USD, which at the current market cap gives a P/E LTM of 9.7 — inexpensive compared to historical levels for gold miners.
Leverage remains low: net debt of 959.0 million USD against EBITDA of 7,394.8 million USD over twelve months
As of the latest balance sheet date, Gold Fields' net debt stood at 959.0 million USD, corresponding to a net debt / EBITDA LTM ratio of 0.13. This is a very low leverage, providing financial flexibility.
Over the past twelve months, net debt decreased by 1.1 billion USD (in ruble equivalent), reflecting strong operating cash flow of 3,800.0 million USD over LTM. The company allocates free cash to debt reduction and dividends.
Dividend yield of 3.0% — moderate but backed by strong cash flow
Over the trailing twelve months, Gold Fields' dividend yield was 3.0%. This is a moderate level, but it is backed by operating cash flow of 3,800.0 million USD over LTM, ensuring comfortable dividend coverage.
Given low leverage and stable cash flow, the company has the capacity to maintain or increase dividends. However, the current yield is below the sector average, limiting appeal for income-oriented investors.
The portal's model values the share 17% above fair value
According to the portal's model, which re-prices EBITDA at current gold prices and applies a target EV/EBITDA, the share trades 17% above fair value. This means the current price already reflects an optimistic scenario for gold prices.
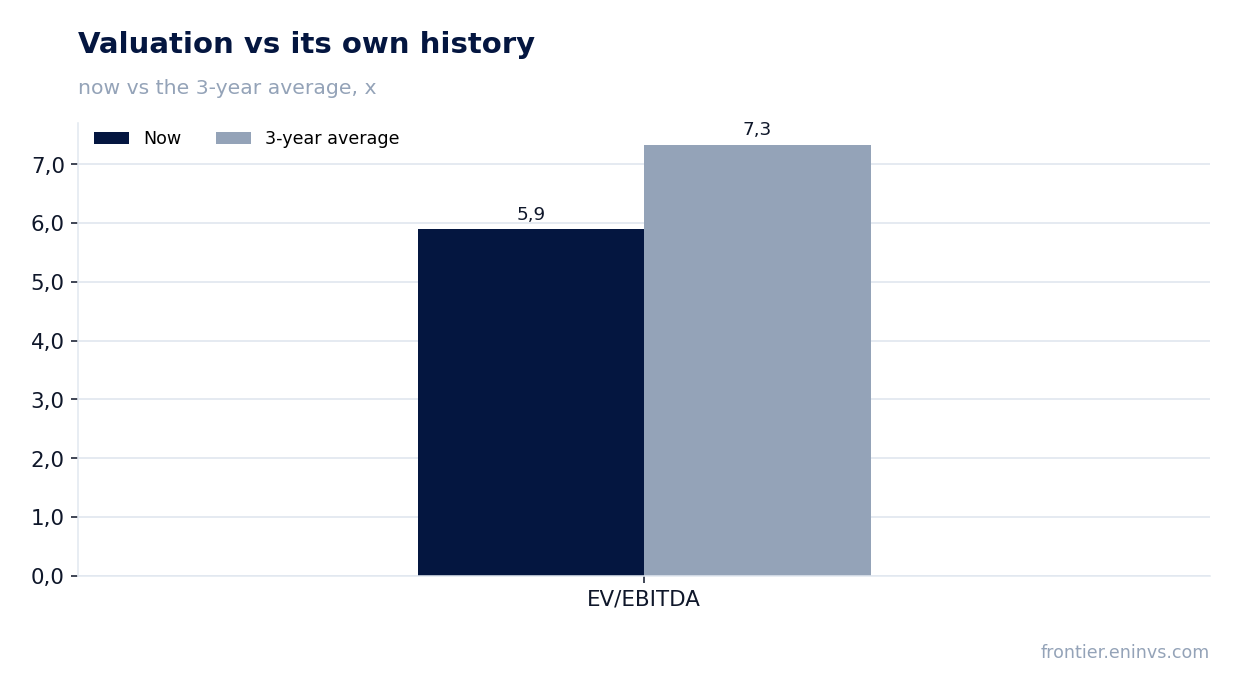
The current EV/EBITDA LTM is 5.9, below the three-year average of 7.3. However, the portal's model incorporates a higher target valuation, resulting in negative upside.
Valuation on the latest reported figures
| Metric | Value |
|---|---|
| Market cap | 42.6 bn USD |
| P/E (LTM) | 9.7 |
| EV/EBITDA (LTM) | 5.9 |
| P/B | 5.06 |
| Net debt / EBITDA (LTM) | 0.13 |
| Operating cash flow (LTM) | 3.80 bn |
| ROE | 42.0% |
| Dividend yield (12m) | 3.0% |
| EV/EBITDA, 3-year average | 7.3 |
Bottom line
Gold Fields delivered strong H1 2026 results: revenue up 70.7%, EBITDA margin expanded to 65.6%, and net profit up 80.6%. Leverage is minimal, cash flow is stable, and dividends are paid. However, per the portal's model, the share trades 17% above fair value, making it rather unattractive at the current level. A change in the assessment would require either further gold price increases or a decline in the share price to levels consistent with the model.
Open the company's financial profile GFI →
See also: market overview · valuation map · stock screeners