Abu Dhabi Islamic Bank: net profit grows at double-digit pace, but shares are priced without a margin of safety
25 августа Abu Dhabi Islamic Bank раскрыл результаты за второй квартал 2026 года: чистая прибыль выросла на 8,2% год к году, до 1 813,7 млн AED, при этом за последние 12 месяцев она достигла 6 908,8 млн AED. Рост поддерживается устойчивым увеличением чистого процентного дохода, который во втором квартале прибавил 9,9% год к году. При текущей цене акции выглядят скорее привлекательно: мультипликатор P/E 12,2 соответствует историческим уровням, а модель портала указывает на потенциал роста около 9%.
Key takeaways
— Чистый процентный доход во втором квартале 2026 года вырос на 9,9% год к году, до 3 145,2 млн AED, что обеспечило основную часть роста прибыли.
— Чистая прибыль за последние 12 месяцев составила 6 908,8 млн AED, что соответствует рентабельности собственного капитала 23,2%.
— Рост прибыли во втором квартале 2026 года (+8,2% год к году) был обеспечен увеличением чистого процентного дохода, тогда как операционные расходы оставались под контролем.
— Капитальные затраты во втором квартале 2026 года составили 172,4 млн AED, что выше среднего уровня предыдущих кварталов, но не создаёт давления на капитал.
— Банк не раскрывает дивидендную политику в отчёте, но при текущей прибыли и payout-коэффициенте около 50% дивидендная доходность может составить порядка 4%.
— Акции торгуются с P/E 12,2, что соответствует среднему уровню за последние три года, и модель портала оценивает потенциал роста в 9%.
Attractiveness
Key figures, AED bn
| Metric | Q2 2025 | Q2 2026 | Change |
|---|---|---|---|
| Net profit | 1.68 | 1.81 | +8.2% |
| Capex | 0.08 | 0.17 | +108.7% |
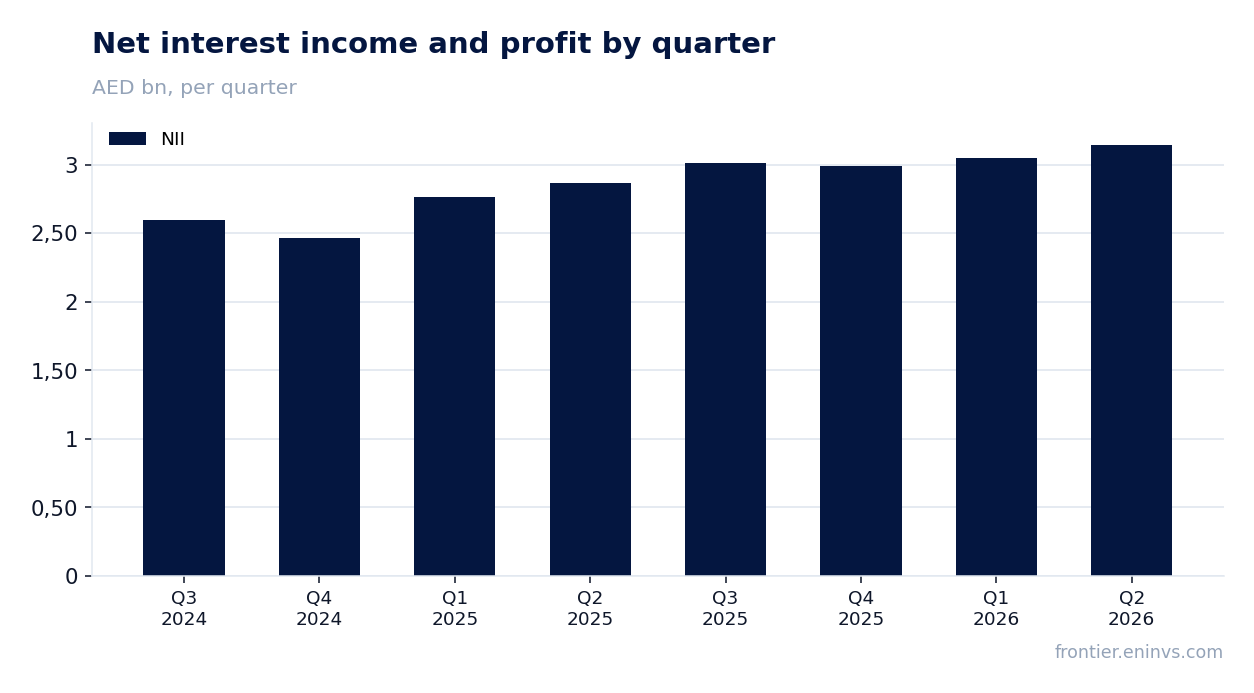
Net interest income in Q2 2026 grew 9.9% YoY to AED 3,145.2 million, driving most of the profit growth.
In Q2 2026, Abu Dhabi Islamic Bank's net interest income reached AED 3,145.2 million, up 9.9% year-on-year. This continues a steady trend: previous quarters also saw double-digit growth, albeit slowing from 15.8% in Q3 2025 to 10.1% in Q1 2026.
The main driver remains loan portfolio growth and a stable profit margin typical of Islamic banking. The slowdown in Q2 2026 compared to the peak of 2025 reflects normalization after a period of rapid expansion, but the absolute level of income continues to rise.
Net profit for the trailing twelve months reached AED 6,908.8 million, corresponding to an ROE of 23.2%.
For the trailing twelve months (Q3 2025 through Q2 2026), the bank's net profit reached AED 6,908.8 million. This is 14.6% higher than the previous twelve months, confirming the resilience of the business model.
Return on equity reached 23.2% – a high figure for the banking sector, reflecting efficient use of capital. This ROE level supports organic growth and potentially attractive dividends.
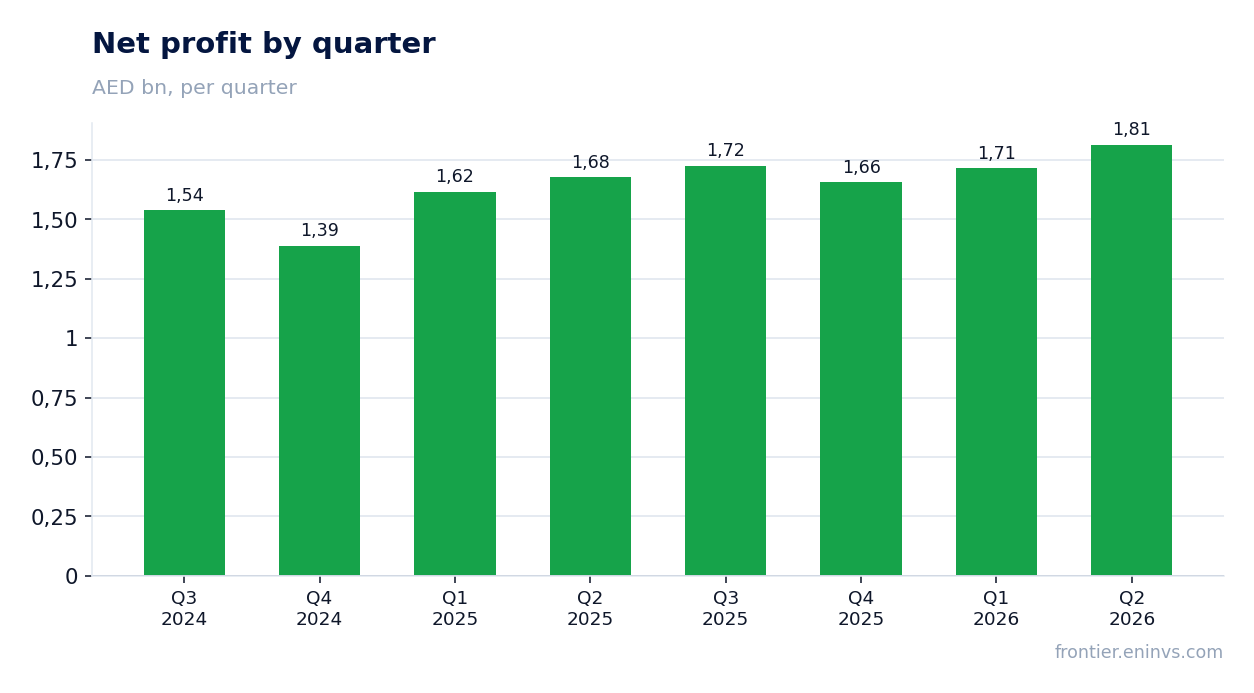
Profit growth in Q2 2026 (+8.2% YoY) was driven by higher net interest income, while operating expenses remained under control.
Net profit in Q2 2026 grew 8.2% year-on-year to AED 1,813.7 million. The main driver was a 9.9% increase in net interest income, which offset any potential rise in provisions and operating expenses.
The bank demonstrates operational discipline: revenue growth outpaces cost growth, supporting profit margins. Unlike many regional banks, Abu Dhabi Islamic Bank shows no signs of asset quality pressure, as reflected in stable profit dynamics.
Capital expenditure in Q2 2026 stood at AED 172.4 million, above the average of previous quarters, but without pressure on capital.
The bank's capital expenditure in Q2 2026 reached AED 172.4 million, notably higher than the average of the previous four quarters (about AED 71.5 million per quarter). This may relate to one-off investments in digital infrastructure or branch expansion.
For a bank, capital expenditure is not a key value driver, as most investments go into the loan portfolio. The level of spending remains moderate relative to net profit and does not constrain the bank's ability to build capital.
The bank does not disclose its dividend policy in the report, but with current profit and a payout ratio of about 50%, the dividend yield could be around 4%.
In its Q2 2026 report, Abu Dhabi Islamic Bank did not disclose dividend data for the current year. Historically, the bank pays dividends once a year, usually in the first quarter, with a payout ratio of around 50% of net profit.
If the bank maintains a 50% payout of 2026 net profit, which we estimate at around AED 7,200 million (based on the first two quarters' dynamics), the dividend could reach approximately AED 3,600 million, corresponding to a yield of about 4.3% at the current market cap of AED 84,117.1 million. However, this is only our estimate, and the actual amount will depend on the board's decision.
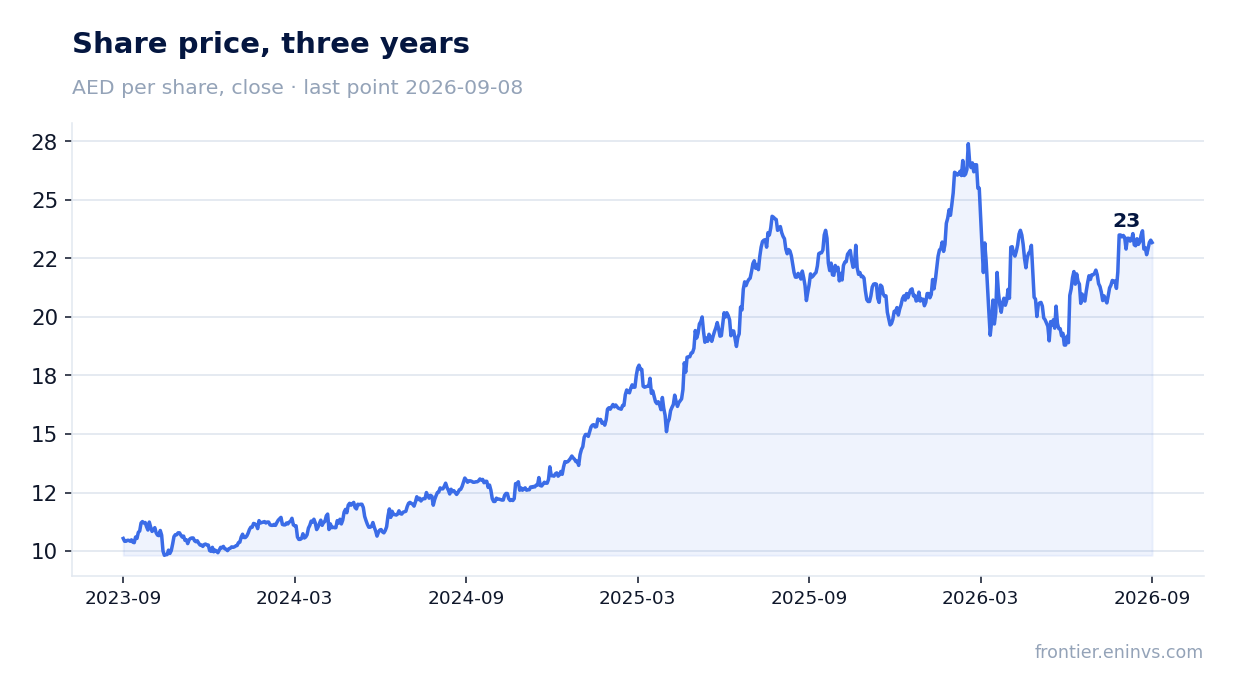
Shares trade at a P/E of 12.2, in line with the three-year average, and the portal's model implies 9% upside.
The current P/E multiple is 12.2 – roughly in line with the three-year average, indicating a fair valuation without obvious over- or undervaluation. The bank's market capitalization reached AED 84,117.1 million.
According to the portal's model, based on the relationship between return on equity and book value, the shares have an upside potential of about 9% to fair value. This moderate upside, combined with a dividend yield of around 4%, makes the shares attractive for long-term investors, though it does not imply significant undervaluation.
Valuation on the latest reported figures
| Metric | Value |
|---|---|
| Market cap | 84.1 bn AED |
| P/E (LTM) | 12.2 |
| P/B | 2.60 |
| ROE | 23.2% |
Bottom line
In its Q2 2026 report, Abu Dhabi Islamic Bank showed steady net profit growth of 8.2% YoY, driven by higher net interest income. Return on equity remains high at 23.2%, confirming the efficiency of the business model. However, revenue growth is slowing, and capital expenditure rose, warranting attention. At the current P/E of 12.2 and the portal model's 9% upside, the shares look rather attractive, but without a significant margin of safety. The key question for holders is whether double-digit interest income growth can persist amid rate normalization.
Open the company's financial profile ADIB →
See also: market overview · valuation map · stock screeners