Lynas: profit up 27-fold, but the multiple is already twice its own history
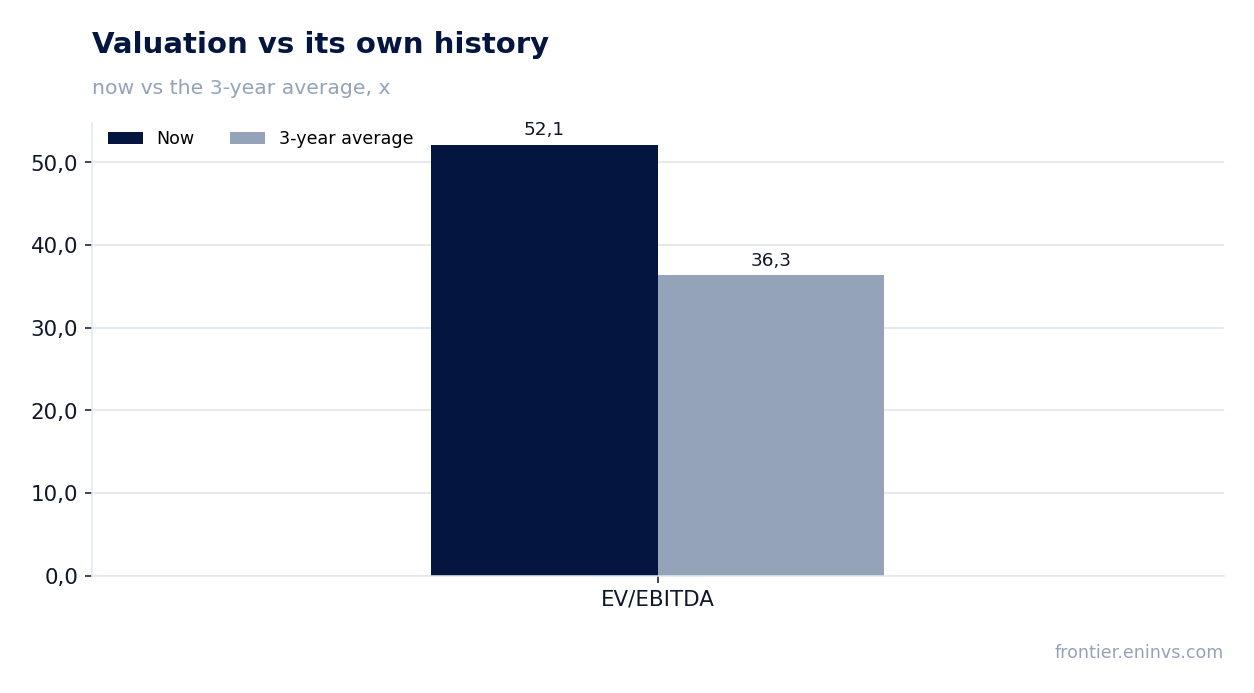
Lynas reported FY 2026 results. Revenue rose 80.2% year on year, EBITDA — 184.7%, net profit — 2682.9%. EBITDA margin reached 29.8% versus 18.9% a year earlier, net margin — 22.7% versus 1.5%. At the same time, EV/EBITDA for the trailing twelve months stands at 52.1 against a three-year average of 36.3, while the portal model implies 22% upside to fair value. Given the multiple is twice its own historical average and no dividend is paid, the share looks neutral: the operational leap is largely priced in.
Key takeaways
— Revenue rose 80.2% year on year to AUD 977.9 million for the trailing twelve months
— EBITDA jumped 184.7%, with margin reaching 29.8% versus 18.9% a year earlier
— Net profit increased 27-fold to AUD 222.4 million for the trailing twelve months
— Operating cash flow came in at AUD 318.8 million for the trailing twelve months
— Net debt is negative at minus AUD 384.4 million, with net debt/EBITDA LTM at minus 1.32
— EV/EBITDA LTM of 52.1 versus a three-year average of 36.3 — the stock trades at twice its own history
— The portal model implies 22% upside to fair value
Attractiveness
Key figures, AUD bn
| Metric | FY 2025 | FY 2026 | Change |
|---|---|---|---|
| Revenue | 0.54 | 0.98 | +80.2% |
| EBITDA | 0.10 | 0.29 | +184.7% |
| Operating profit | 0.01 | 0.24 | +3162.0% |
| Net profit | 0.01 | 0.22 | +2682.9% |
| Operating cash flow | 0.10 | 0.32 | +206.1% |
| Capex | 0.43 | 0.18 | -58.6% |
| EBITDA margin | 18.9% | 29.8% | +10.9 pp |
| Net margin | 1.5% | 22.7% | +21.2 pp |
Revenue rose 80.2% year on year to AUD 977.9 million for the trailing twelve months
Lynas revenue for the trailing twelve months reached AUD 977.9 million, up 80.2% year on year. This growth is driven by higher production and sales volumes of rare earth products, as well as favourable pricing for neodymium and praseodymium.
The company does not disclose segment or regional details in the provided facts, so the source of growth can only be described broadly: the main contribution came from ramping up output at facilities in Australia and Malaysia. The near-doubling of revenue is not a one-off effect but a reflection of increased production capacity.
For comparison, a year earlier revenue was 80.2% lower, indicating a sharp acceleration in operating activity. However, the sustainability of this growth will depend on rare earth prices holding up and the company's ability to maintain the achieved volumes.
EBITDA jumped 184.7%, with margin reaching 29.8% versus 18.9% a year earlier
EBITDA for the trailing twelve months reached AUD 291.4 million, up 184.7% year on year. EBITDA growth significantly outpaces revenue growth, leading to margin expansion from 18.9% to 29.8%.
The faster growth in EBITDA means the company not only increased sales but also improved operational efficiency. Likely, economies of scale played a role: fixed costs were spread over a larger production volume, and the share of variable costs in revenue declined.
An EBITDA margin of 29.8% is a substantial level for a rare earth producer. However, it is worth noting that a year earlier the margin was almost half that, and such a jump may be linked to one-off factors that will not repeat in the next period.
Net profit increased 27-fold to AUD 222.4 million for the trailing twelve months
Lynas net profit for the trailing twelve months reached AUD 222.4 million, 27 times higher than a year earlier. This increase is explained by both a sharp rise in operating profit and a low base last year, when net margin was only 1.5%.
Net margin in the reporting period reached 22.7% versus 1.5% a year earlier. This means the company not only grew revenue but also significantly improved control over expenses, including interest payments and taxes.
A 27-fold increase in net profit is an outstanding result, but it was achieved from a very low base. In absolute terms, a profit of AUD 222.4 million on revenue of AUD 977.9 million looks healthy, but to sustain this level the company needs to maintain high product prices and sales volumes.
Operating cash flow came in at AUD 318.8 million for the trailing twelve months
Lynas operating cash flow for the trailing twelve months reached AUD 318.8 million. This exceeds net profit, indicating high earnings quality and efficient working capital management.
Such cash flow allows the company to fund capital expenditures and expansion investments without raising additional debt. Given that net debt is negative, Lynas has significant liquidity headroom.
However, the sustainability of operating cash flow depends on rare earth prices and sales volumes. If prices decline, cash flow could fall faster than profit due to operating leverage.
Net debt is negative at minus AUD 384.4 million, with net debt/EBITDA LTM at minus 1.32
Lynas net debt at the latest reporting date stood at minus AUD 384.4 million, meaning the company has a net cash position. The net debt/EBITDA ratio for the trailing twelve months is minus 1.32.
Negative net debt means cash and equivalents exceed debt obligations. This gives the company financial flexibility for expansion investments or potential future dividends.
Over the past twelve months, net debt decreased by RUB 0.4 billion, while compared to the previous reporting date it increased by RUB 0.2 billion. However, these changes do not alter the overall picture: Lynas remains a company with a net cash position and low debt burden.
EV/EBITDA LTM of 52.1 versus a three-year average of 36.3 — the stock trades at twice its own history
Lynas EV/EBITDA for the trailing twelve months is 52.1, significantly above the three-year average of 36.3. Thus, the current valuation is more than 1.4 times its own historical norm.
The P/E for the trailing twelve months is 70.0, also indicating a high valuation. The market has already priced in significant profit growth, and to justify the current multiple the company needs to continue delivering strong financial results.
According to the portal model, the upside to fair value is 22%. This means that even with the high valuation, the model sees some upside, but it is modest compared to the risks associated with rare earth price volatility.
The portal model implies 22% upside to fair value
According to the portal model, the fair value of Lynas shares implies 22% upside to the current market price. This estimate is based on EBITDA growth multiplied by the target multiple and compared with market capitalisation.
The model takes into account current financial results and assumes the company can sustain the achieved EBITDA level. If actual EBITDA falls short, the upside may shrink or disappear.
It is important to understand that this is our own model's estimate, not a market consensus or a target price. It reflects our view of fair value based on available data and may differ from other market participants' assessments.
Valuation on the latest reported figures
| Metric | Value |
|---|---|
| Market cap | 15.6 bn AUD |
| P/E (LTM) | 70.0 |
| EV/EBITDA (LTM) | 52.1 |
| P/B | 4.46 |
| Net debt / EBITDA (LTM) | -1.32 |
| Operating cash flow (LTM) | 0.32 bn |
| ROE | 8.1% |
| EV/EBITDA, 3-year average | 36.3 |
Bottom line
Lynas delivered impressive FY 2026 results: revenue up 80.2%, EBITDA up 184.7%, net profit up 27-fold. The company has negative net debt and strong operating cash flow. However, the current EV/EBITDA of 52.1 significantly exceeds the three-year average of 36.3, and the portal model implies only 22% upside. This makes the stock vulnerable to any disappointments in future reports. Given this, we rate the share as neutral: the operational success is largely priced in, and further growth requires new drivers.
Open the company's financial profile LYC →
See also: market overview · valuation map · stock screeners