New Hope: revenue flat, profit down 63% as margin normalises
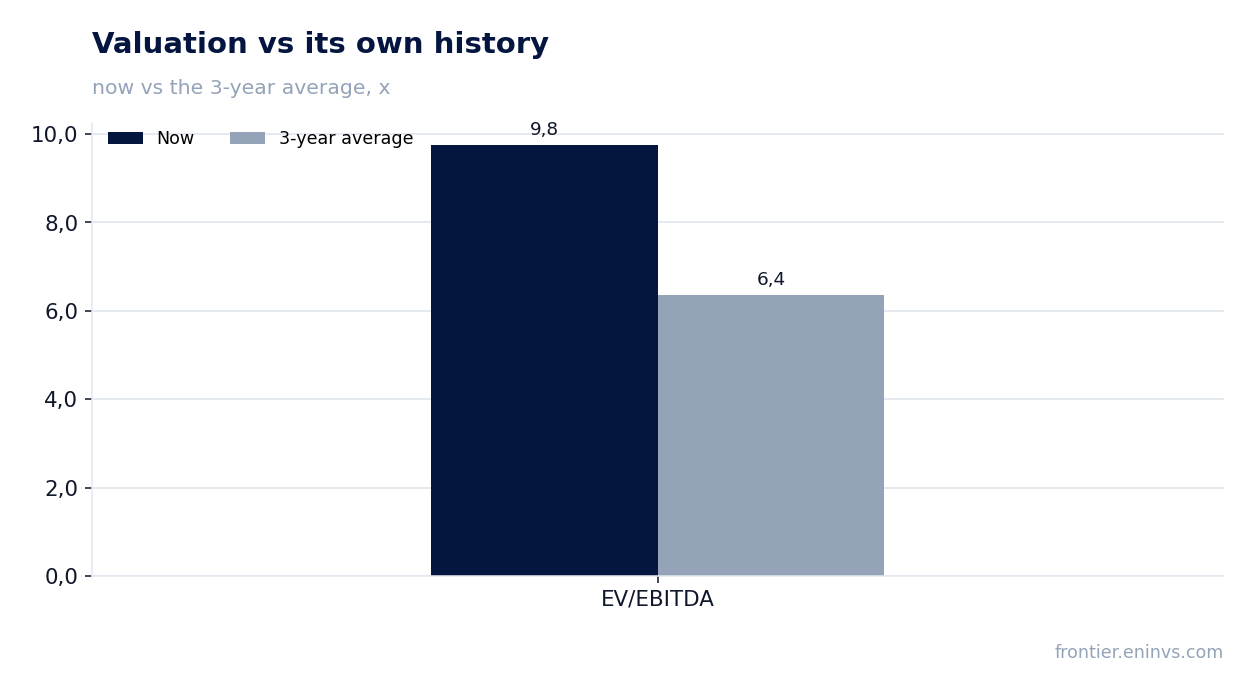
New Hope today reported FY 2026 results. Revenue came in at A$1,766.53m, up just 0.9% year on year, while net profit collapsed 63.4% to A$160.96m and the net margin narrowed from 25.1% to 9.1%. The company remains debt-free with a net cash position of A$478.677m, but at a P/E of 33.7 and EV/EBITDA of 9.8 against its own three-year average of 6.36, the share looks rather unattractive: the market is already pricing a profit recovery that the report does not yet show.
Key takeaways
— Revenue barely grew – up 0.9% to A$1,766.53m – against a strong prior-year base
— Net profit collapsed 63.4% to A$160.96m, with the net margin narrowing from 25.1% to 9.1% on a high base effect
— Operating profit of A$267.525m and operating cash flow of A$564.128m show the business remains profitable and cash-generative
— The company is debt-free: net cash of A$478.677m and net debt/EBITDA LTM of negative 0.95
— Capex of A$193.06m absorbs about two-thirds of operating cash flow, limiting free cash
— Dividend yield of 3.85% is below many commodity peers and does not offset the profit decline
— Valuation does not look cheap: EV/EBITDA of 9.8 versus its own three-year average of 6.36, and the portal model suggests the share is 27% overvalued
Attractiveness
Key figures, AUD bn
| Metric | FY 2025 | FY 2026 | Change |
|---|---|---|---|
| Revenue | 1.75 | 1.77 | +0.9% |
| EBITDA | 0.75 | — | — |
| Operating profit | 0.37 | 0.27 | -27.5% |
| Net profit | 0.44 | 0.16 | -63.4% |
| Operating cash flow | 0.57 | 0.56 | -1.2% |
| Capex | 0.31 | -0.19 | -162.0% |
| EBITDA margin | 42.8% | — | — |
| Net margin | 25.1% | 9.1% | -16.0 pp |
Revenue barely grew – up 0.9% to A$1,766.53m – against a strong prior-year base
New Hope's FY 2026 revenue came in at A$1,766.53m, just 0.9% above the prior-year level. Growth is essentially absent: the company failed to expand sales after an exceptionally strong prior year in terms of pricing.
The revenue dynamics reflect primarily a price factor rather than volume. Without segment detail it is hard to say what supported sales, but the stagnation against a high base suggests that the exhaustion of the price rally is not being offset by higher shipments.
For investors, this means that hopes for a profit recovery driven by revenue are not yet materialising. The company is operating in an environment where even maintaining last year's sales level requires effort, and growth is only possible with a new surge in coal prices.
Net profit collapsed 63.4% to A$160.96m, with the net margin narrowing from 25.1% to 9.1% on a high base effect
Net profit for FY 2026 was A$160.96m, down 63.4% year on year. The net margin fell from 25.1% to 9.1% – a 16 percentage point decline driven mainly by the high base effect: last year the company earned at the peak of coal prices.
Operating profit was A$267.525m, also significantly below the prior-year level, though less dramatically than net profit. The gap between operating and net profit may be explained by tax or one-off items, but without further detail from the report the exact cause is not disclosed.
The current margin of 9.1% looks more sustainable than the anomalous 25.1% a year earlier. However, judging by the valuation, the market expects a profit recovery rather than stabilisation at the current level.
Operating profit of A$267.525m and operating cash flow of A$564.128m show the business remains profitable and cash-generative
Despite the profit decline, New Hope's operating activity remains profitable: operating profit was A$267.525m. Operating cash flow was significantly higher at A$564.128m, indicating good cash conversion.
The excess of operating cash flow over operating profit may be explained by depreciation and changes in working capital. This is a positive signal: the business can fund its needs from internal resources.
However, a significant portion of this flow goes to capital expenditures, which amounted to A$193.06m. After deducting these, around A$371m remains – free cash flow that can be directed to dividends or debt reduction, though the company has no debt.
The company is debt-free: net cash of A$478.677m and net debt/EBITDA LTM of negative 0.95
New Hope maintains an exceptionally strong balance sheet: net cash at the end of FY 2026 was A$478.677m. This means cash and equivalents exceed debt obligations, and the company does not rely on borrowed funds.
The net debt/EBITDA ratio for the trailing twelve months is negative at minus 0.95. The negative value reflects a net cash position rather than debt burden. This level provides financial stability even amid volatile coal prices.
During the reporting period, the net cash position remained virtually unchanged – a decrease of RUB 0.4bn, which is insignificant relative to the total. The company is not increasing debt and has no need for additional financing.
Capex of A$193.06m absorbs about two-thirds of operating cash flow, limiting free cash
New Hope's capital expenditures for FY 2026 were A$193.06m. This is about two-thirds of operating cash flow of A$564.128m. This ratio means that a significant portion of earned funds is reinvested in maintaining and developing production.
Free cash flow after capex is around A$371m. This is still a solid amount, but significantly below operating cash flow. The company has to spend more on investment than during peak price periods when profits were higher.
For shareholders, this means that dividend potential is constrained by the need to fund capital programmes. If coal prices remain at current levels, the company is unlikely to significantly increase payouts without cutting investment.
Dividend yield of 3.85% is below many commodity peers and does not offset the profit decline
New Hope's dividend yield over the trailing twelve months is 3.85%. This is a modest level for a commodity company, especially against a 63.4% profit decline. The dividend does not compensate investors for capital losses if the share continues to fall.
The company pays dividends from profit, which in FY 2026 was A$160.96m. With a market capitalisation of A$5,417.02m, a 3.85% yield implies payouts of around A$208m – more than the net profit for the year. This ratio may be unsustainable if profit does not recover.
Our estimate for the current year's dividend assumes a conservative scenario: if profit remains at A$160.96m and the payout ratio stays at a level consistent with a 3.85% yield, the dividend may be maintained but without growth. The key risk is a cut if coal prices fall further.
Valuation does not look cheap: EV/EBITDA of 9.8 versus its own three-year average of 6.36, and the portal model suggests the share is 27% overvalued
On the EV/EBITDA multiple, New Hope trades at 9.8, well above its own three-year average of 6.36. This means the market values the company more expensively than its average over the past three years, despite the profit decline.
The trailing twelve-month P/E is 33.7 – a high level reflecting the low profit base. If profit does not recover, the multiple will remain inflated. For comparison, at a price corresponding to the average EV/EBITDA, the share would be significantly cheaper.
Our model, which re-prices EBITDA at current commodity prices and the target EV/EBITDA, suggests a fair value 27% below the current market price. This is not a consensus forecast but our own estimate, and it points to overvaluation.
Valuation on the latest reported figures
| Metric | Value |
|---|---|
| Market cap | 5.42 bn AUD |
| P/E (LTM) | 33.7 |
| EV/EBITDA (LTM) | 9.8 |
| P/B | 2.07 |
| Net debt / EBITDA (LTM) | -0.95 |
| Operating cash flow (LTM) | 0.56 bn |
| ROE | 6.2% |
| Dividend yield (12m) | 3.9% |
| EV/EBITDA, 3-year average | 6.4 |
Bottom line
Bottom line: New Hope remains a financially sound company with net cash of A$478.677m and operating cash flow of A$564.128m, but its profit collapsed 63.4% due to coal price normalisation. Revenue is barely growing, the margin has narrowed to 9.1%, and capex absorbs a significant portion of cash flow. Valuation looks stretched: EV/EBITDA of 9.8 versus its own three-year average of 6.36, and our model suggests the share is 27% overvalued. The 3.85% dividend yield does not compensate for the risks. At the current price, the share looks unattractive; a change in verdict would require either a rise in coal prices or a significant cut in capex and a profit recovery.
Open the company's financial profile NHC →
See also: market overview · valuation map · stock screeners