Azul: Q2 profit turned negative and EBITDA collapsed 65.5% — revenue growth did not help

Azul reported Q2 2026 results. Revenue rose 10.6% year-on-year to $980.4 million, but EBITDA fell 65.5% to $45.0 million and the company posted a net loss of $275.8 million versus a profit of $263.3 million a year earlier. The EBITDA margin compressed to 4.6% from 14.7%, and the net margin turned negative at -28.1%. Over the trailing twelve months, net profit was $389.3 million and leverage stood at 3.5x EBITDA. On our model, the shares are 6% above fair value, so the stock looks rather unattractive.
Key takeaways
— Revenue grew 10.6% but EBITDA fell 65.5% — growth did not reach profit
— EBITDA margin compressed to 4.6% from 14.7% — costs ate the growth
— Net loss of $275.8 million versus a profit a year earlier — a $539 million swing
— Leverage at 3.5x EBITDA with net debt of $6.36 billion — the level remains high
— Operating cash flow is negative — minus $41.0 million for the quarter
— Over the last 12 months profit was $389.3 million, but quarterly dynamics are deteriorating
— On the portal's model, fair value is 6% below the current price — limited upside
Attractiveness
Key figures, USD bn
| Metric | Q2 2025 | Q2 2026 | Change |
|---|---|---|---|
| Revenue | 0.89 | 0.98 | +10.6% |
| EBITDA | 0.13 | 0.05 | -65.5% |
| Operating profit | -0.01 | -0.10 | — |
| Net profit | 0.26 | -0.28 | -204.8% |
| Operating cash flow | -0.01 | -0.04 | — |
| Capex | 0.01 | 0.02 | +244.8% |
| EBITDA margin | 14.7% | 4.6% | -10.1 pp |
| Net margin | 29.7% | -28.1% | -57.8 pp |
Revenue grew 10.6% but EBITDA fell 65.5% — growth did not reach profit
In Q2 2026, Azul's revenue reached $980.4 million, up 10.6% year-on-year. This continues the growth trend, but the pace has slowed: in Q1 2026 revenue grew 13.6%, and in Q4 2025 it grew 62.5%. The deceleration may reflect both a high base effect and changing market conditions.
However, revenue growth did not translate into profit. EBITDA in Q2 was only $45.0 million, down 65.5% from $130.3 million a year earlier. This sharp decline means operating costs grew faster than revenue. As a result, the EBITDA margin compressed to 4.6% from 14.7% a year earlier.
The net loss for the quarter was $275.8 million versus a profit of $263.3 million in Q2 2025. The $539 million swing is explained by both the decline in operating profit and possibly one-off factors, but details are not available in the provided data. Operating profit turned negative — minus $102.1 million versus minus $6.5 million a year earlier.
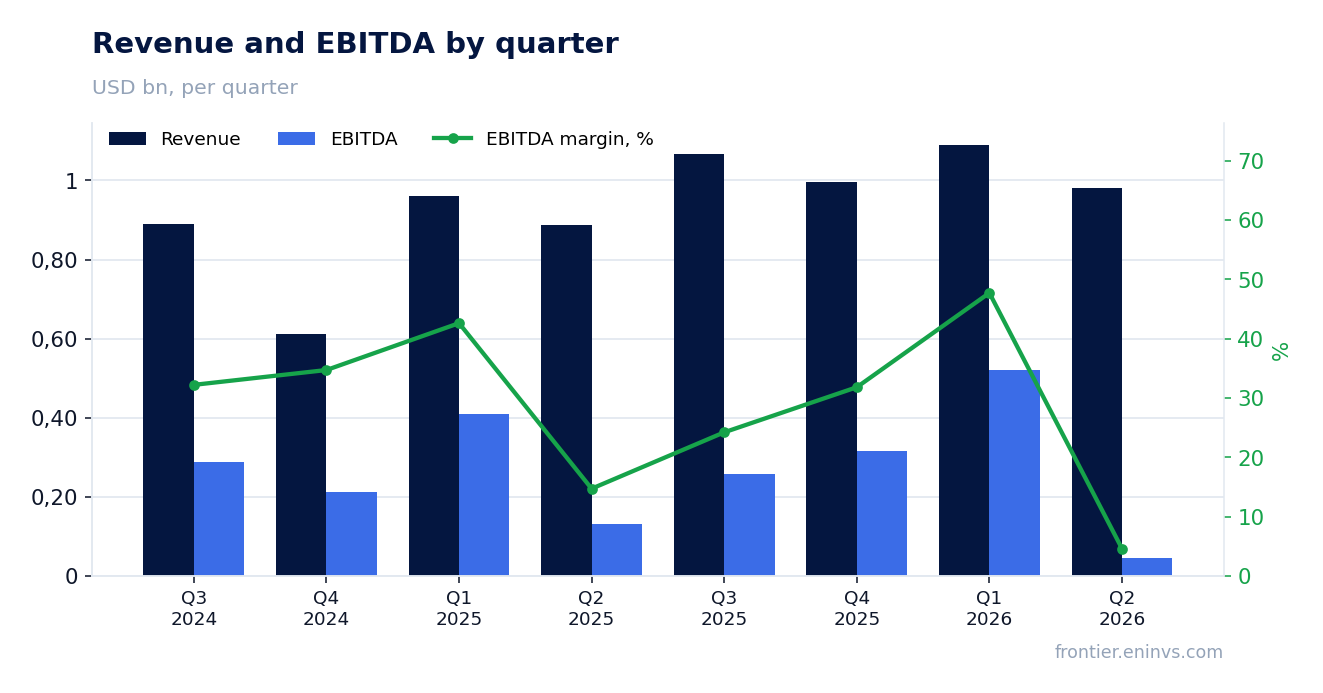
EBITDA margin compressed to 4.6% from 14.7% — costs ate the growth
The EBITDA margin in Q2 2026 was 4.6%, compared to 14.7% a year earlier. A drop of 10.1 percentage points is the key negative of the report. With revenue of $980.4 million, EBITDA was only $45.0 million, indicating a sharp increase in operating costs.
The net margin also turned negative: -28.1% versus +29.7% a year earlier. This reflects not only operational issues but likely also one-off write-offs or financial expenses. However, without additional data, it is difficult to break down this decline into components.
Such a strong margin compression casts doubt on the sustainability of the business model under current conditions. If costs cannot be brought under control, the company may face further pressure on profit and cash flow.
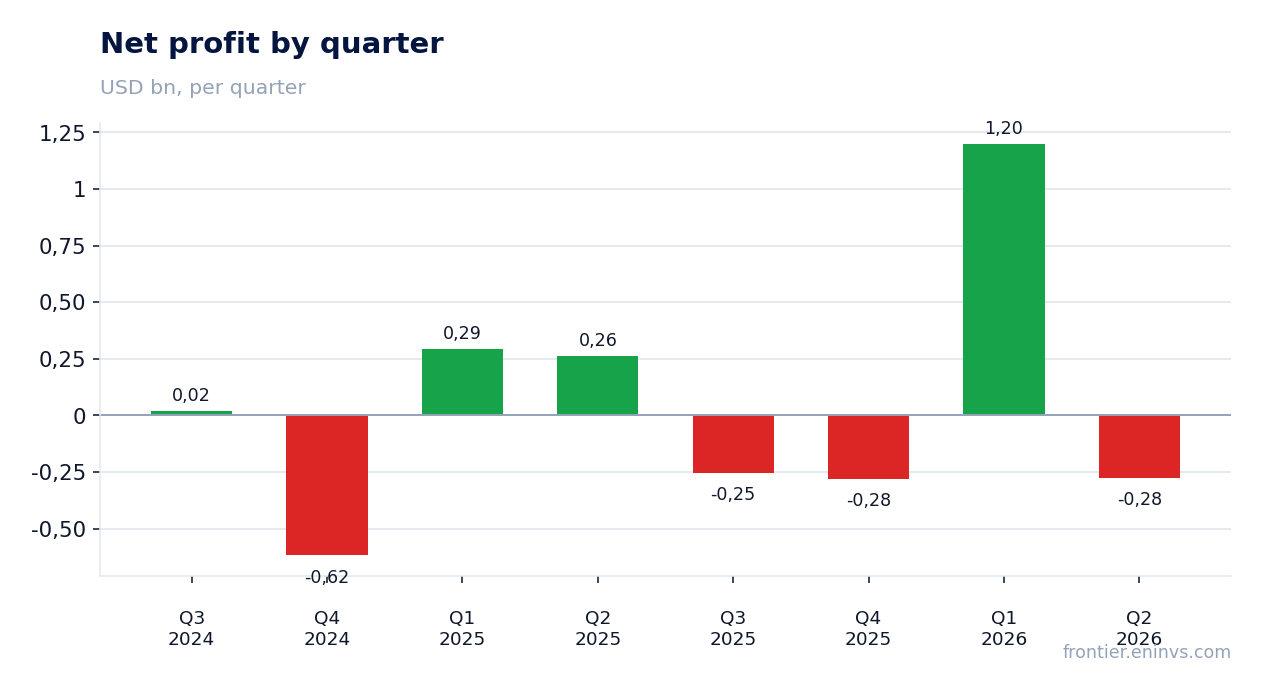
Net loss of $275.8 million versus a profit a year earlier — a $539 million swing
Azul's net loss in Q2 2026 was $275.8 million, compared to a profit of $263.3 million a year earlier. The $539 million swing is a dramatic deterioration. This occurred against the backdrop of falling EBITDA and possibly rising financial expenses or one-off write-offs.
In Q1 2026, the company posted a profit of $1,199.9 million, which was an abnormally high result. Such a surge could be related to one-off factors, and in Q2 there was a sharp reversal. This indicates instability in quarterly results.
Over the last 12 months, net profit was $389.3 million. However, this figure includes both a very strong Q1 2026 and losses in other quarters. Current dynamics indicate that sustainable profitability is not yet in place.
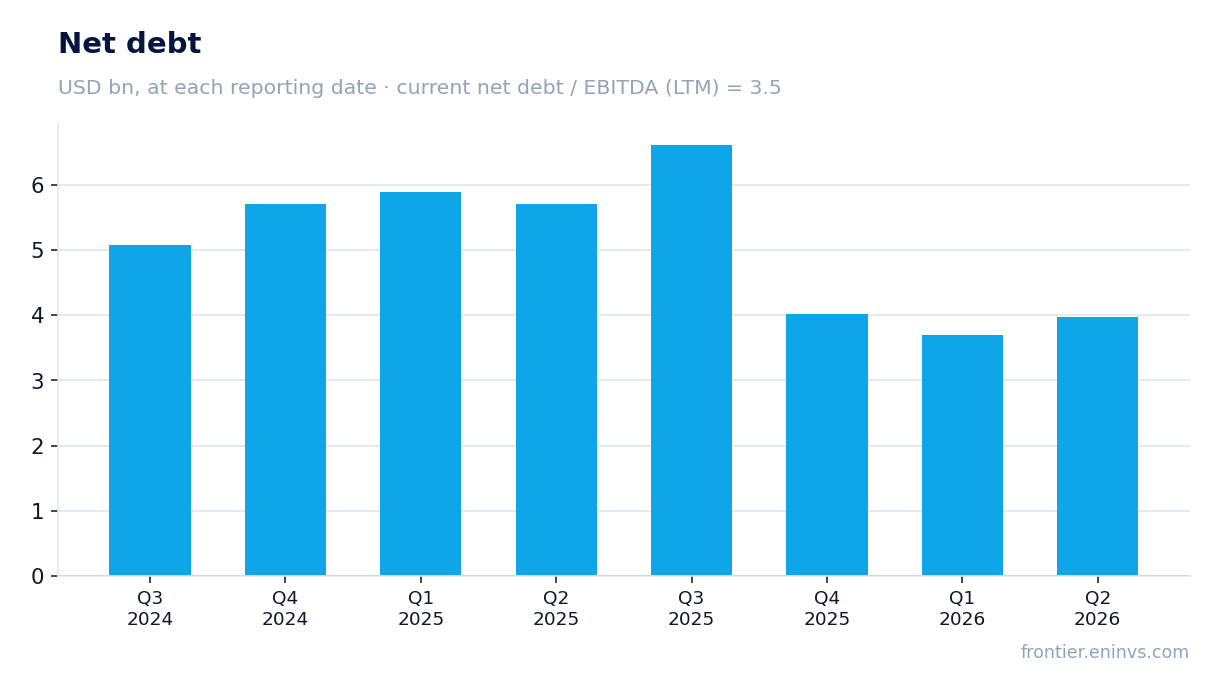
Leverage at 3.5x EBITDA with net debt of $6.36 billion — the level remains high
Azul's net debt at the latest reporting date was $6,362.4 million. The net debt to EBITDA ratio over the last 12 months is 3.5. This is a high level that limits the company's financial flexibility.
During the quarter, net debt increased by RUB 0.3 billion, and over 12 months it decreased by RUB 1.7 billion. However, these changes are denominated in rubles, which complicates interpretation for a company reporting in dollars. In any case, the absolute debt level remains significant.
High leverage combined with falling EBITDA increases risks. If EBITDA does not recover, the ratio could rise, leading to pressure on credit metrics and potentially higher borrowing costs.
Operating cash flow is negative — minus $41.0 million for the quarter
Azul's operating cash flow in Q2 2026 was negative at minus $41.0 million. This means the company did not generate enough cash from core operations to cover its expenses. A year earlier, the figure was also negative at minus $12.2 million.
Negative operating cash flow combined with capital expenditures of $21.9 million led to a further outflow of funds. The company is forced to finance its activities through debt or other sources, increasing financial risks.
Over the last 12 months, operating cash flow was minus $225.1 million. This is a persistently negative figure, indicating a chronic lack of internal financing. Without improvement in operational efficiency, the company may face liquidity issues.
Over the last 12 months profit was $389.3 million, but quarterly dynamics are deteriorating
Over the last 12 months, Azul earned a net profit of $389.3 million on revenue of $4,200.0 million and EBITDA of $1,819.9 million. However, this profit was mainly generated in Q1 2026, when the company earned $1,199.9 million. Without that quarter, the result would have been a loss.
Quarterly dynamics show instability: over the last four quarters, there were both significant profits and losses. For example, in Q4 2025 the loss was $280.8 million, and in Q3 2025 it was $253.9 million. This indicates high volatility and possible one-off factors.
Investors should assess the sustainability of profit, not just annual figures. The current quarter showed a loss, and if this trend continues, annual profit could come under pressure.
On the portal's model, fair value is 6% below the current price — limited upside
According to our model, the fair value of Azul's shares is 6% below the current market price. This means the stock is trading at a slight premium to our estimate. The model takes into account EBITDA growth, a target multiple, and current market capitalisation.
Current multiples: P/E over the last 12 months is 8.3, EV/EBITDA is 5.3. Return on equity (ROE) is 124.9%, reflecting high profitability relative to equity, but this may be due to one-off factors or a low equity base.
Given the recent decline in EBITDA and the Q2 loss, the current valuation may not fully reflect increased risks. If profit does not recover, the multiples may look less attractive.
Valuation on the latest reported figures
| Metric | Value |
|---|---|
| Market cap | 3.24 bn USD |
| P/E (LTM) | 8.3 |
| EV/EBITDA (LTM) | 5.3 |
| Net debt / EBITDA (LTM) | 3.50 |
| Operating cash flow (LTM) | -0.23 bn |
| ROE | 124.9% |
Bottom line
Bottom line: in Q2 2026, Azul showed revenue growth of 10.6%, but this did not prevent a sharp 65.5% drop in EBITDA and a net loss of $275.8 million. Margins compressed, operating cash flow remains negative, and leverage stands at 3.5x EBITDA. Over the last 12 months, profit was $389.3 million, but it was mainly driven by Q1, and the sustainability of that result is questionable. On our model, fair value is 6% below the current price, leaving no room for upside. The key question for a holder now is whether the company can restore margins and generate positive cash flow, or whether pressure on profit will persist.
Open the company's financial profile AZUL →
See also: market overview · valuation map · stock screeners