Assai: profit up 2.4x, but margin, not revenue, did all the work
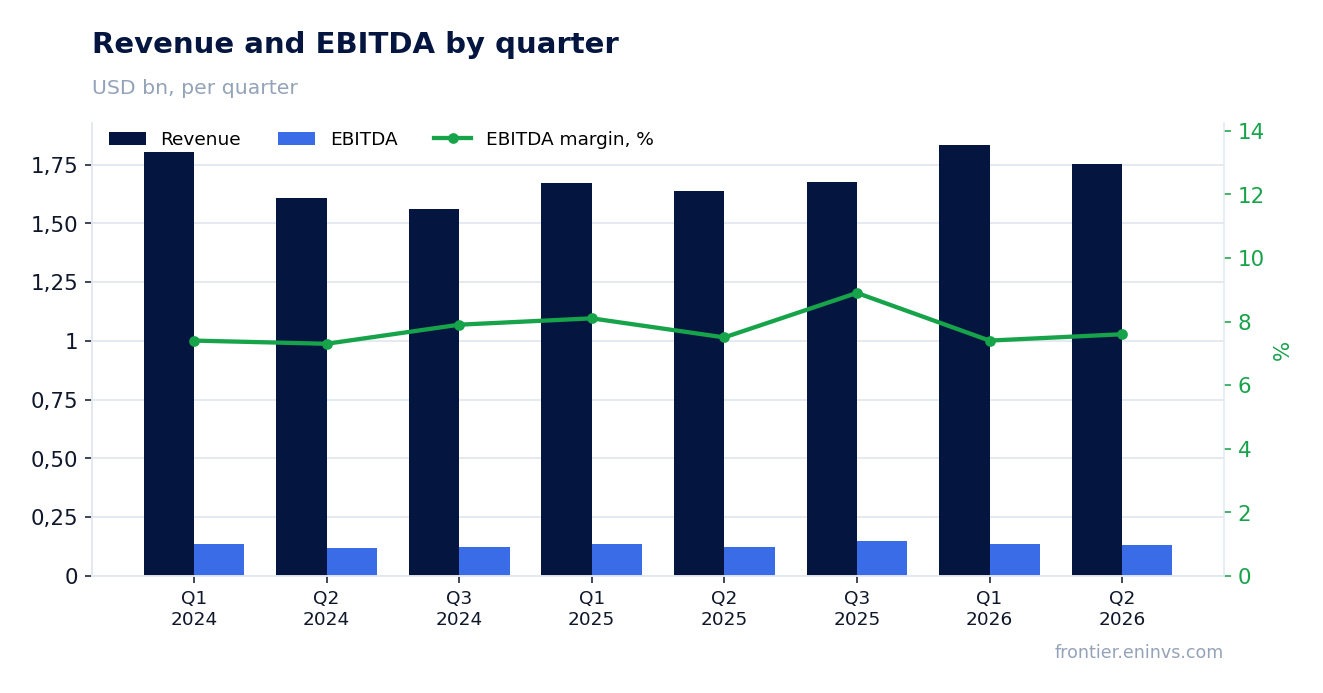
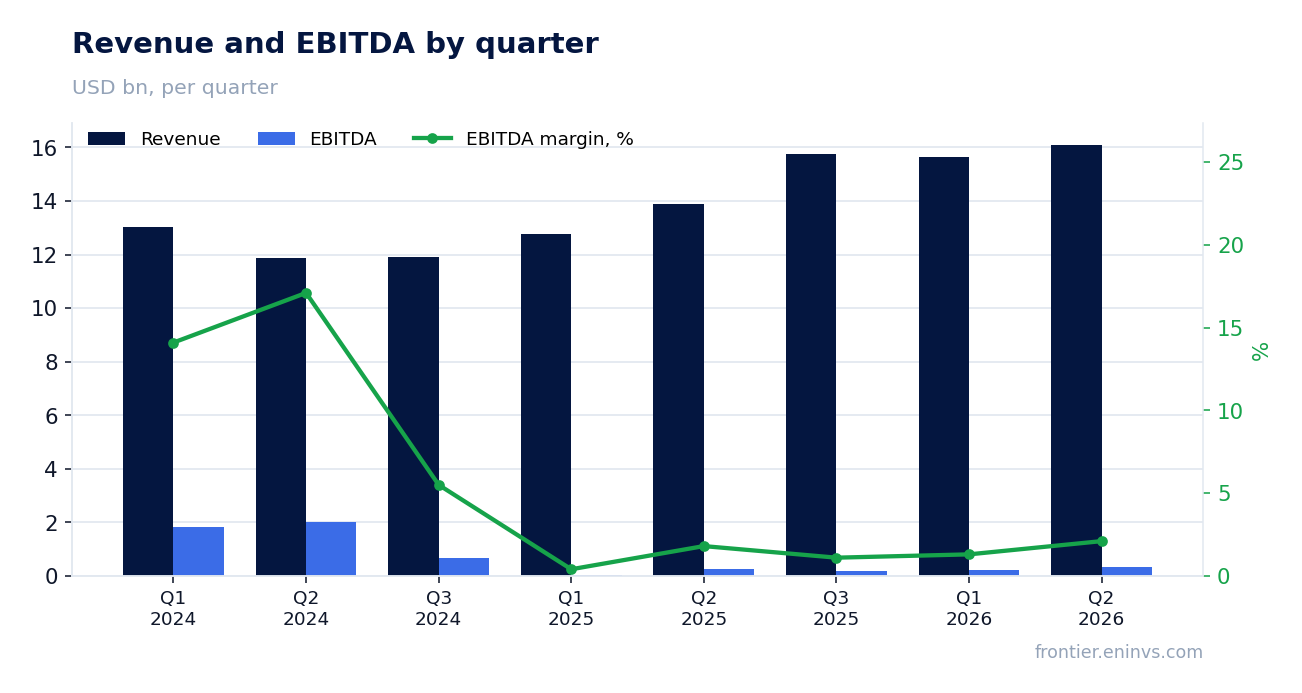
ASAI →Assai reported second-quarter 2026 results. Revenue rose 10.8% year on year to $3,776.0 million, EBITDA by 42.3% to $364.9 million and net profit by 142.6% to $95.3 million. The EBITDA margin climbed to 9.7% from 7.5%, and the net margin to 2.5% from 1.2%. At an EV/EBITDA of 4.03 and a return on equity of 31.5%, the share looks attractive: profit is growing faster than revenue, and leverage at 1.74x LTM EBITDA remains moderate.
Key takeaways
— Revenue added 10.8% year on year, but margin, not volume, delivered almost all of the profit gain
— EBITDA rose 42.3% on 10.8% revenue growth – costs lagged sales
— Net profit rose 2.4x to $95.3 million, and this is not a one-off
— Operating cash flow of $294.0 million against capex of just $23.4 million – cash stays in the business
— Leverage at 1.74x LTM EBITDA is moderate, but net debt barely moved over the quarter
— EV/EBITDA of 4.03 and ROE of 31.5% – the market values the improving margin modestly
— On the portal's model the share trades 13% below fair value
Attractiveness
Key figures, USD bn
| Metric | Q2 2025 | Q2 2026 | Change |
|---|---|---|---|
| Revenue | 3.41 | 3.78 | +10.8% |
| EBITDA | 0.26 | 0.36 | +42.3% |
| Operating profit | 0.18 | 0.27 | +53.6% |
| Net profit | 0.04 | 0.10 | +142.6% |
| Operating cash flow | 0.18 | 0.29 | +66.2% |
| Capex | 0.03 | 0.02 | -28.6% |
| EBITDA margin | 7.5% | 9.7% | +2.2 pp |
| Net margin | 1.2% | 2.5% | +1.3 pp |
Revenue added 10.8% year on year, but margin, not volume, delivered almost all of the profit gain
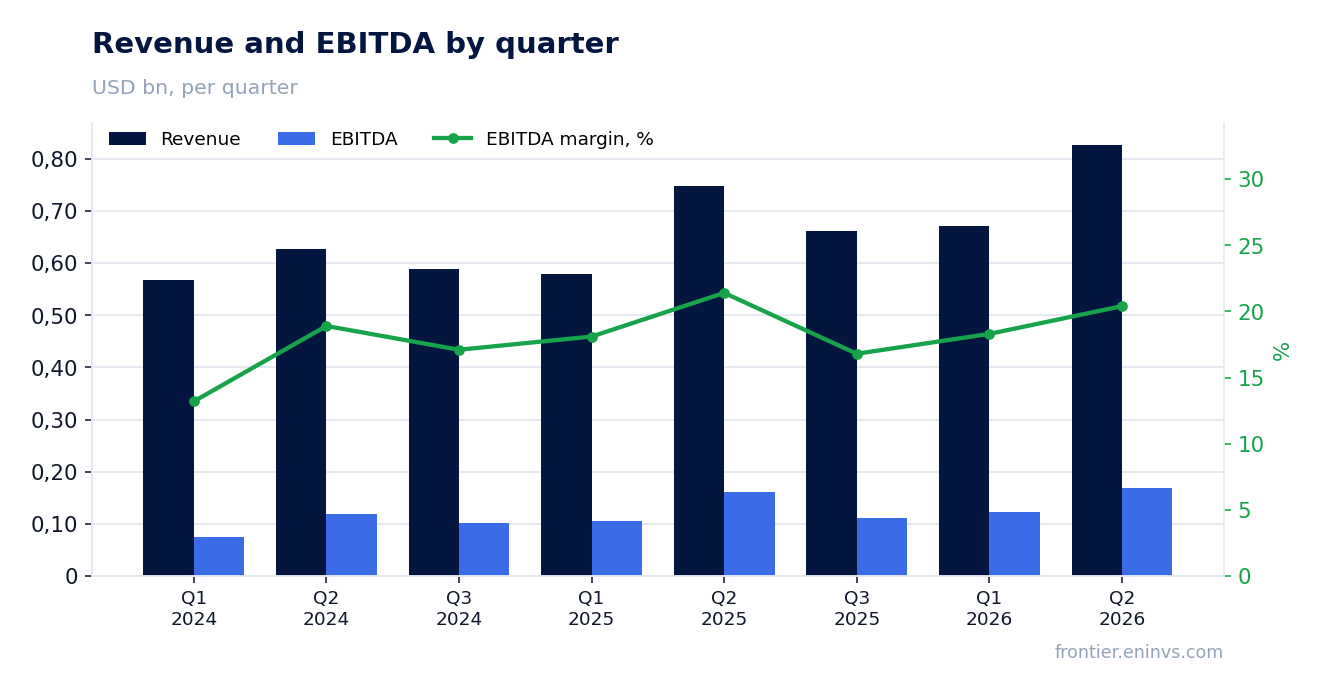
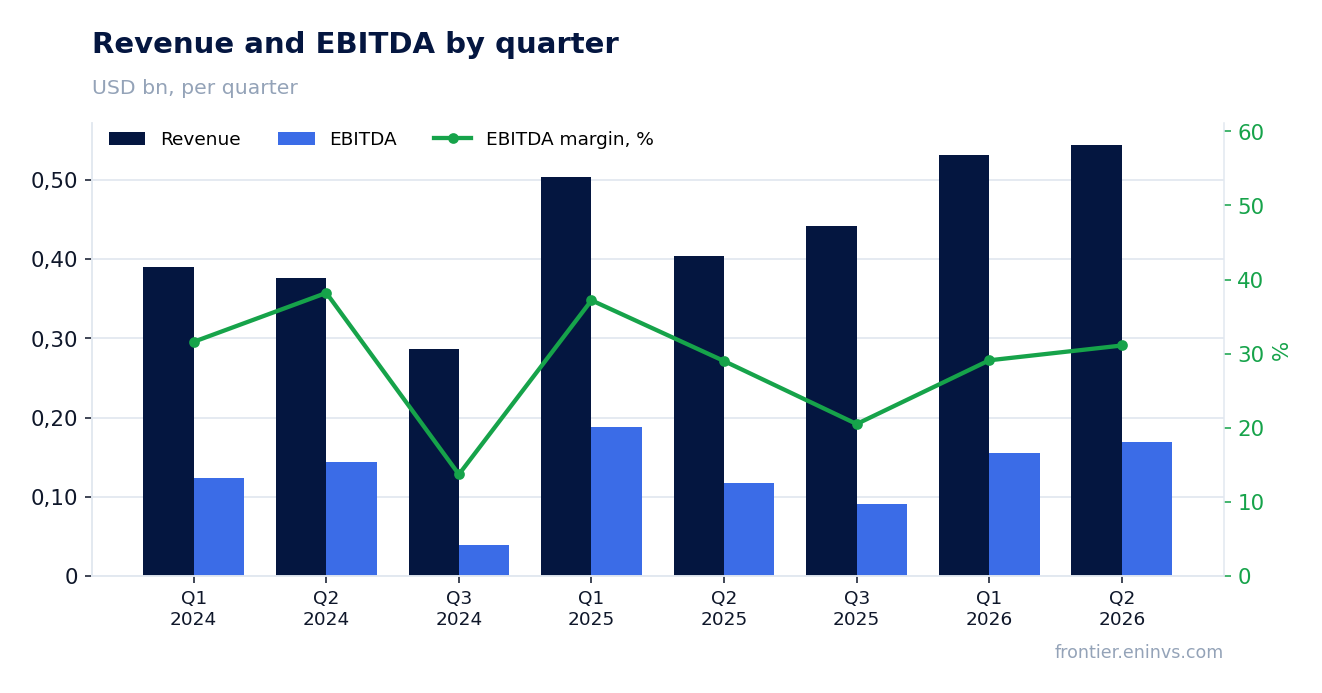
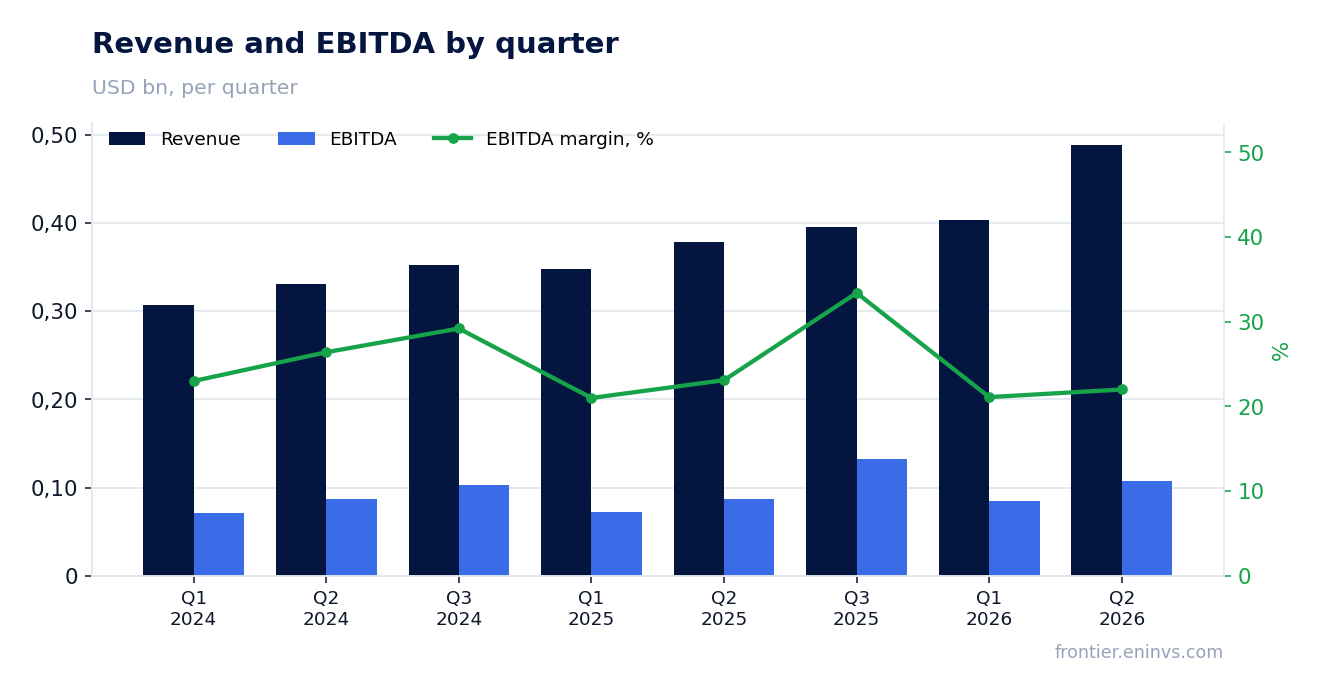
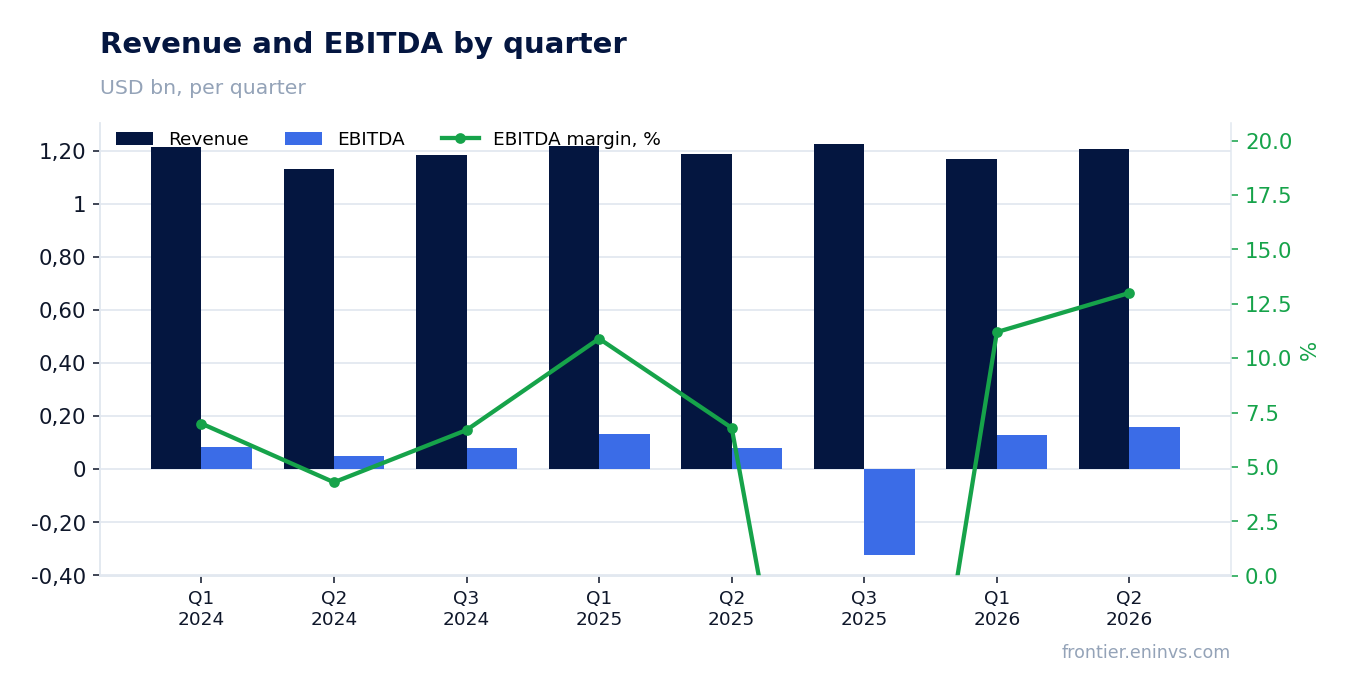
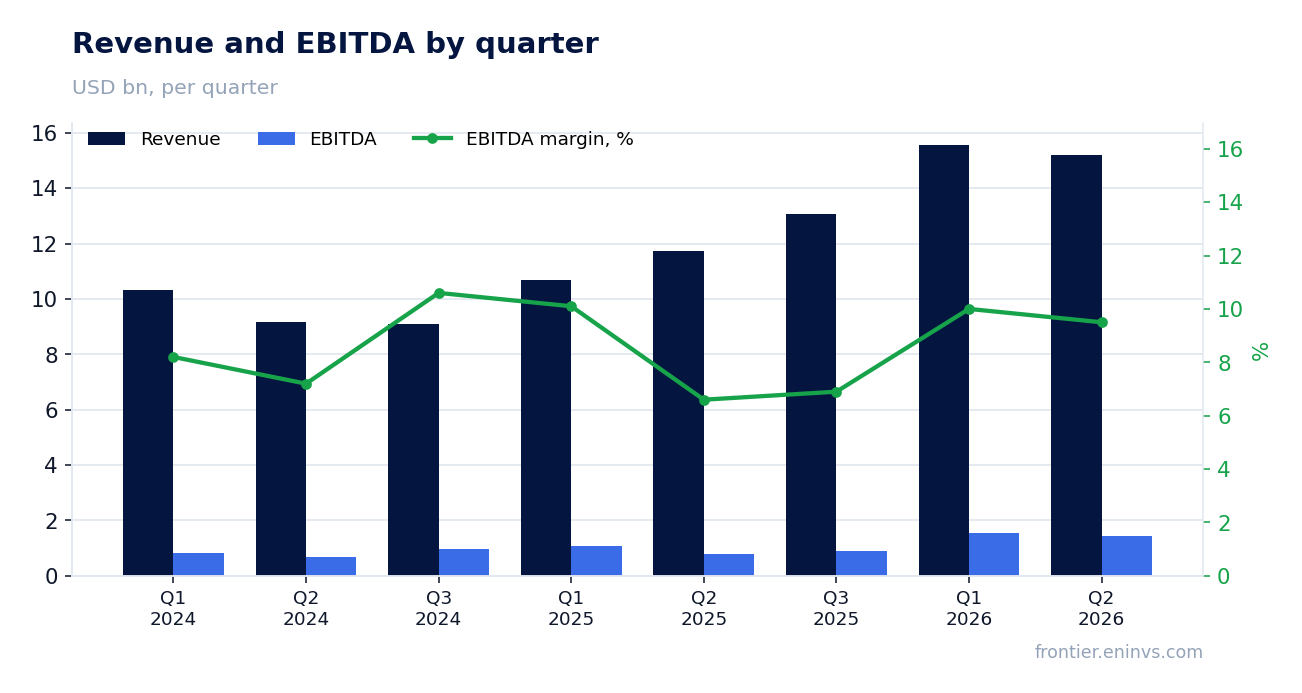
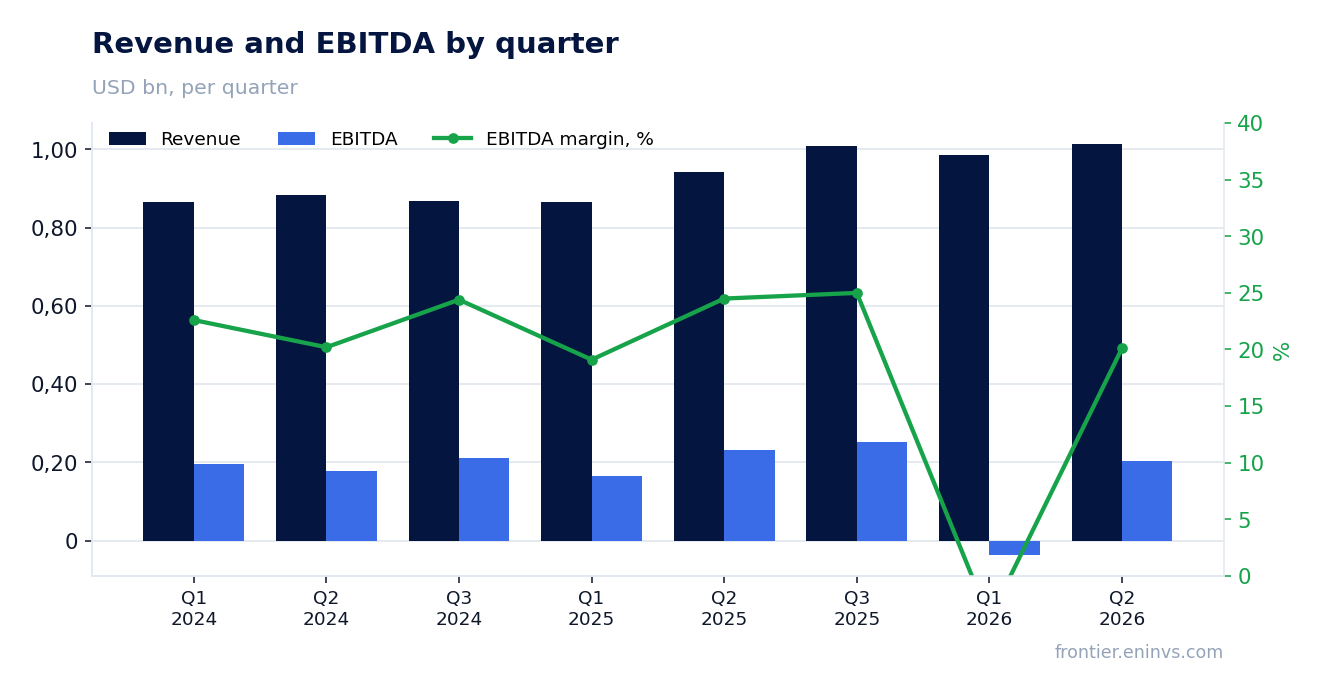
Second-quarter 2026 revenue came in at $3,776.0 million, up 10.8% from a year earlier. This extends the acceleration: growth was 12.5% in the first quarter, 9.3% in the fourth quarter of 2025 and 7.0% in the second quarter of 2025. The company has now grown sales at above 9% for three consecutive quarters.
Profit, however, was driven mainly by margin rather than revenue. With sales up 10.8%, EBITDA rose 42.3% and net profit 142.6%. That means costs grew far more slowly than revenue, and improved operating efficiency, not volume, determined the quarter's result.
For an investor this is an important signal: the business is scaling, but the main profit lever right now is cost control. If revenue growth slows, the margin effect may weaken, and profit growth would then lag.
EBITDA rose 42.3% on 10.8% revenue growth – costs lagged sales
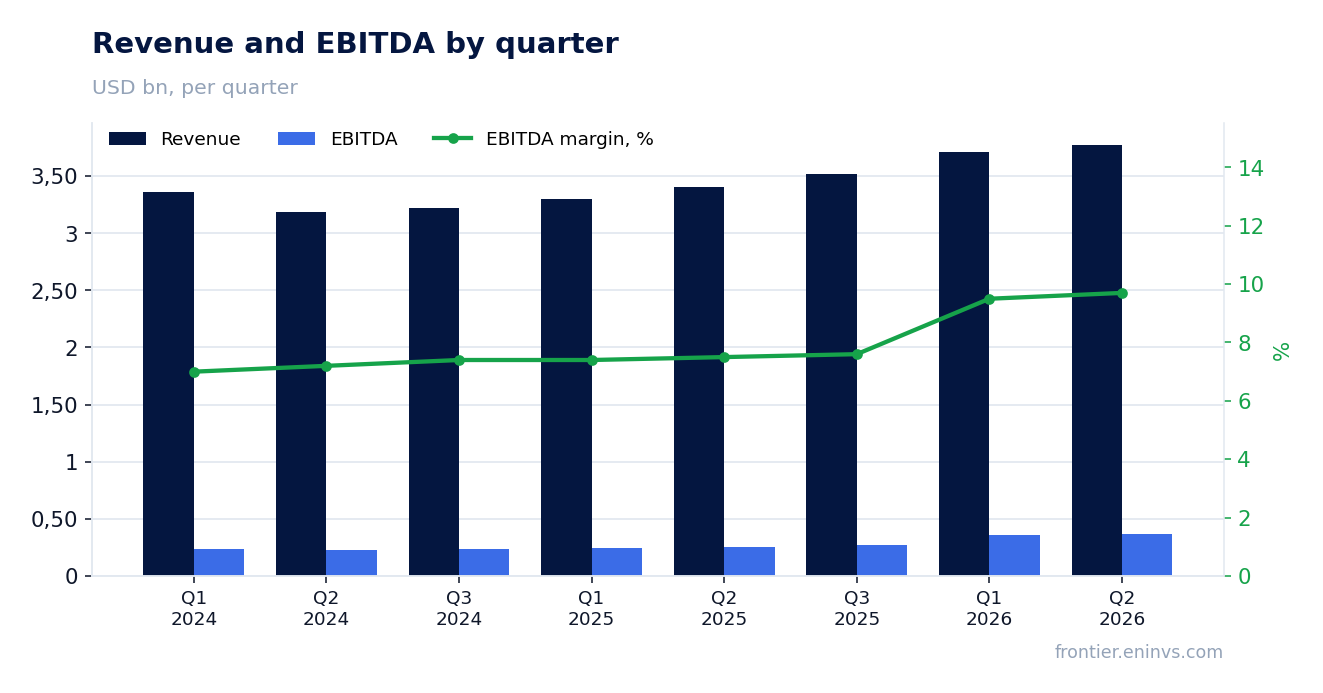
Second-quarter 2026 EBITDA was $364.9 million versus $256.5 million a year earlier. Growth of 42.3% on a 10.8% revenue increase means operating costs rose only slightly. This is the classic operating-leverage effect: fixed costs spread over a larger sales base.
The EBITDA margin rose to 9.7% from 7.5% a year earlier. That is a 2.2 percentage-point improvement – a significant shift for a company with billions in revenue. Operating profit rose to $273.5 million, confirming that the improvement is at the core operating level, not from financial items.
The sustainability of this improvement is the key question. If the margin gain comes from temporary cost savings, the effect may be one-off. But if the company has genuinely improved efficiency, it creates a basis for further profit growth even with moderate revenue growth.
Net profit rose 2.4x to $95.3 million, and this is not a one-off
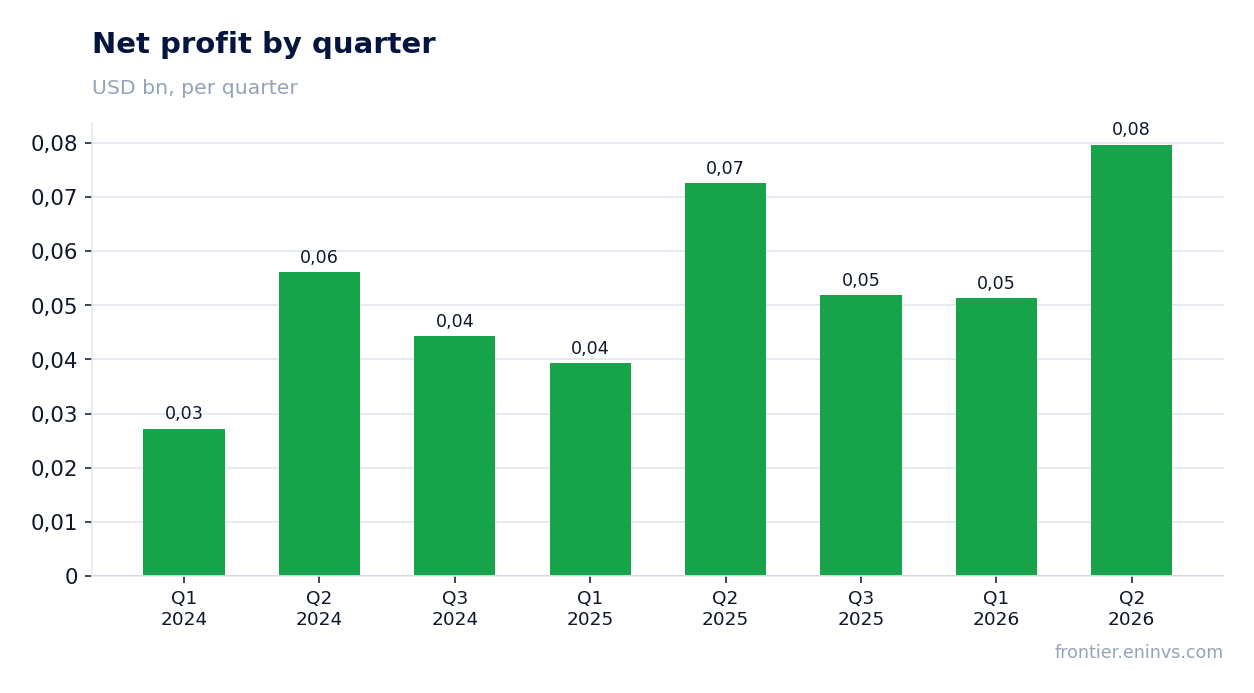
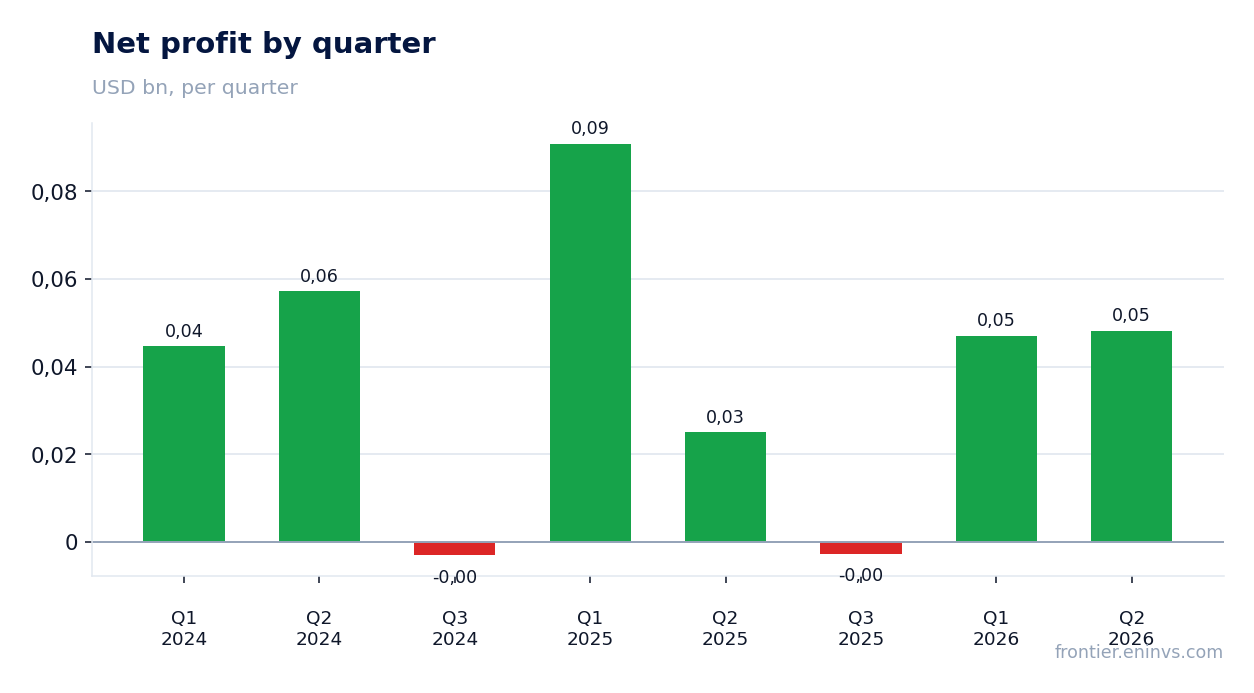
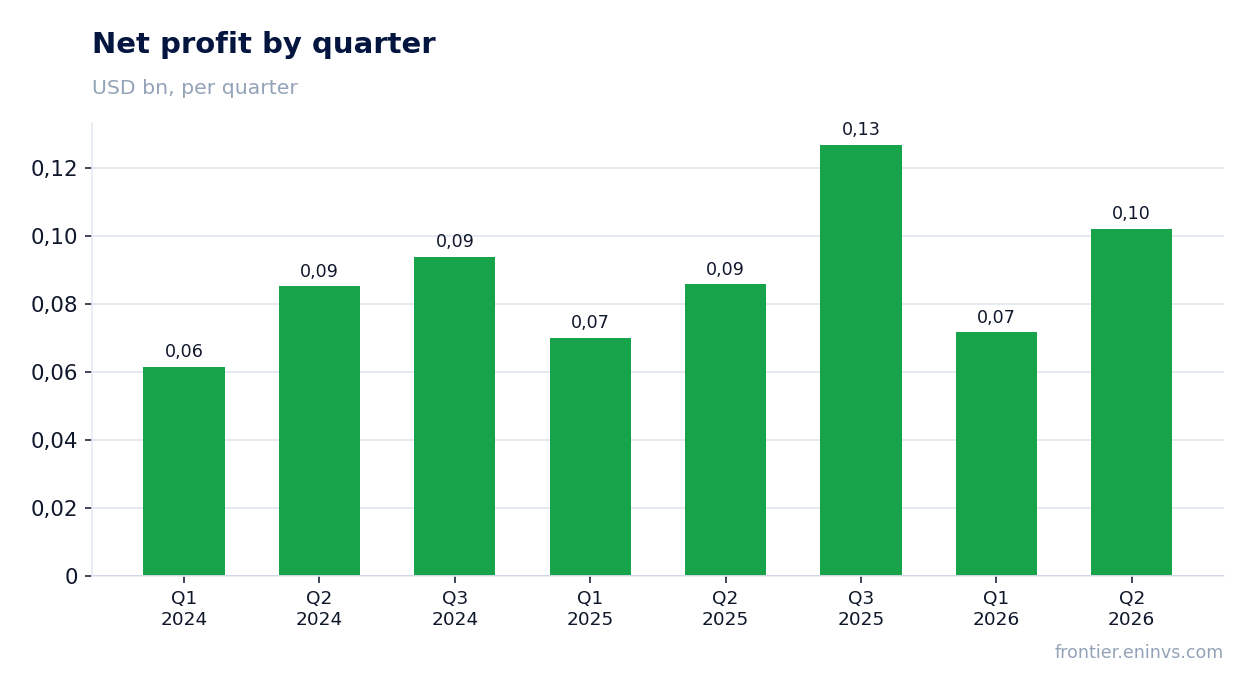
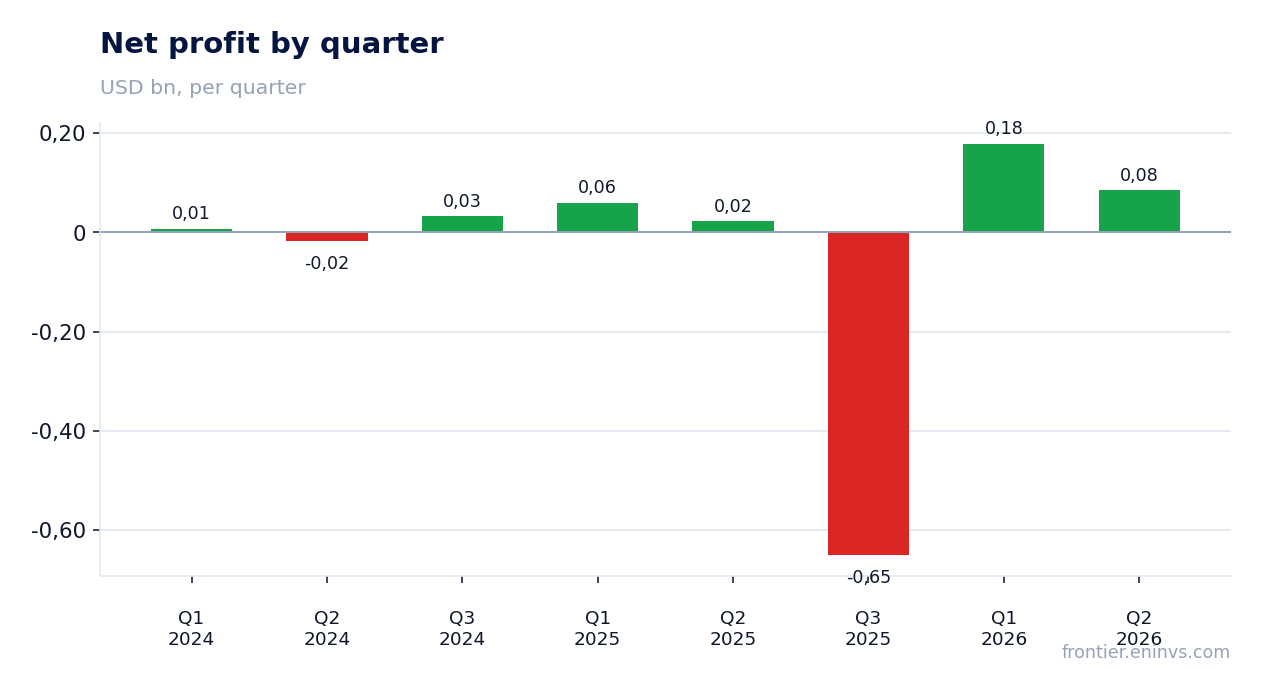
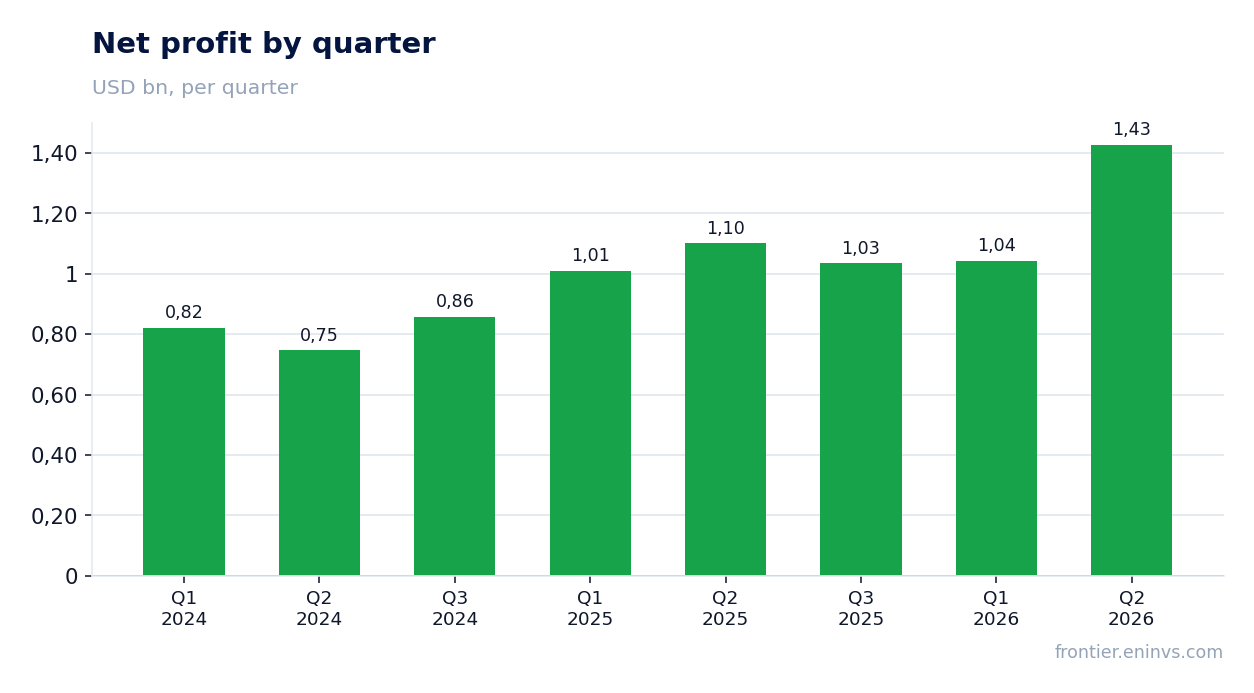
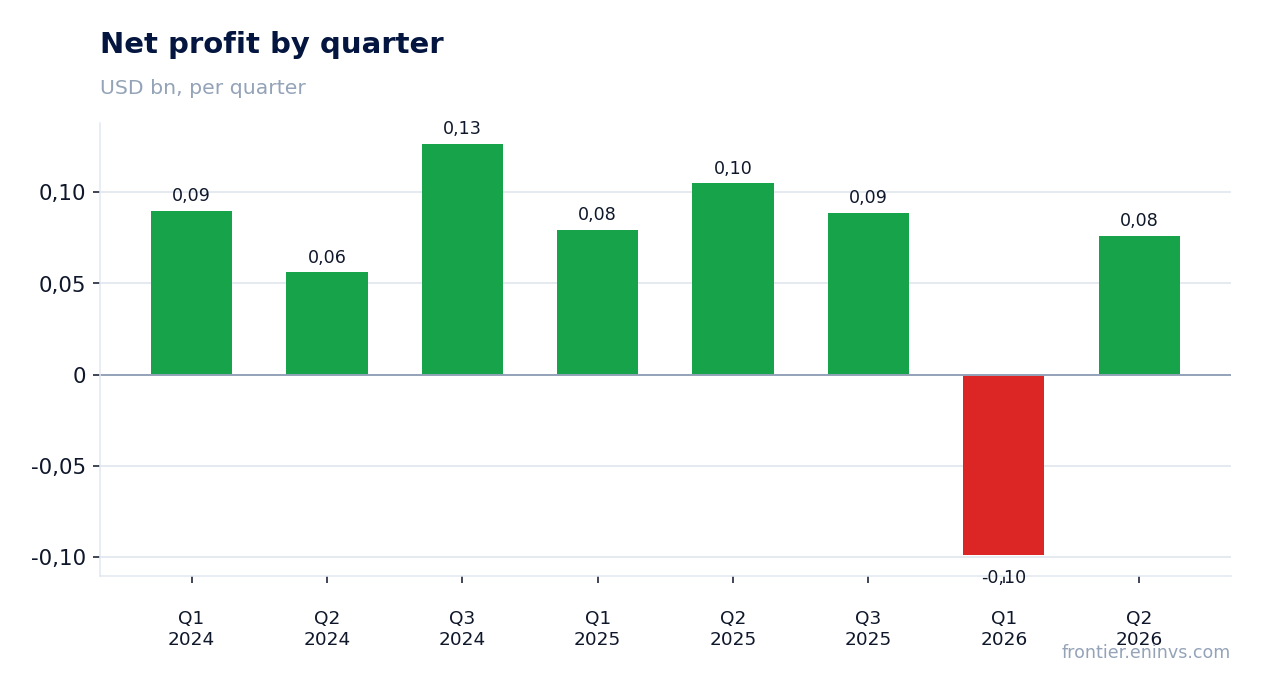
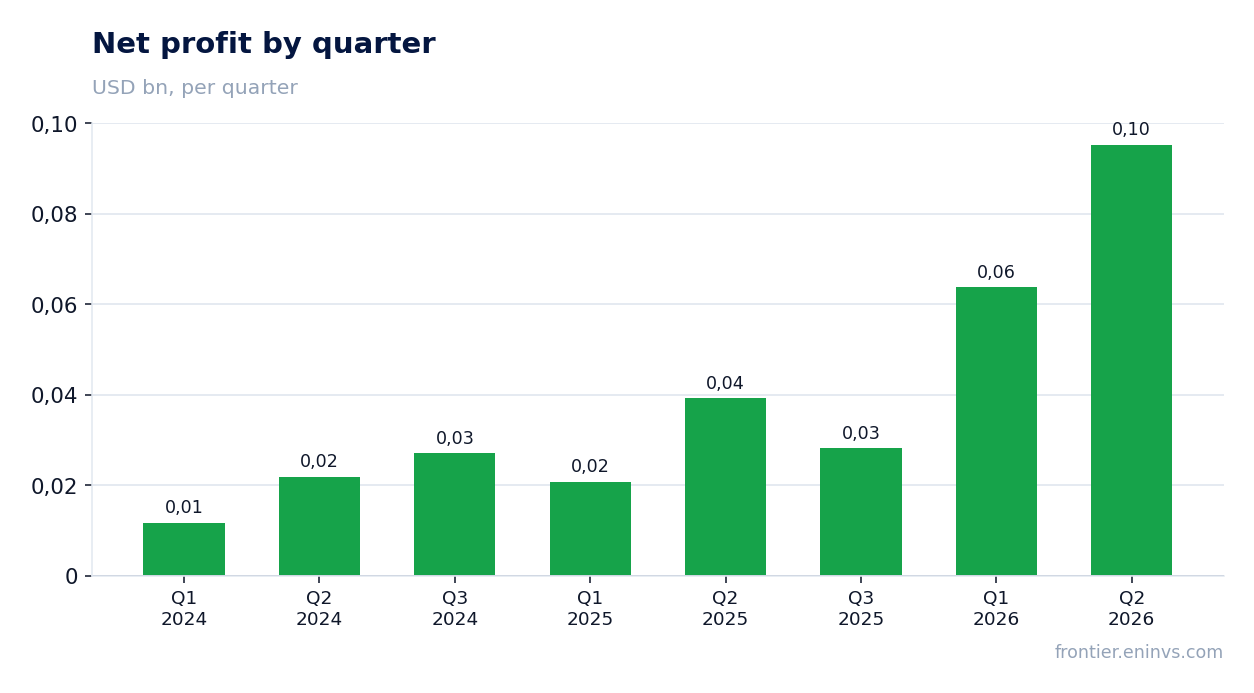
Second-quarter 2026 net profit was $95.3 million, up 142.6% from $39.3 million a year earlier. The 2.4x increase is not from one-off items but from operating improvement: EBITDA rose 42.3%, and the net margin climbed to 2.5% from 1.2%.
The gap between EBITDA growth (42.3%) and net profit growth (142.6%) reflects financial leverage: with moderate debt, growth in operating profit disproportionately boosts profit after interest. This enhances the appeal of the share but also increases sensitivity to borrowing costs.
A net margin of 2.5% is still low, leaving room for further improvement. If the company sustains current operating efficiency, profit can continue to outpace revenue in coming quarters.
Operating cash flow of $294.0 million against capex of just $23.4 million – cash stays in the business
Second-quarter 2026 operating cash flow was $294.0 million, well above the $176.8 million a year earlier. Capital expenditure was minimal at $23.4 million. Free cash flow thus exceeded $270 million, covering both interest and potential dividends.
The low level of capital expenditure is an important feature of the business. The company does not require heavy investment to sustain growth, allowing almost all operating cash flow to go toward debt reduction or shareholder returns. This sets Assai apart from capital-intensive industries.
Over the trailing twelve months, operating cash flow was $1,000.0 million. If current dynamics persist, the company can generate significant free cash flow, reducing risks and supporting valuation.
Leverage at 1.74x LTM EBITDA is moderate, but net debt barely moved over the quarter
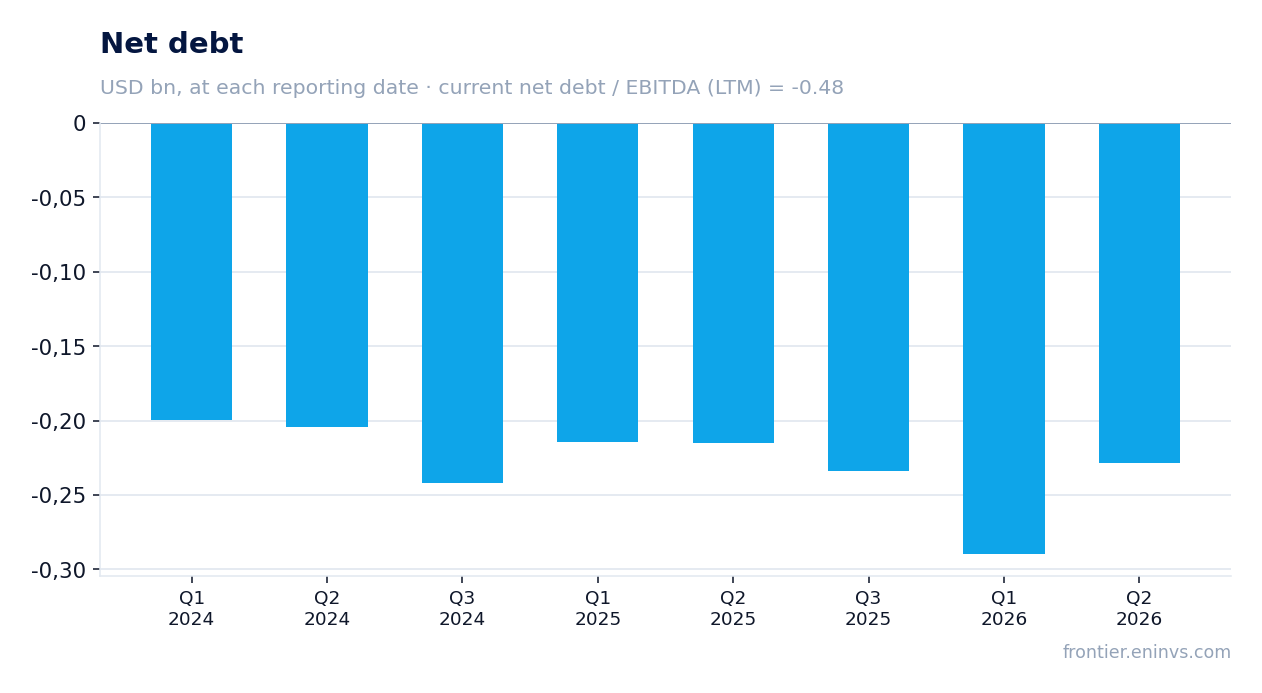
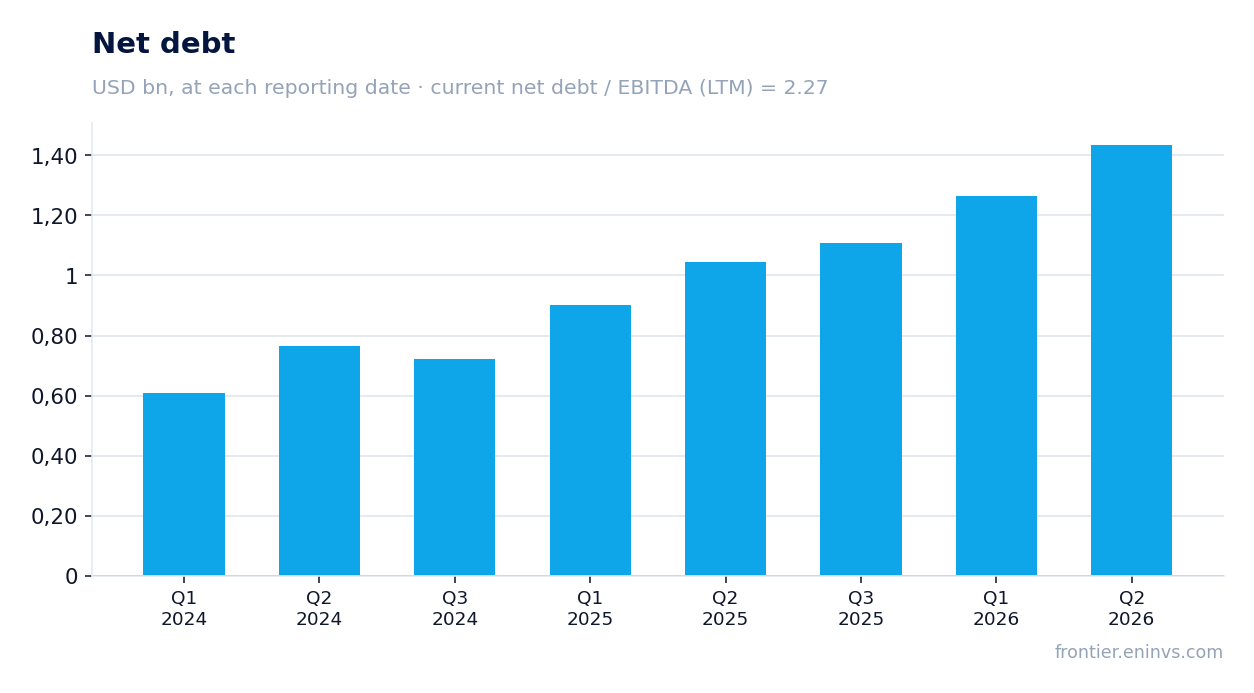
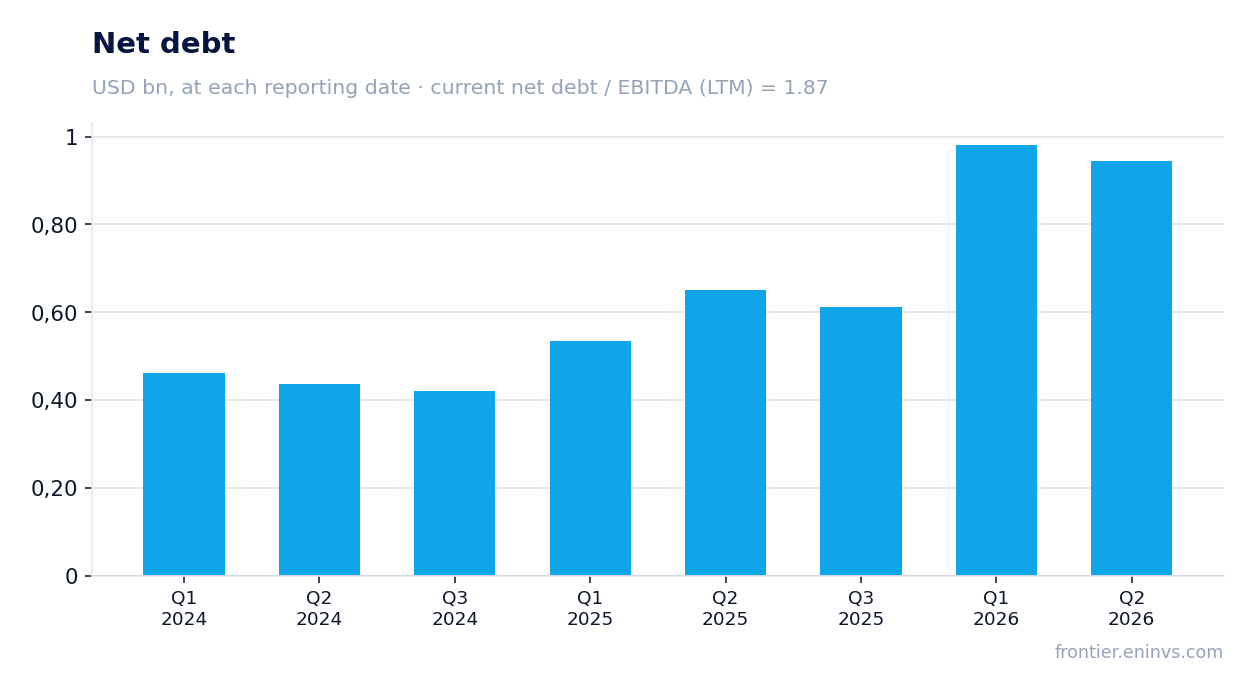
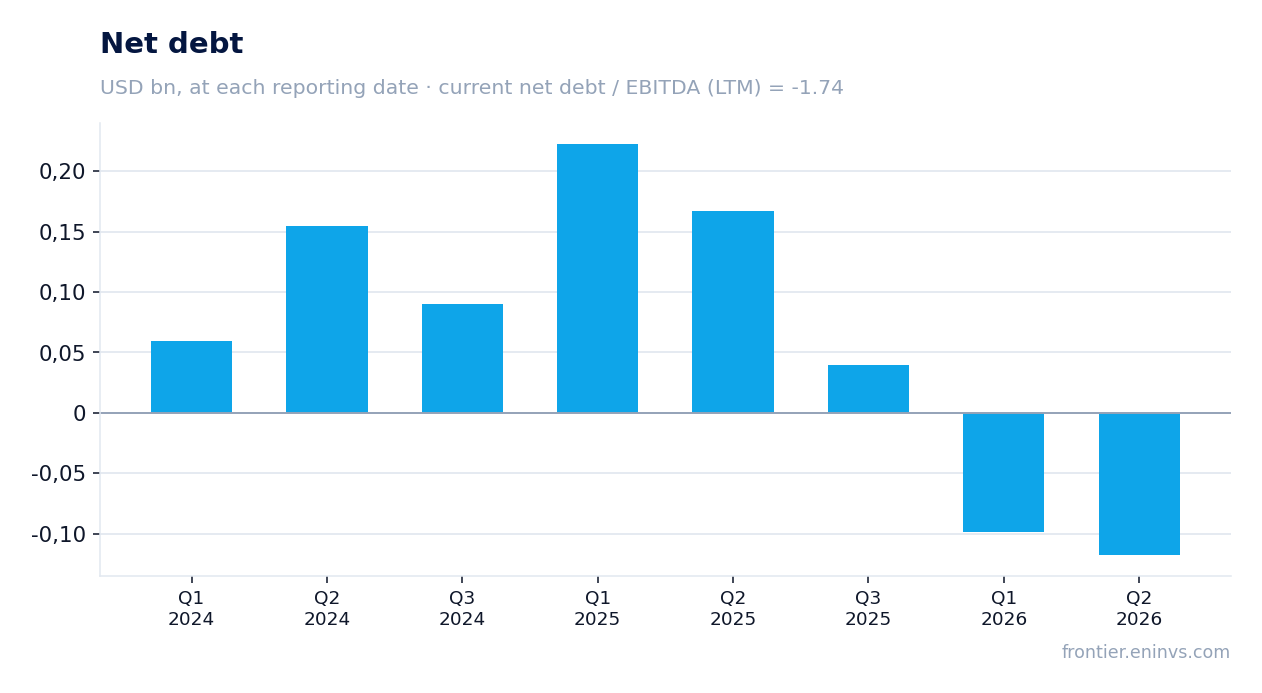
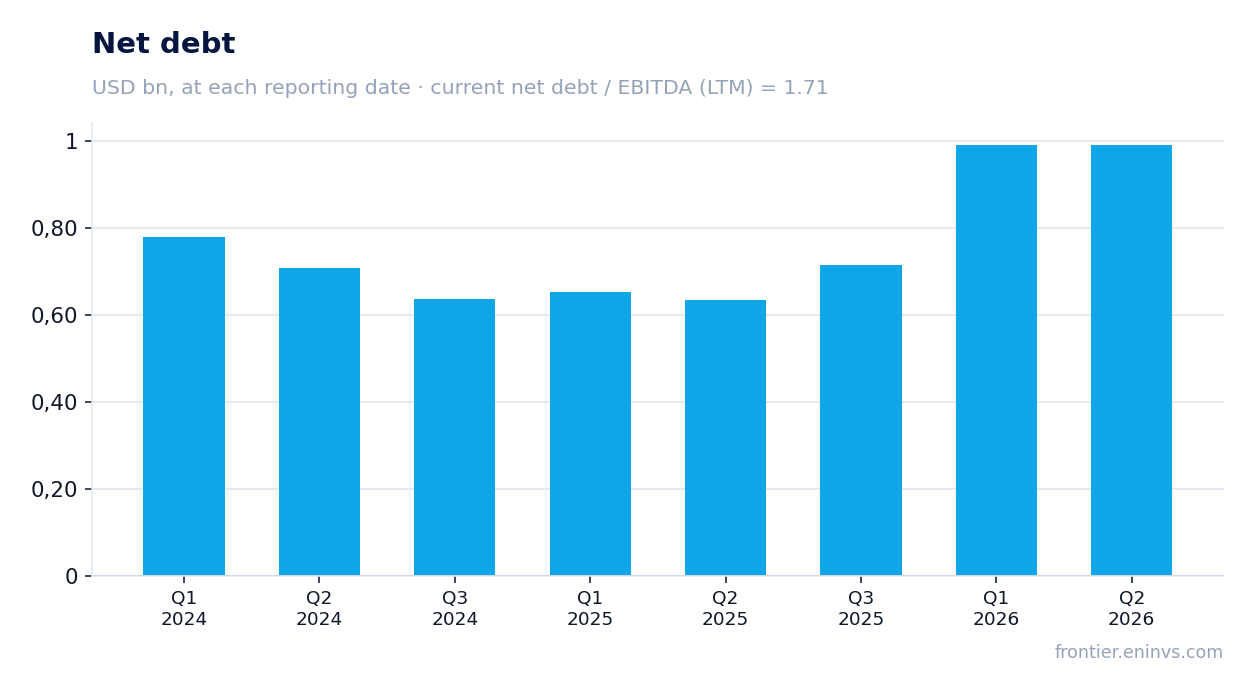
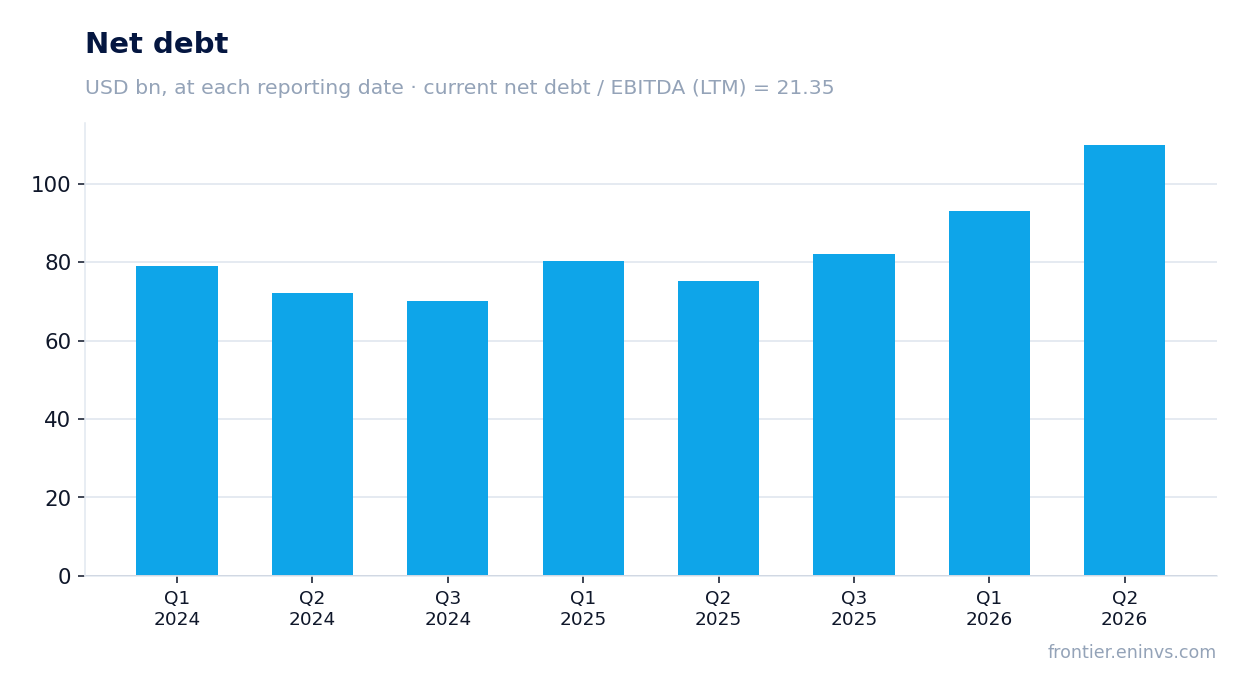
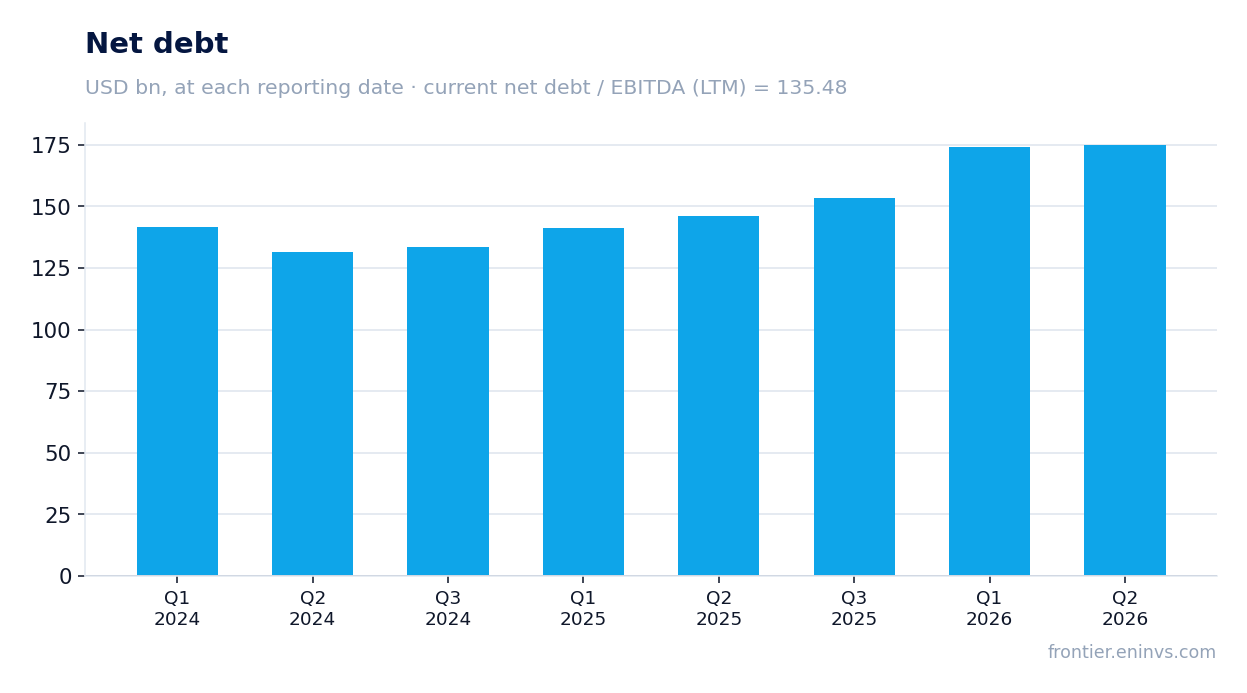
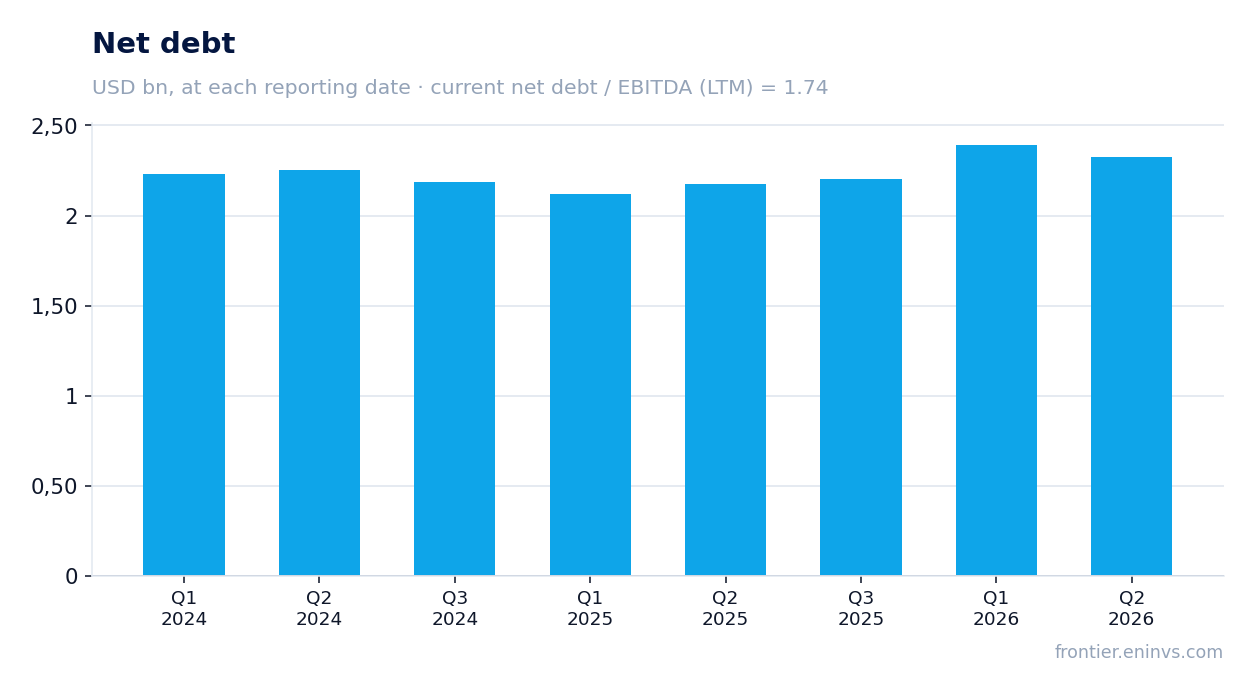
Net debt at the latest reporting date was $1,907.3 million, and the ratio of net debt to trailing-twelve-month EBITDA was 1.74. This is a moderate level: the company services its debt without strain, and interest payments are comfortably covered by operating profit.
Net debt barely changed over the quarter: down 0.1 billion rubles, and up 0.1 billion rubles over 12 months. This means the company is not increasing debt to fund growth, and operating cash flow covers current needs. At the same time, absolute debt remains significant at $1.9 billion.
For an investor, not only the size of debt but also its cost matters. If interest rates rise, debt servicing could become more expensive, limiting net profit growth. However, the current leverage of 1.74x EBITDA provides a margin of safety.
EV/EBITDA of 4.03 and ROE of 31.5% – the market values the improving margin modestly
With a market capitalisation of $2,513.5 million and an EV/EBITDA of 4.03, Assai's share is valued cheaply relative to its own history. For a company growing EBITDA at 42.3% year on year and generating a 31.5% return on equity, such a multiple suggests the market either doubts the sustainability of the margin improvement or prices in high risks.
The LTM P/E is 13.2 – also moderate. The trailing twelve-month dividend yield is 1.08%, below the key rate, but for a growth company this is normal: profit is reinvested in development.
On the portal's model, the fair value of the share is 13% above the current price. This is our own estimate, based on EBITDA growth and a target multiple, not a market consensus. If the company sustains current growth rates, the share could realise this potential.
On the portal's model the share trades 13% below fair value
Our fundamental valuation model, based on EBITDA growth and a target multiple, puts the fair value of the share 13% above the current market price. This is not a return forecast or a recommendation, but a calculated benchmark showing how much the market undervalues the company at current growth rates.
The model is sensitive to two parameters: the sustainability of EBITDA growth and the multiple level. If EBITDA growth slows or the market revises its valuation downward, the upside may shrink. If the company continues to improve its margin, the gap between price and fair value will widen.
For an investor, this means the current price leaves room for growth, but realising that potential depends on confirmation of operating results in upcoming reports.
Valuation on the latest reported figures
| Metric | Value |
|---|---|
| Market cap | 2.51 bn USD |
| P/E (LTM) | 13.2 |
| EV/EBITDA (LTM) | 4.0 |
| P/B | 2.48 |
| Net debt / EBITDA (LTM) | 1.74 |
| Operating cash flow (LTM) | 1.00 bn |
| ROE | 31.5% |
| Dividend yield (12m) | 1.1% |
Bottom line
Assai delivered a strong quarter: revenue rose 10.8%, EBITDA 42.3% and net profit 2.4x. The main driver was not sales volume but margin improvement: the EBITDA margin climbed to 9.7% from 7.5%. Operating cash flow of $294.0 million against capex of $23.4 million confirms the business generates cash. Leverage at 1.74x LTM EBITDA remains moderate. At an EV/EBITDA of 4.03 and ROE of 31.5%, the share looks attractive, and the portal's model points to 13% upside. The question for a holder is whether the margin holds at the new level in coming quarters.