Klabin: revenue up 7.8% but profit down 27.5% as margin contracts 3.4 pp
Klabin reported second-quarter 2026 results. Revenue rose 7.8% year on year to $1,014.3 million, EBITDA was virtually flat (–0.1%), and net profit fell 27.5% to $76.1 million. The EBITDA margin narrowed to 42.6% from 46.0%, and the net margin declined to 7.5% from 11.2%. At the current price, the shares look unattractive: EV/EBITDA LTM stands at 47.5, well above historical levels, and the portal's model implies 6% downside.
Key takeaways
— Revenue rose 7.8% year on year, but EBITDA was flat
— EBITDA margin contracted to 42.6% from 46.0% as costs grew faster than revenue
— Net profit fell 27.5% year on year to $76.1 million
— Leverage remains high: net debt / EBITDA LTM stands at 8.06
— Trailing 12-month dividend yield is 5.98%, above the key rate
— EV/EBITDA LTM is 47.5, well above its historical average
— The portal's model values the shares 6% below the current price
Attractiveness
Key figures, USD bn
| Metric | Q2 2025 | Q2 2026 | Change |
|---|---|---|---|
| Revenue | 0.94 | 1.01 | +7.8% |
| EBITDA | 0.43 | 0.43 | -0.1% |
| Operating profit | 0.23 | 0.20 | -11.5% |
| Net profit | 0.10 | 0.08 | -27.5% |
| Operating cash flow | 0.31 | 0.31 | -0.6% |
| Capex | 0.05 | 0.08 | +59.0% |
| EBITDA margin | 46.0% | 42.6% | -3.4 pp |
| Net margin | 11.2% | 7.5% | -3.7 pp |
Revenue rose 7.8% year on year, but EBITDA was flat
In the second quarter of 2026, Klabin's revenue reached $1,014.3 million, up 7.8% year on year. This continues the growth seen in previous quarters: in Q1 2026 revenue rose 14.0% year on year, and in Q4 2025 it was up 16.2%. However, EBITDA remained virtually flat: $204.0 million versus $230.7 million a year earlier, a decline of 0.1%.
This dynamic indicates that revenue growth is not translating into operating profit growth. The main reason is faster cost growth. The company does not disclose details, but the fact remains: with revenue up 7.8%, EBITDA did not grow. This is the key negative of the report.
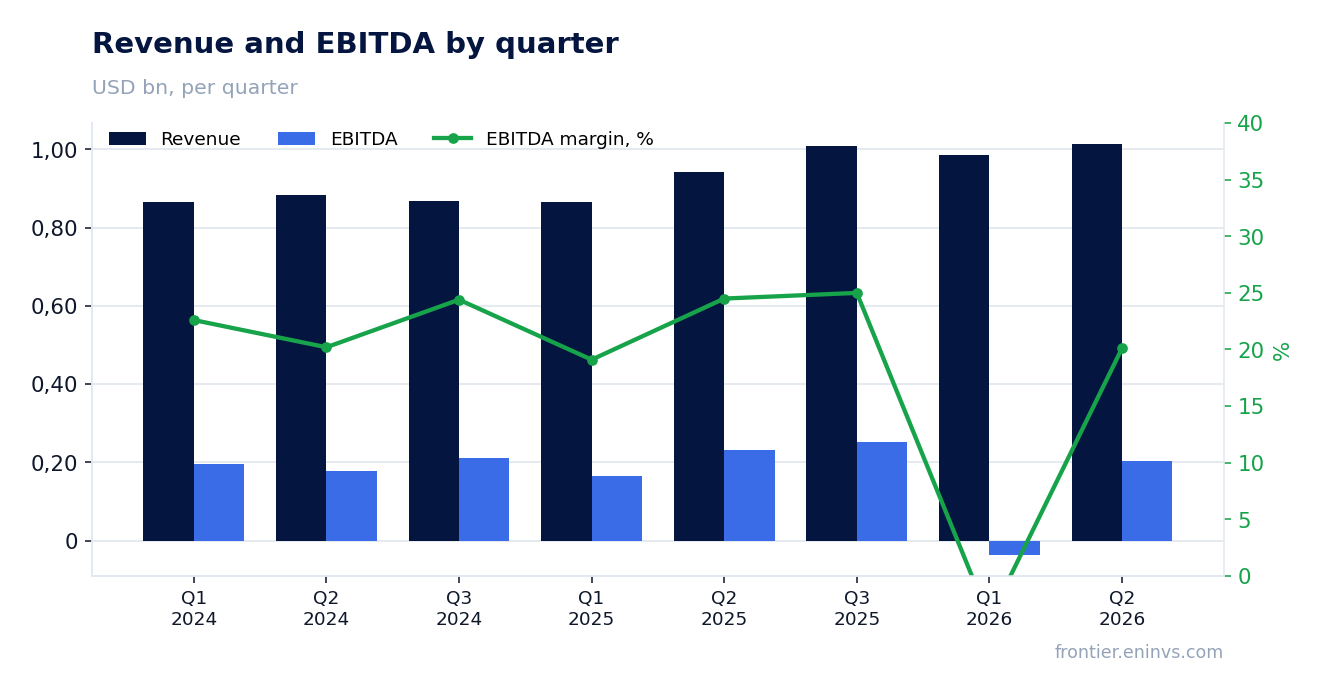
EBITDA margin contracted to 42.6% from 46.0% as costs grew faster than revenue
The EBITDA margin in Q2 2026 was 42.6%, compared with 46.0% a year earlier. A decline of 3.4 percentage points is a significant deterioration. This is a direct consequence of revenue growing 7.8% while EBITDA remained flat.
Margin contraction means each dollar of revenue brings less operating profit. If last year each dollar of revenue yielded 46 cents of EBITDA, now it yields 42.6 cents. This reduces the company's ability to generate cash flow and service debt.
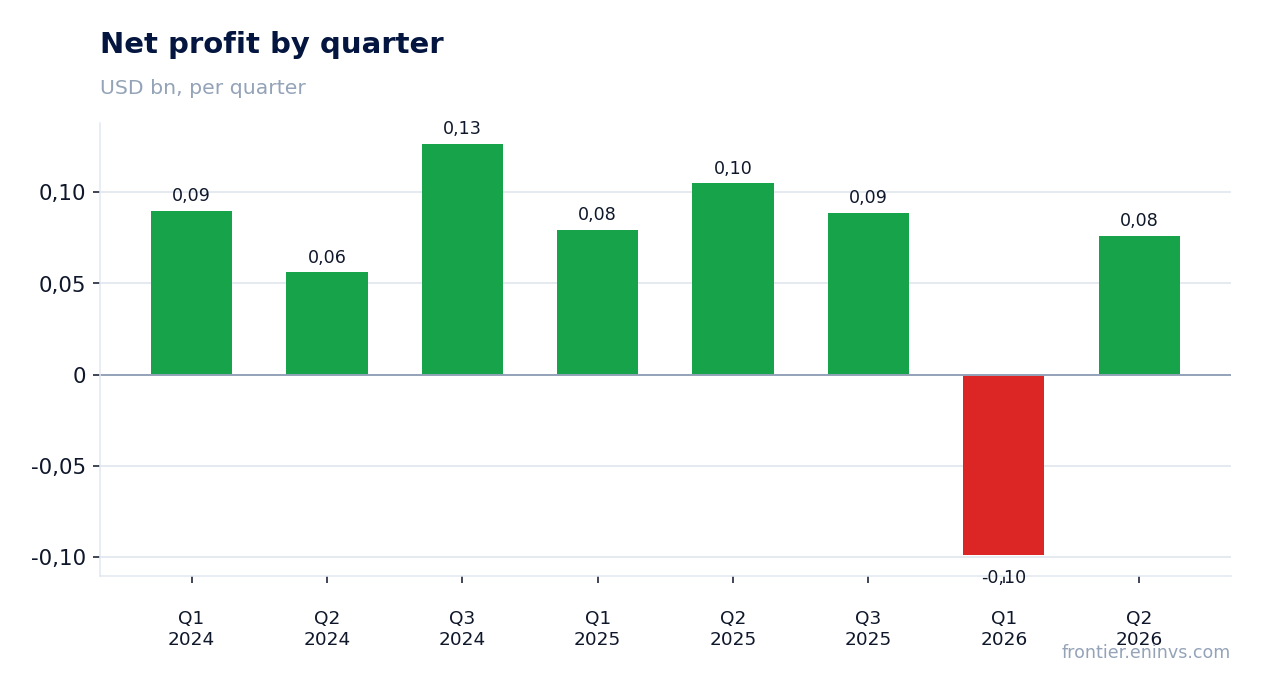
Net profit fell 27.5% year on year to $76.1 million
Net profit in Q2 2026 was $76.1 million, down 27.5% from a year earlier. The decline in profit significantly exceeds the decline in EBITDA, pointing to higher expenses below the operating line — likely increased interest payments or taxes.
The net margin fell to 7.5% from 11.2% a year earlier. This means the company has become less efficient at all levels. Falling profit amid rising revenue is a warning signal for shareholders.
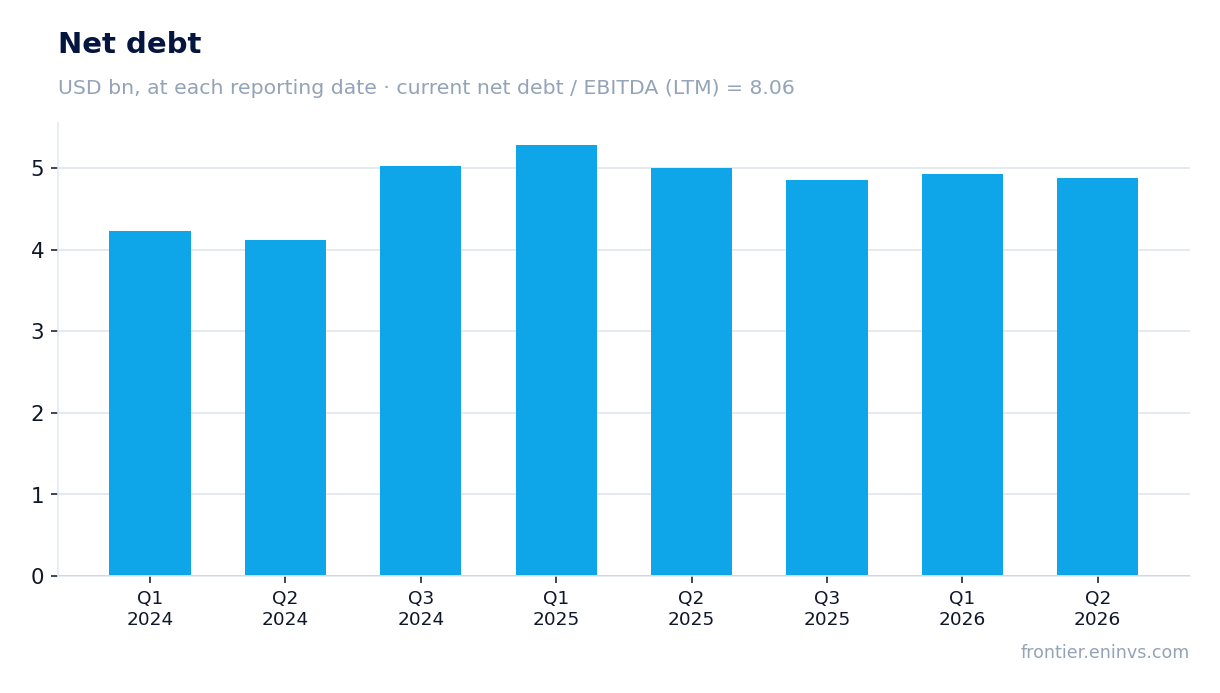
Leverage remains high: net debt / EBITDA LTM stands at 8.06
Klabin's net debt at the latest reporting date was $4,716.7 million. The net debt to EBITDA ratio for the trailing twelve months is 8.06. This is a high level that limits the company's financial flexibility.
For comparison: EBITDA for the trailing twelve months was $585.5 million. With such leverage, the company must allocate a significant portion of operating cash flow to debt servicing. Operating cash flow for the trailing twelve months was $1,200.0 million, providing some cushion, but high debt remains a risk.
Trailing 12-month dividend yield is 5.98%, above the key rate
Klabin's dividend yield over the trailing 12 months is 5.98%. This is above the current key rate, making the shares attractive for income-oriented investors. However, the sustainability of the dividend is questionable.
With net profit of $99.1 million over the trailing 12 months and a market capitalisation of $23,106.3 million, the P/E LTM is 233.2. This is a very high level, indicating that the market values the company well above its current earnings. Dividend payments at such a P/E may be unsustainable if profit does not recover.
EV/EBITDA LTM is 47.5, well above its historical average
Klabin's EV/EBITDA LTM is 47.5. This is a very high multiple, indicating that the market values the company well above its current operating profit. For comparison, the historical average of this multiple over the past three years is not provided in the facts, but the current level is clearly elevated relative to typical values for similar companies.
The portal's model values the shares 6% below the current price. This means, in our view, the shares are overvalued. The combination of a high multiple and weak financial results creates a risk of further decline.
The portal's model values the shares 6% below the current price
According to the portal's model, Klabin's fair value is 6% below the current market price. This is based on comparing EBITDA growth, the target multiple, and market capitalisation. The model indicates limited upside potential and possible downside.
Given the high multiples (P/E LTM 233.2 and EV/EBITDA LTM 47.5), the current price does not appear justified. For the company's value to grow, a significant improvement in operating performance and a reduction in debt are necessary.
Valuation on the latest reported figures
| Metric | Value |
|---|---|
| Market cap | 23.1 bn USD |
| P/E (LTM) | 233.2 |
| EV/EBITDA (LTM) | 47.5 |
| P/B | 8.79 |
| Net debt / EBITDA (LTM) | 8.06 |
| Operating cash flow (LTM) | 1.20 bn |
| ROE | 9.7% |
| Dividend yield (12m) | 6.0% |
Bottom line
Bottom line: Klabin's revenue grew 7.8%, but this did not translate into profit growth — EBITDA was flat and net profit fell 27.5%. Margins contracted, leverage is high, and multiples are elevated. The 5.98% dividend yield looks attractive, but its sustainability is questionable given low earnings. At the current price, the shares look unattractive.
Open the company's financial profile KLBN →
See also: market overview · valuation map · stock screeners