Energisa: double-digit revenue growth but a quarterly loss as interest burden bites
The Q2 2026 report showed revenue of $1,819.8 million (+18.5% YoY) and EBITDA of $339.7 million (+15.1%), but a net loss of $7.8 million versus a profit of $87.8 million a year earlier. Rising debt to $6,543.6 million and a drop in operating cash flow to $192.0 million indicate that interest expenses and investments are eating into operating profit. With P/E LTM at 61.3 and EV/EBITDA at 24.5, the stock looks overvalued relative to its own history, and a dividend yield of 2.2% does not compensate for the risks. Verdict – neutral.
Key takeaways
— Revenue grew 18.5% YoY to $1,819.8 million, but that did not prevent a loss
— EBITDA rose 15.1%, yet the EBITDA margin fell to 24.9% from 25.7%
— Net loss of $7.8 million is the result of interest expenses and debt growth to $6,543.6 million
— Operating cash flow fell to $192.0 million while capex rose to $283.4 million
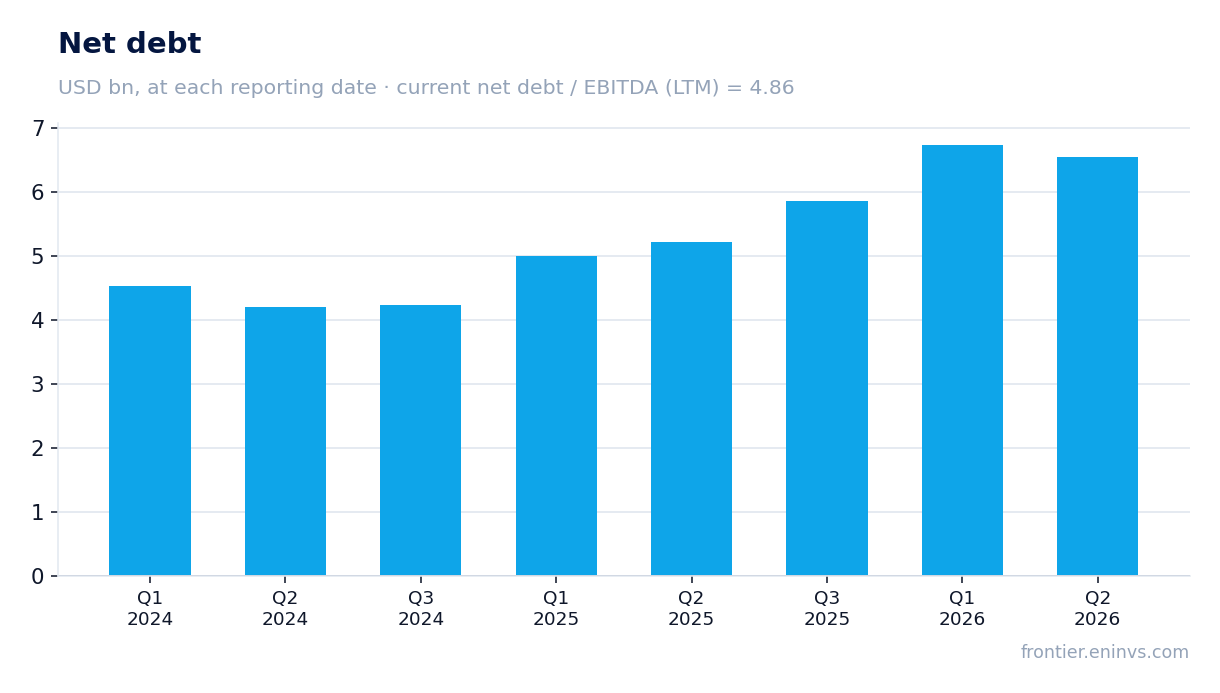
— Net debt / EBITDA LTM stands at 4.86 – a level that limits flexibility
— Dividend yield of 2.2% with P/E LTM at 61.3 does not make the stock attractive
Attractiveness
Key figures, USD bn
| Metric | Q2 2025 | Q2 2026 | Change |
|---|---|---|---|
| Revenue | 1.54 | 1.82 | +18.5% |
| EBITDA | 0.39 | 0.45 | +15.1% |
| Operating profit | 0.30 | 0.34 | +13.0% |
| Net profit | 0.09 | -0.01 | -108.9% |
| Operating cash flow | 0.25 | 0.19 | -23.6% |
| Capex | 0.28 | 0.28 | +2.5% |
| EBITDA margin | 25.7% | 24.9% | -0.8 pp |
| Net margin | 5.7% | -0.4% | -6.1 pp |
Revenue grew 18.5% YoY to $1,819.8 million, but that did not prevent a loss
Revenue in Q2 2026 was $1,819.8 million, up 18.5% from $1,536.0 million in Q2 2025. This continues strong growth: in Q1 2026 revenue rose 19.8% YoY to $1,792.8 million. The company has shown consistently high top-line growth for several quarters.
However, revenue growth did not translate into profit: the net loss for the quarter was $7.8 million versus a profit of $87.8 million a year earlier. The main reason is higher interest expenses due to increased debt, as well as lower operating efficiency. The EBITDA margin fell to 24.9% from 25.7% a year earlier, indicating faster cost growth.
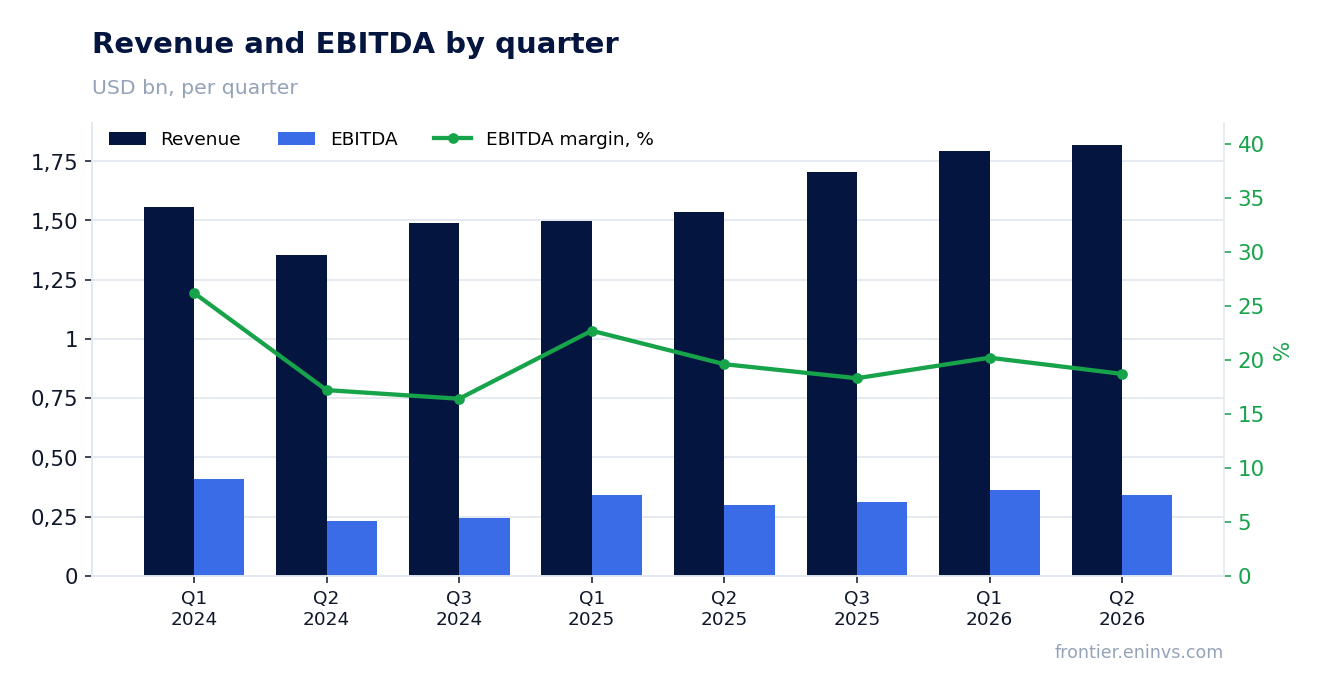
EBITDA rose 15.1%, yet the EBITDA margin fell to 24.9% from 25.7%
EBITDA in Q2 2026 rose 15.1% YoY to $339.7 million, but its margin fell to 24.9% from 25.7% in Q2 2025. This means costs are growing faster than revenue, putting pressure on operating efficiency.
The margin decline may be due to higher material, labour or other operating costs. Without a breakdown of expenses in the provided data, the exact cause is not identified, but the fact remains: the company is losing part of its profit on each dollar of revenue.
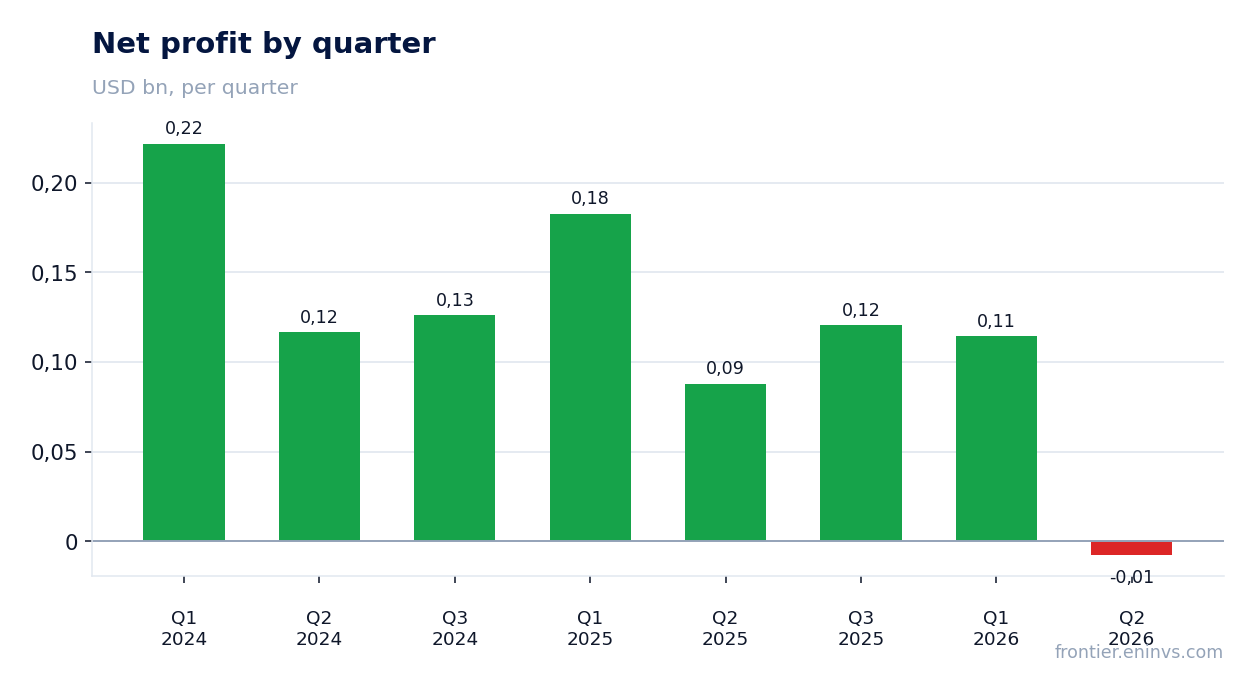
Net loss of $7.8 million is the result of interest expenses and debt growth to $6,543.6 million
The net loss in Q2 2026 was $7.8 million versus a profit of $87.8 million a year earlier. This sharp deterioration is due to higher interest expenses: net debt at the end of the quarter reached $6,543.6 million, up $1.3 billion over the last 12 months.
The net debt / EBITDA LTM ratio stands at 4.86, a high level that limits financial flexibility. Interest expenses consume a significant portion of operating profit, leading to a negative net result despite EBITDA growth.
Operating cash flow fell to $192.0 million while capex rose to $283.4 million
Operating cash flow in Q2 2026 was $192.0 million, significantly below $251.3 million a year earlier. This decline occurs against revenue growth and may indicate deteriorating earnings quality or higher working capital.
Capex rose to $283.4 million from $276.5 million a year earlier. Capex exceeding operating cash flow means the company is funding investments with debt, further increasing leverage and interest expenses.
Net debt / EBITDA LTM stands at 4.86 – a level that limits flexibility
Net debt at the end of Q2 2026 was $6,543.6 million, and the net debt / EBITDA LTM ratio was 4.86. This is a high level that may limit the company's ability to raise additional financing and invest in growth.
Over the last 12 months, net debt increased by $1.3 billion, reflecting active financing of investments and possibly interest expenses. At the current EBITDA level, debt servicing requires significant funds, as confirmed by the quarterly loss.
Dividend yield of 2.2% with P/E LTM at 61.3 does not make the stock attractive
The dividend yield over the last 12 months is 2.2%, below the current key rate and not compensating for the risks associated with the loss and high debt burden. With a P/E LTM of 61.3, the stock is expensive relative to its own history, and EV/EBITDA LTM is 24.5.
The company did not announce new dividends in the reporting period, and if losses persist, the likelihood of lower payouts increases. For income-oriented investors, the current yield is insufficient.
Valuation on the latest reported figures
| Metric | Value |
|---|---|
| Market cap | 25.1 bn USD |
| P/E (LTM) | 61.3 |
| EV/EBITDA (LTM) | 24.5 |
| P/B | 6.50 |
| Net debt / EBITDA (LTM) | 4.86 |
| Operating cash flow (LTM) | 1.10 bn |
| ROE | -0.7% |
| Dividend yield (12m) | 2.2% |
Bottom line
The report's strength remains revenue growth of 18.5% YoY to $1,819.8 million and EBITDA growth of 15.1%. However, the quarter ended with a net loss of $7.8 million due to interest expenses and debt growth to $6,543.6 million. Operating cash flow fell to $192.0 million while capex rose to $283.4 million, indicating debt-funded investments. With P/E LTM at 61.3 and EV/EBITDA at 24.5, the stock looks overvalued, and a dividend yield of 2.2% does not compensate for the risks. Verdict – neutral: the current price does not provide sufficient compensation for the loss and high debt burden.
Open the company's financial profile ENGI →
See also: market overview · valuation map · stock screeners