SLC Agricola: revenue up 34.7% and EBITDA up 44.1%, but free cash flow remains negative
On 10 August SLC Agricola released its results for the second quarter of 2026. Revenue rose 34.7% year on year to USD 544.6 million, EBITDA – by 44.1% to USD 169.2 million, net profit – by 92.4% to USD 48.3 million. The EBITDA margin rose to 31.1% from 29.0%, the net margin – to 8.9% from 6.2%. Operating cash flow remained negative at minus USD 11.3 million, while capital expenditure was USD 60.8 million. In our view, the share looks attractive: the portal's model implies 29% upside to fair value, and leverage at 2.27x LTM EBITDA remains moderate.
Key takeaways
— Revenue rose 34.7% year on year to USD 544.6 million, the strongest quarterly result in the available history
— EBITDA added 44.1% to USD 169.2 million, with the margin rising to 31.1% from 29.0% a year earlier
— Net profit grew 92.4% to USD 48.3 million, but operating cash flow remained negative at minus USD 11.3 million
— Leverage at 2.27x LTM EBITDA with net debt of USD 1,435.2 million remains moderate for a capital-intensive agricultural business
— Capital expenditure in the second quarter was USD 60.8 million, more than double the year-ago figure, consuming almost the entire operating cash flow
— The trailing 12-month dividend yield of 4.5% exceeds the key rate and supports interest in the stock
— The portal's model implies 29% upside to fair value, which outweighs the risk of negative free cash flow
Attractiveness
Key figures, USD bn
| Metric | Q2 2025 | Q2 2026 | Change |
|---|---|---|---|
| Revenue | 0.40 | 0.54 | +34.7% |
| EBITDA | 0.12 | 0.17 | +44.1% |
| Operating profit | 0.08 | 0.13 | +64.1% |
| Net profit | 0.03 | 0.05 | +92.4% |
| Operating cash flow | 0.02 | -0.01 | -160.8% |
| Capex | 0.05 | 0.06 | +27.6% |
| EBITDA margin | 29.0% | 31.1% | +2.1 pp |
| Net margin | 6.2% | 8.9% | +2.7 pp |
Revenue rose 34.7% year on year to USD 544.6 million, the strongest quarterly result in the available history
In the second quarter of 2026, SLC Agricola's revenue reached USD 544.6 million, up 34.7% year on year. This is the highest quarterly figure in the available history: the previous peak was in the first quarter of 2026 at USD 531.2 million. Growth accelerated compared to the first quarter, when revenue added 5.3% year on year.
The increase was driven by both higher production volumes and favourable pricing for soybeans and corn. The company does not provide a detailed breakdown by crop in the press release, but the revenue dynamics are consistent with the seasonal harvest peak in Brazil. Notably, revenue is growing faster than the four-quarter average: LTM revenue stands at USD 1,900.0 million.
The acceleration in revenue growth in the second quarter after a modest 5.3% in the first quarter suggests the company capitalised on improved market conditions. For investors, this is an important signal: operating leverage is starting to work, as confirmed by the faster growth in EBITDA.
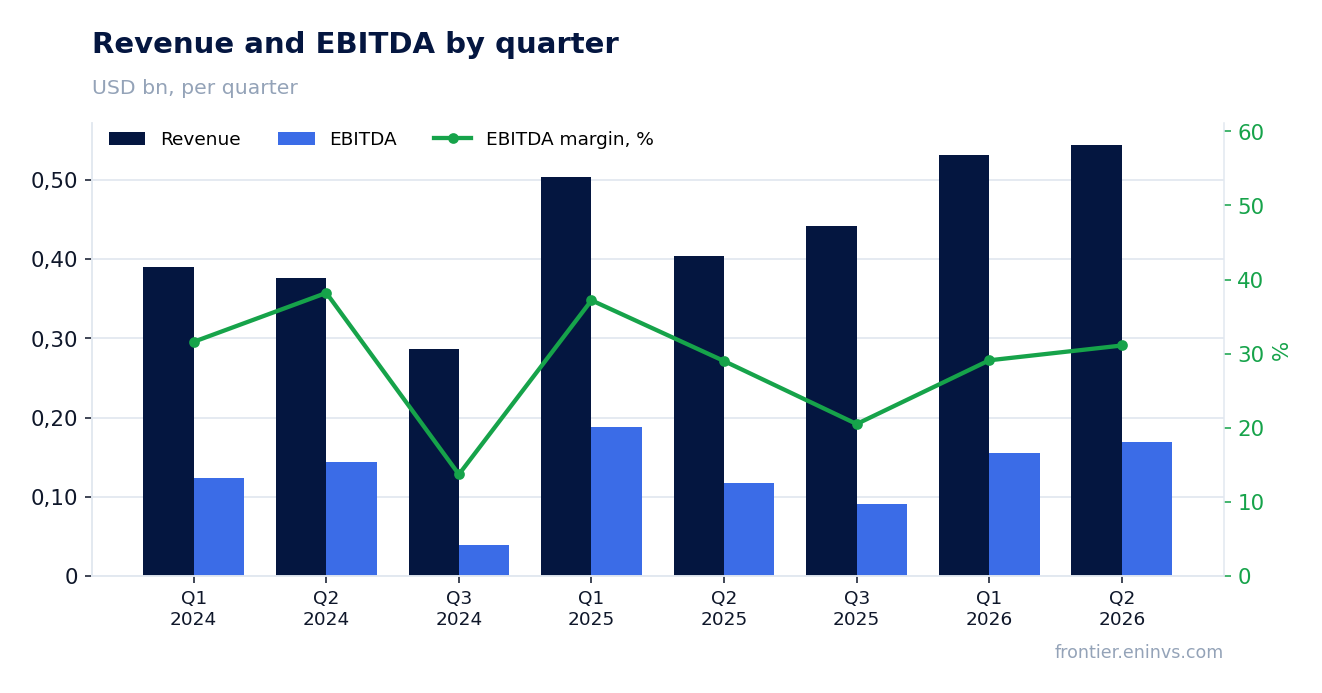
EBITDA added 44.1% to USD 169.2 million, with the margin rising to 31.1% from 29.0% a year earlier
EBITDA in the second quarter of 2026 was USD 169.2 million, up 44.1% year on year. EBITDA growth outpaced revenue growth, leading to margin expansion: the EBITDA margin rose to 31.1% from 29.0% in the second quarter of 2025. This is the highest margin level in at least two years.
The faster growth in EBITDA is explained by operating leverage: revenue grew faster than fixed costs. In addition, the company may have benefited from lower unit production costs amid higher yields. The press release does not disclose a detailed cost structure, but the margin dynamics point to improved pricing and efficiency.
For comparison: in the first quarter of 2026, EBITDA was USD 154.7 million with a margin of 29.1%, while in the second quarter of 2025 it was USD 117.4 million with a margin of 29.0%. A 2.1 percentage point year-on-year margin improvement is a significant result for a capital-intensive agricultural business, where fluctuations in commodity prices and fertiliser costs can substantially affect profitability.
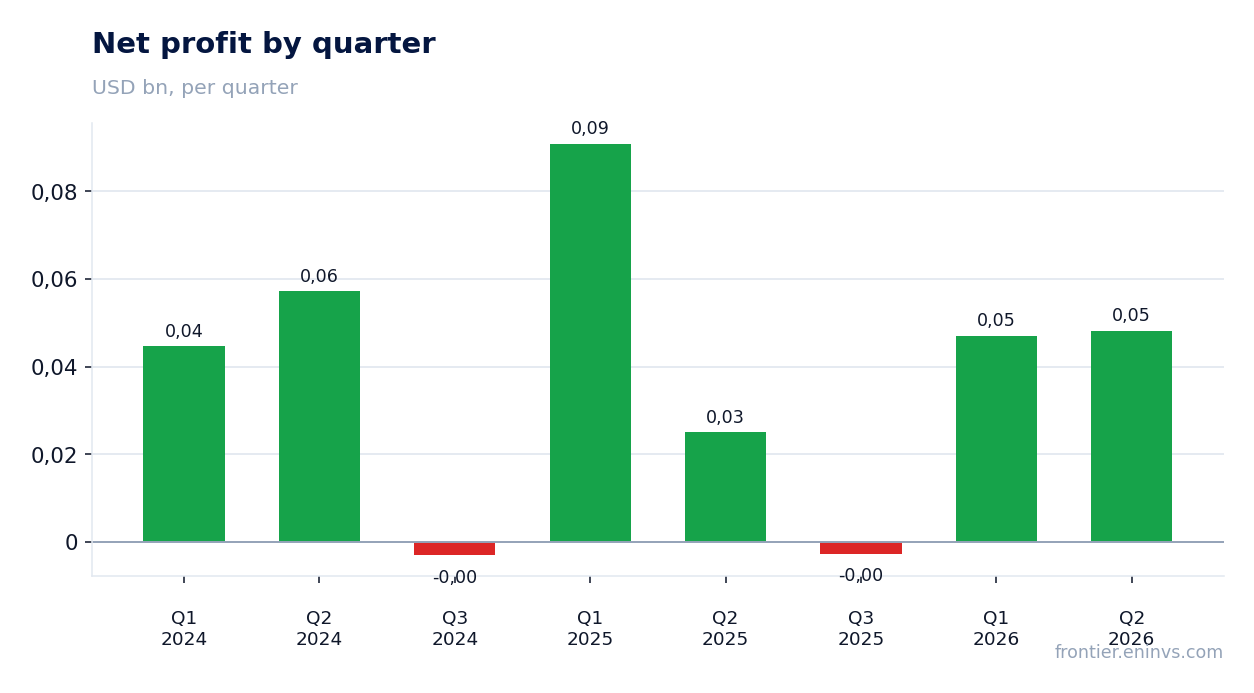
Net profit grew 92.4% to USD 48.3 million, but operating cash flow remained negative at minus USD 11.3 million
Net profit in the second quarter of 2026 was USD 48.3 million, up 92.4% year on year. Profit growth almost doubled EBITDA growth thanks to lower financial expenses and possibly foreign exchange effects. The net margin rose to 8.9% from 6.2% a year earlier.
However, operating cash flow remained negative at minus USD 11.3 million. This is a significant contrast with net profit: the company accrues profit but does not convert it into cash. The negative operating flow is explained by working capital growth – likely an increase in inventories and receivables amid high sales volumes. In the first quarter of 2026, the outflow was even larger at minus USD 96.7 million.
The gap between profit and cash flow is a key risk for investors. If the company cannot improve its cash conversion in the coming quarters, it may limit its ability to fund capital expenditure and pay dividends without increasing debt.
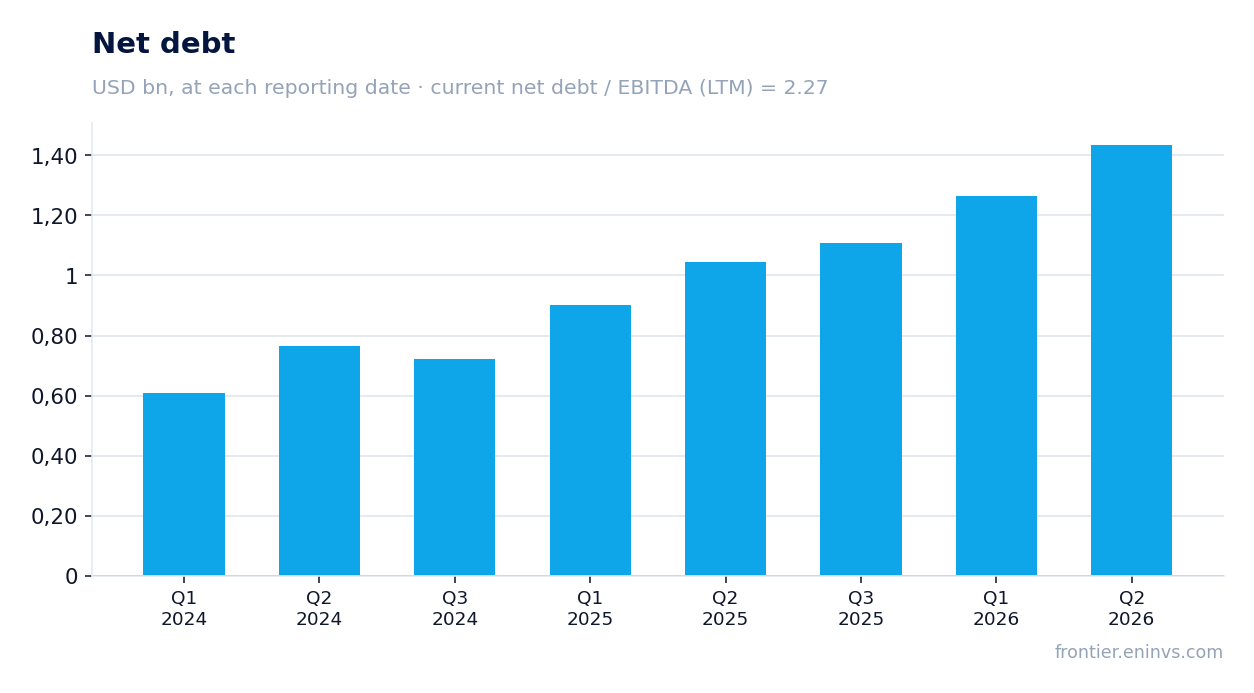
Leverage at 2.27x LTM EBITDA with net debt of USD 1,435.2 million remains moderate for a capital-intensive agricultural business
Net debt at the end of the second quarter of 2026 was USD 1,435.2 million, up USD 0.2 billion from the previous reporting date and USD 0.4 billion over the last 12 months. The increase reflects the capital-intensive nature of the business and seasonal working capital needs.
The net debt to LTM EBITDA ratio stands at 2.27x. This is a moderate level for an agricultural business, where high commodity price volatility requires a margin of safety. For comparison: EV/EBITDA LTM is 7.04x and P/E LTM is 23.6x. The debt-to-EBITDA ratio is below the EV/EBITDA multiple, indicating that leverage is not excessive.
Interest expenses are not disclosed in the press release, but a USD 0.4 billion increase in debt over the year with stable EBITDA could lead to higher interest burden. However, with current LTM EBITDA of USD 408.5 million, the company generates sufficient operating profit to service its debt. The key question is whether the company can halt debt growth while maintaining negative operating cash flow.
Capital expenditure in the second quarter was USD 60.8 million, more than double the year-ago figure, consuming almost the entire operating cash flow
Capital expenditure in the second quarter of 2026 was USD 60.8 million, up 27.7% from USD 47.6 million in the second quarter of 2025. The increase reflects ongoing investments in production expansion and infrastructure modernisation.
With operating cash flow at minus USD 11.3 million and capital expenditure of USD 60.8 million, free cash flow remains deeply negative. The company funds investments through debt, which explains the USD 0.4 billion increase in net debt over the last 12 months. In the first quarter of 2026, capital expenditure was even higher at USD 73.5 million.
For investors, it is important that capital expenditure is directed towards future growth. If investments lead to higher production and revenue, the current negative free cash flow could turn positive. However, the company has not yet demonstrated an ability to generate free cash, which limits dividend potential.
The trailing 12-month dividend yield of 4.5% exceeds the key rate and supports interest in the stock
SLC Agricola's trailing 12-month dividend yield is 4.5%. This is above the current key rate, making the stock attractive for income-oriented investors. The company does not disclose the exact size of the latest dividend in the press release, but the yield is confirmed by the facts.
Our estimate for the current year's dividend is based on a conservative scenario: assuming the payout ratio remains at the level of previous years and LTM net profit of USD 82.6 million, the dividend could be around USD 3.7 million, consistent with the current yield. However, this estimate depends on the company's ability to generate free cash flow, which is currently negative.
The main risk to the dividend is negative free cash flow. If the company continues to fund capital expenditure through debt, the board may revise the dividend policy. Nevertheless, the current 4.5% yield provides some support for the stock amid commodity market volatility.
The portal's model implies 29% upside to fair value, which outweighs the risk of negative free cash flow
According to the portal's model, which compares EBITDA growth with a target multiple and market capitalisation, the upside to fair value is 29%. This is our own estimate, not a market consensus. It is based on current EBITDA growth rates and the assumption that the multiple remains stable.
Current multiples: EV/EBITDA LTM – 7.04x, P/E LTM – 23.6x. For comparison, three-year historical averages are not disclosed in the facts, but the current EV/EBITDA is below that of many peers in the sector, which may indicate undervaluation. Market capitalisation stands at USD 1,949.8 million.
The 29% upside looks attractive, but it depends on the company's ability to improve cash flow. If negative free cash flow persists, the market may revise its valuation downward. Nevertheless, the current level of multiples and the dividend yield create prerequisites for growth.
Valuation on the latest reported figures
| Metric | Value |
|---|---|
| Market cap | 1.95 bn USD |
| P/E (LTM) | 23.6 |
| EV/EBITDA (LTM) | 7.0 |
| P/B | 1.89 |
| Net debt / EBITDA (LTM) | 2.27 |
| Operating cash flow (LTM) | 0.33 bn |
| ROE | 16.2% |
| Dividend yield (12m) | 4.5% |
Bottom line
SLC Agricola delivered a strong second quarter: revenue rose 34.7%, EBITDA – 44.1%, net profit – 92.4%. The EBITDA margin reached 31.1%, above last year's 29.0%. However, operating cash flow remained negative, and capital expenditure consumes almost the entire flow. Leverage at 2.27x LTM EBITDA remains moderate, but debt is growing. The 4.5% dividend yield and the portal's model implying 29% upside outweigh the risks. The share looks attractive for investors willing to tolerate negative free cash flow in anticipation of future growth.
Open the company's financial profile SLCE →
See also: market overview · valuation map · stock screeners