Hapvida: revenue up 55.1% but EBITDA margin fell to 56.7% and net loss persisted
On August 10, Hapvida reported results for the second quarter of 2026. Revenue rose 55.1% year-on-year to USD 240.022 million, EBITDA grew 36.0% to USD 136.179 million, but the EBITDA margin fell to 56.7% from 64.7% a year earlier. The net loss narrowed to USD 14.933 million from USD 59.46 million a year earlier, yet the company remains loss-making. At the current price, the share looks unattractive: EV/EBITDA of 2.85 with no historical average available, negative return on equity, and the portal's model pointing to 48% downside to fair value.
Key takeaways
— Revenue grew 55.1% year-on-year, but this is largely a low-base effect from last year
— EBITDA rose 36.0%, yet its margin fell to 56.7% from 64.7% due to faster cost growth
— Net loss narrowed to USD 14.933 million, but the company remains loss-making for the fourth consecutive quarter
— Operating cash flow was USD 67.722 million and capital expenditures USD 33.984 million, leaving positive free cash flow
— Leverage at 1.71x EBITDA LTM and EV/EBITDA of 2.85 do not provide a clear valuation without historical context
— The portal's model indicates 48% downside to fair value, outweighing operational improvements
Attractiveness
Key figures, USD bn
| Metric | Q2 2025 | Q2 2026 | Change |
|---|---|---|---|
| Revenue | 0.15 | 0.24 | +55.1% |
| EBITDA | 0.10 | 0.14 | +36.0% |
| Operating profit | 0.03 | 0.07 | +179.3% |
| Net profit | -0.06 | -0.01 | — |
| Operating cash flow | 0.11 | 0.07 | -40.9% |
| Capex | 0.04 | 0.03 | -4.1% |
| EBITDA margin | 64.7% | 56.7% | -8.0 pp |
| Net margin | -38.4% | -6.2% | +32.2 pp |
Revenue grew 55.1% year-on-year, but this is largely a low-base effect from last year
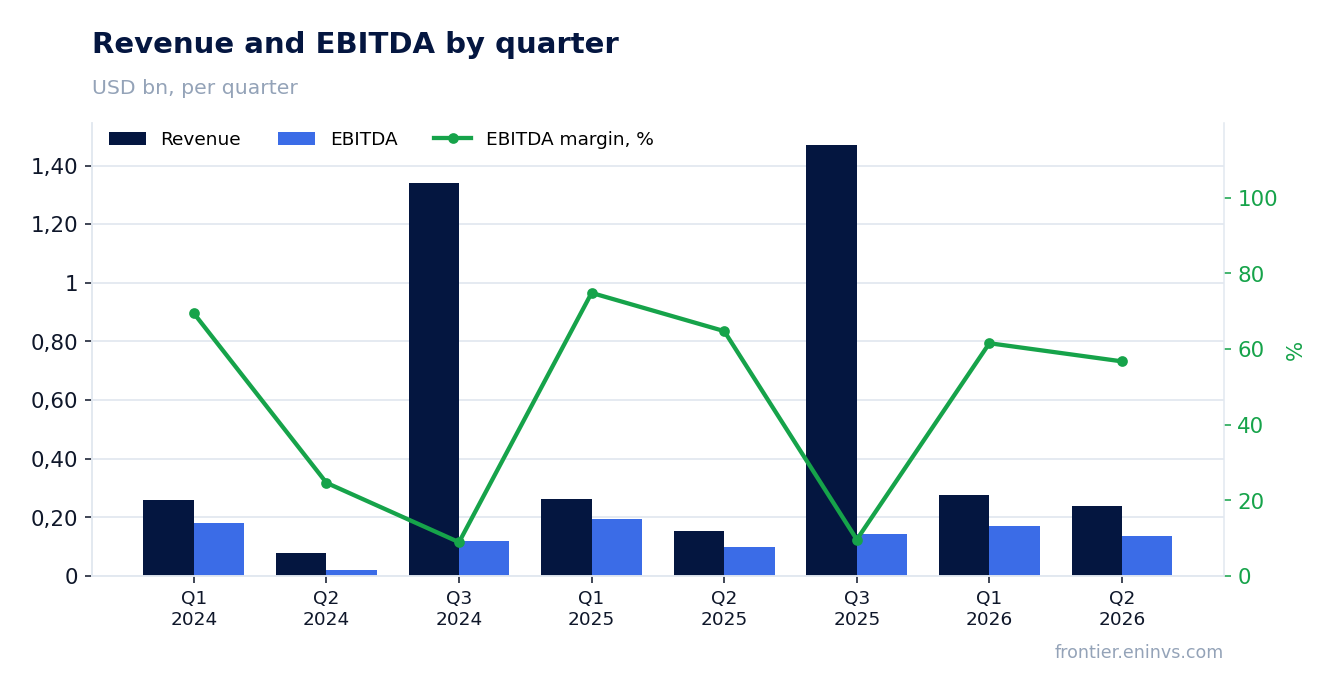
In the second quarter of 2026, Hapvida's revenue reached USD 240.022 million, up 55.1% from the same period last year. This growth looks impressive, but it is largely explained by the low base of Q2 2025, when revenue was only USD 154.745 million. For comparison, in Q1 2026 revenue was USD 277.382 million, meaning it declined sequentially by 13.5%.
Quarterly dynamics remain uneven: after a sharp spike in Q3 2024 (revenue of USD 1,342.073 million) and a subsequent drop in Q1 2025 (USD 261.43 million), the company shows fluctuations from USD 77.899 million to USD 1,471.224 million. This makes it difficult to assess business sustainability. In Q2 2026, revenue was lower than in Q1 2026 and Q3 2025, which may indicate seasonality or one-off factors, but the exact cause is not disclosed.
Thus, the 55.1% year-on-year revenue growth should not be misleading: it reflects a recovery from a weak Q2 2025, not an acceleration in organic growth. The sequential decline from Q1 2026 raises questions about the company's ability to maintain its achieved sales level.
EBITDA rose 36.0%, yet its margin fell to 56.7% from 64.7% due to faster cost growth
In Q2 2026, Hapvida's EBITDA was USD 136.179 million, up 36.0% year-on-year. However, the EBITDA margin fell to 56.7% from 64.7% in Q2 2025. This means costs grew faster than revenue, compressing the margin by 8 percentage points.
Operating profit in Q2 2026 was USD 72.772 million, also lower than in Q1 2026 (USD 106.488 million). The decline in operating profit despite year-on-year revenue growth indicates rising operating expenses. The company does not disclose cost line details, so it is impossible to pinpoint the largest pressure factor.
The EBITDA margin decline is a key negative in the report. If last year the company converted 64.7% of revenue into EBITDA, now only 56.7%. This reduces the ability to generate cash flow and service debt. For investors, it is important to understand whether this is a one-off or a new trend.
Net loss narrowed to USD 14.933 million, but the company remains loss-making for the fourth consecutive quarter
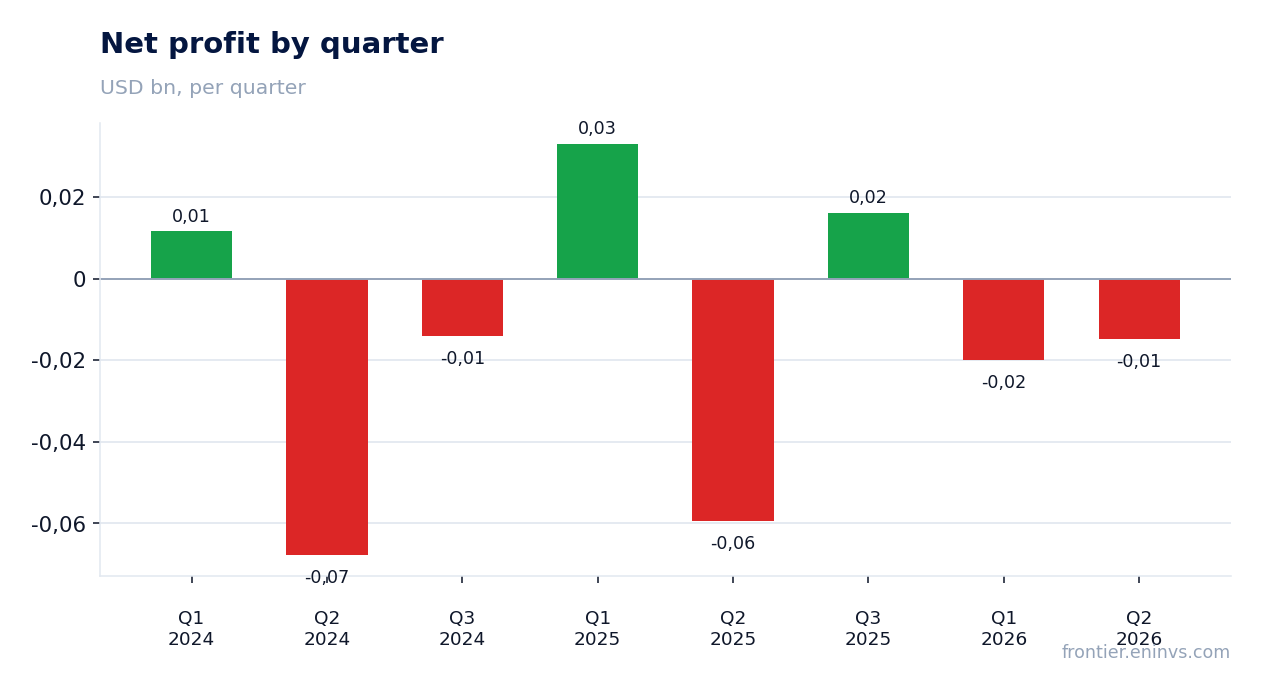
Hapvida's net loss in Q2 2026 was USD 14.933 million versus a loss of USD 59.46 million a year earlier. The reduction in loss was mainly due to a smaller negative effect compared to the prior year. Nevertheless, the company remains loss-making for the fourth consecutive quarter: in Q1 2026 the loss was USD 20.069 million, in Q3 2025 – USD 16.185 million, in Q2 2025 – USD 59.46 million.
The net margin in Q2 2026 was -6.2% versus -38.4% a year earlier. The margin improvement is due to the significantly larger loss a year ago. However, a negative net margin means the company is not yet generating profit for shareholders. Return on equity (ROE) remains negative at -0.63%.
Persistent losses over several consecutive quarters are an alarming signal. Even with revenue and EBITDA growth, the company cannot achieve positive net profit, which may be due to high interest expenses or one-off write-offs. Without a detailed income statement, it is difficult to determine the exact cause.
Operating cash flow was USD 67.722 million and capital expenditures USD 33.984 million, leaving positive free cash flow
In Q2 2026, Hapvida's operating cash flow was USD 67.722 million and capital expenditures were USD 33.984 million. This means free cash flow (the difference between operating cash flow and capex) was positive at approximately USD 33.738 million. For a company incurring net losses, positive free cash flow is an important positive.
However, operating cash flow declined compared to Q1 2026 (USD 124.821 million) and Q2 2025 (USD 114.669 million). The decline may be due to seasonal factors or changes in working capital. Capital expenditures also decreased relative to Q1 2026 (USD 37.997 million), which may have supported free cash flow.
Positive free cash flow allows the company to fund capital expenditures and service debt without additional financing. Nevertheless, the sustainability of this metric is questionable given the volatility of operating cash flow across quarters.
Leverage at 1.71x EBITDA LTM and EV/EBITDA of 2.85 do not provide a clear valuation without historical context
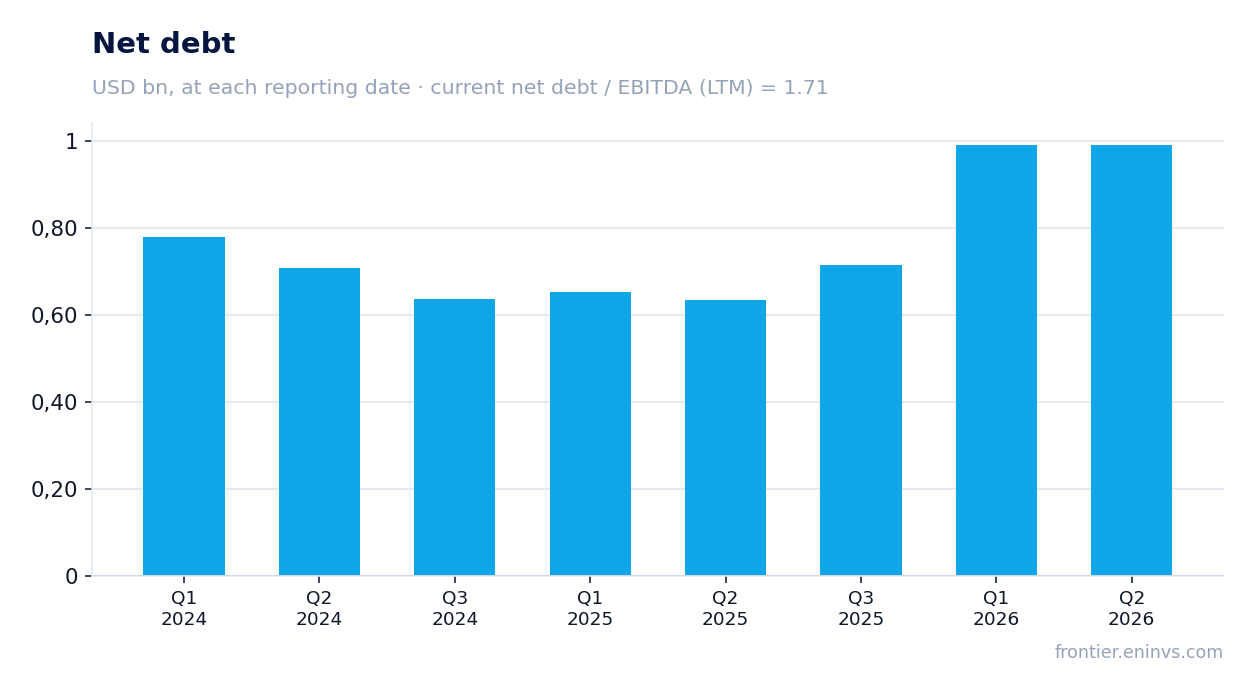
Hapvida's net debt at the latest reporting date was USD 913.918 million, and the net debt to EBITDA ratio for the trailing twelve months was 1.71. This is a moderate leverage level that does not appear critical. However, the FACTS do not include the previous value of this ratio, so it cannot be stated whether leverage rose or fell. Only the current level can be noted.
The EV/EBITDA LTM multiple is 2.85. This is a very low level, which may indicate undervaluation, but without comparison to the three-year historical average, it is impossible to determine whether this is an anomaly or the norm. The FACTS do not contain historical data for this multiple, so we cannot conclude on its attractiveness relative to the company's own history.
Net debt over the trailing twelve months increased by RUB 0.4 billion (according to the portal), which in dollar terms may be insignificant. Given positive free cash flow, the company can service its debt, but the low EV/EBITDA may also reflect risks associated with loss-making and revenue volatility.
The portal's model indicates 48% downside to fair value, outweighing operational improvements
According to the portal's model, the fair value of Hapvida's share based on EBITDA growth, target multiple, and market capitalization implies 48% downside from the current price. This is the portal's own estimate, not a market consensus or a target price. The company's market capitalization is USD 611.01 million.
The model accounts for EBITDA growth and a target multiple but likely does not fully reflect risks associated with loss-making and revenue volatility. Nevertheless, 48% downside is a serious argument for caution on the stock. Even with positive free cash flow and moderate leverage, the market valuation may be inflated relative to fundamentals.
For investors, this means the current price may not reflect risks related to margin decline and persistent losses. If the company cannot improve profitability and achieve sustainable profit, the market valuation may adjust toward the fair value calculated by the portal's model.
Valuation on the latest reported figures
| Metric | Value |
|---|---|
| Market cap | 0.61 bn USD |
| EV/EBITDA (LTM) | 2.8 |
| P/B | 0.07 |
| Net debt / EBITDA (LTM) | 1.71 |
| Operating cash flow (LTM) | 0.38 bn |
| ROE | -0.6% |
Bottom line
In Q2 2026, Hapvida showed revenue growth of 55.1% and EBITDA growth of 36.0%, but these improvements are largely due to the low base of the prior year. The EBITDA margin fell to 56.7% from 64.7%, and the net loss, while narrowing to USD 14.933 million, remains for the fourth consecutive quarter. Positive free cash flow and moderate leverage (1.71x EBITDA LTM) are strengths, but the portal's model indicates 48% downside to fair value. At the current price, the share looks unattractive: operational improvements do not offset risks related to margin decline and loss-making.
Open the company's financial profile HAPV →
See also: market overview · valuation map · stock screeners