Sao Martinho: revenue fell 9.7% and profit dropped by a third as margin compressed to 25.2%
Sao Martinho reported results for the second quarter of 2026. Revenue declined 9.7% year-on-year to $300.9 million, EBITDA fell 24.8% to $75.9 million, and net profit dropped 33.3% to $7.5 million. The EBITDA margin was 25.2% versus 30.3% a year earlier. At the current price, the stock looks unattractive: falling revenue and margin, leverage at 4.64x EBITDA, and negative upside on the portal's model.
Key takeaways
— Revenue in Q2 2026 fell 9.7% year-on-year to $300.9 million, extending the decline after a 4.9% drop in the previous quarter
— EBITDA fell 24.8% to $75.9 million, and the EBITDA margin compressed to 25.2% from 30.3% a year earlier
— Net profit declined 33.3% to $7.5 million, with a net margin of 2.5% versus 3.4% a year earlier
— Operating cash flow was $43.2 million and capital expenditures $37.4 million, leaving only $5.7 million of free cash flow
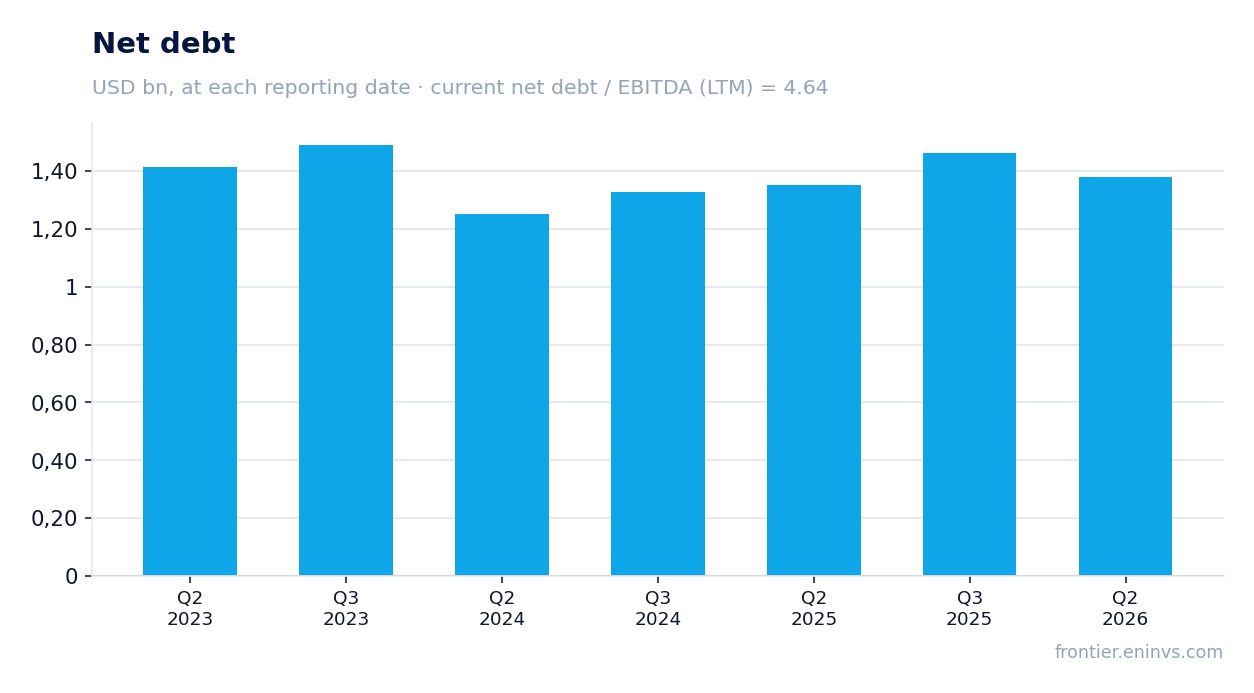
— Net debt at the end of the quarter was $1,379.6 million, and the net debt to EBITDA ratio for the last 12 months was 4.64
— Dividend yield over the last 12 months is 1.08%, below the key rate and insufficient to compensate for risks
— According to the portal's model, the fair value of the share is 70% below the current market price
Attractiveness
Key figures, USD bn
| Metric | Q2 2025 | Q2 2026 | Change |
|---|---|---|---|
| Revenue | 0.33 | 0.30 | -9.7% |
| EBITDA | 0.10 | 0.08 | -24.8% |
| Operating profit | 0.05 | 0.04 | -31.7% |
| Net profit | 0.01 | 0.01 | -33.3% |
| Operating cash flow | 0.10 | 0.04 | -58.8% |
| Capex | 0.02 | 0.04 | +93.8% |
| EBITDA margin | 30.3% | 25.2% | -5.1 pp |
| Net margin | 3.4% | 2.5% | -0.9 pp |
Revenue in Q2 2026 fell 9.7% year-on-year to $300.9 million, extending the decline after a 4.9% drop in the previous quarter
Sao Martinho's revenue in Q2 2026 was $300.9 million, down 9.7% from a year earlier. This is the second consecutive quarterly decline: in the previous quarter, the drop was 4.9%. For comparison, in Q2 2025 revenue grew 13.7%, and in Q3 2024 it grew 11.7%.
The revenue decline may be linked to falling sugar and ethanol prices in global markets, as well as reduced production volumes due to weather conditions. However, the exact reasons are not disclosed in the report. The company did not comment on revenue dynamics.
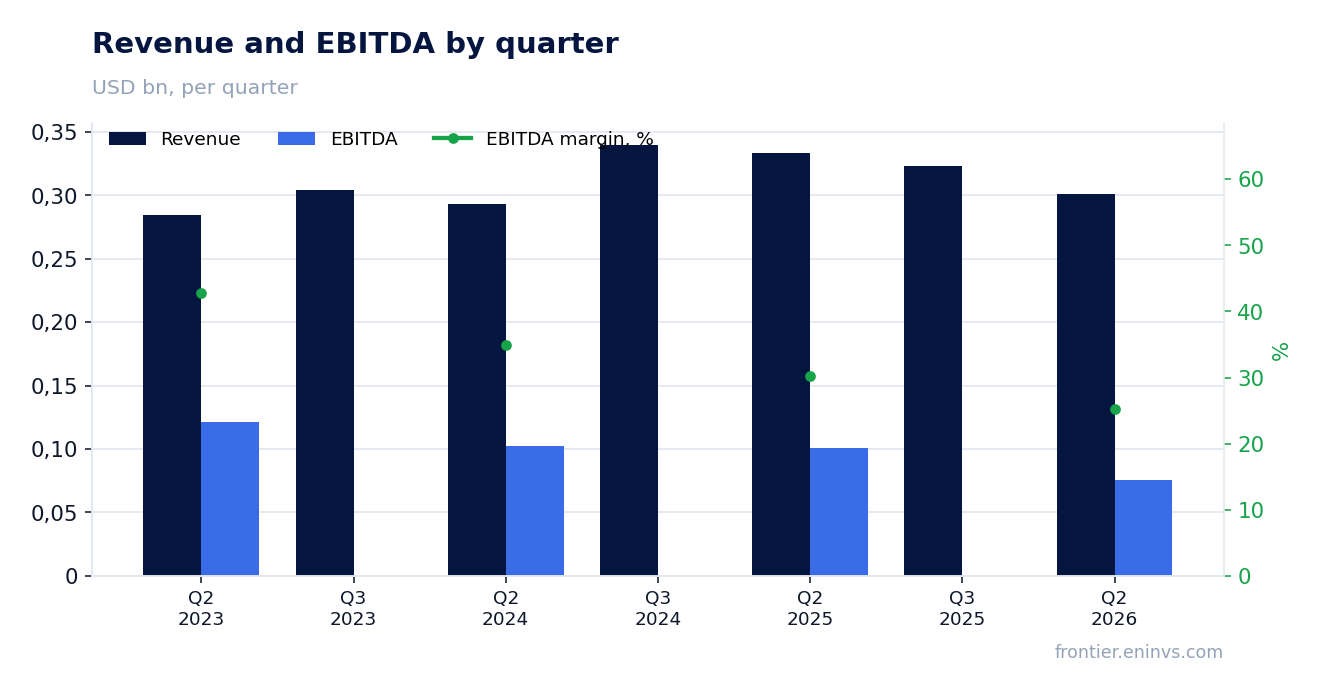
EBITDA fell 24.8% to $75.9 million, and the EBITDA margin compressed to 25.2% from 30.3% a year earlier
EBITDA in Q2 2026 was $75.9 million, down 24.8% from a year earlier. The EBITDA margin fell to 25.2% from 30.3% in the same period last year. Operating profit dropped to $37.2 million from $54.4 million a year earlier.
The margin compression occurred as revenue fell faster than costs. The company does not disclose its cost structure, so it is impossible to say exactly which cost line exerted the most pressure. However, the 31.7% decline in operating profit indicates that cost growth outpaced the revenue decline.
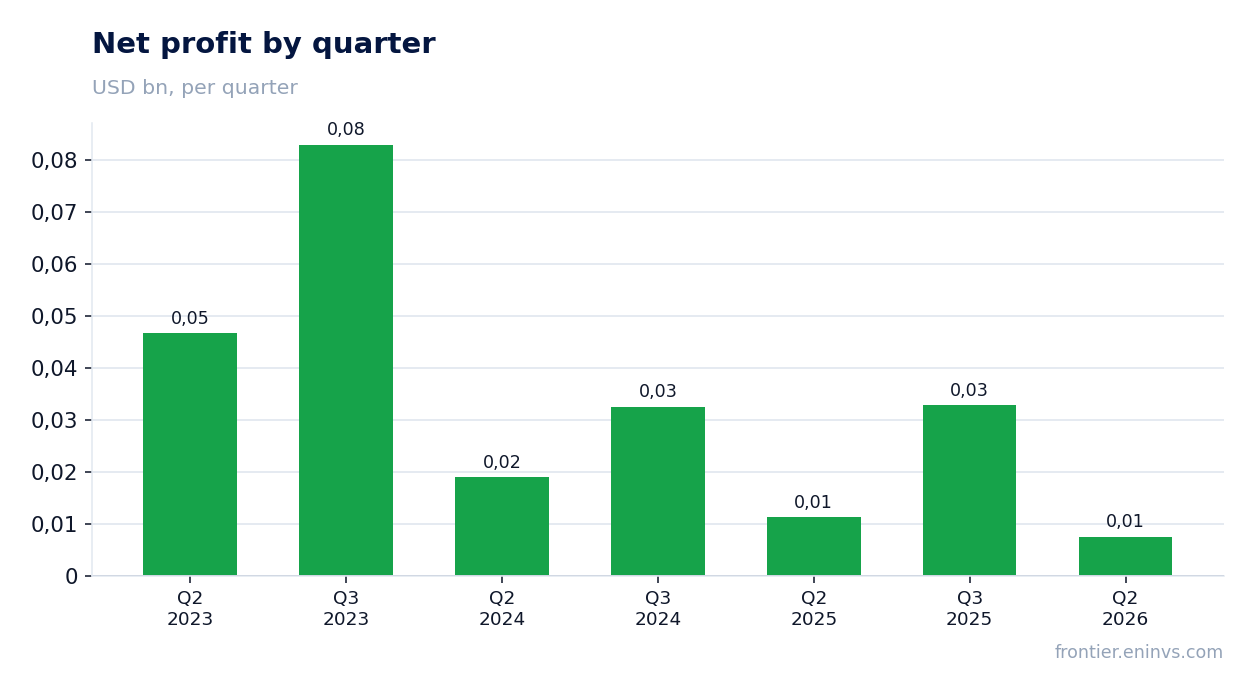
Net profit declined 33.3% to $7.5 million, with a net margin of 2.5% versus 3.4% a year earlier
Net profit in Q2 2026 was $7.5 million, down 33.3% from a year earlier. The net margin fell to 2.5% from 3.4%. The main pressure on profit came from the decline in operating profit and likely from higher financial expenses due to high debt.
The more than one-third decline in net profit with a 9.7% drop in revenue indicates strong operating leverage: each percentage point of revenue decline leads to a larger drop in profit. This poses risks to dividend payments if the trend continues.
Operating cash flow was $43.2 million and capital expenditures $37.4 million, leaving only $5.7 million of free cash flow
Operating cash flow in Q2 2026 was $43.2 million, significantly lower than $104.9 million a year earlier. Capital expenditures rose to $37.4 million from $19.3 million. As a result, free cash flow was minimal – only $5.7 million.
The sharp reduction in operating cash flow combined with increased capital expenditures creates financing strain. The company is forced to direct almost all operating cash flow to investments, limiting opportunities to reduce debt or pay dividends.
Net debt at the end of the quarter was $1,379.6 million, and the net debt to EBITDA ratio for the last 12 months was 4.64
Net debt at the end of Q2 2026 was $1,379.6 million, virtually unchanged over the year (a year earlier – $1,351.3 million). The net debt to EBITDA ratio for the last 12 months stands at 4.64. This is a high figure that limits the company's financial flexibility.
High debt load means significant interest expenses that eat into profits. At the current level of EBITDA and debt, the company may face difficulties refinancing if market conditions worsen. However, the report does not disclose the debt repayment schedule or average borrowing cost.
Dividend yield over the last 12 months is 1.08%, below the key rate and insufficient to compensate for risks
Sao Martinho's dividend yield over the last 12 months is 1.08%. This is a low level that does not compensate for the risks associated with falling profits and high debt load. For comparison, the key rate in Russia is significantly higher, making the company's dividend payments less attractive to investors.
If the current trend of declining net profit continues, dividend payments may be cut. The company does not disclose its dividend policy, so it is impossible to assess what share of profit is allocated to dividends. However, the low yield already indicates limited upside for income-oriented investors.
According to the portal's model, the fair value of the share is 70% below the current market price
According to the portal's model, the fair value of Sao Martinho's share is 70% below the current market price. This means the market overvalues the company relative to its fundamentals. The model takes into account EBITDA growth, a target multiple, and market capitalisation.
The company's market capitalisation is $1,176.3 million, and EV/EBITDA for the last 12 months is 8.33. P/E for the last 12 months is 9.71. These multiples do not look inflated, but against falling revenue and profit they could be a trap. The portal's model points to significant downside.
Valuation on the latest reported figures
| Metric | Value |
|---|---|
| Market cap | 1.18 bn USD |
| P/E (LTM) | 9.7 |
| EV/EBITDA (LTM) | 8.3 |
| P/B | 0.88 |
| Net debt / EBITDA (LTM) | 4.64 |
| Operating cash flow (LTM) | 0.20 bn |
| ROE | 2.2% |
| Dividend yield (12m) | 1.1% |
Bottom line
Sao Martinho delivered weak results for Q2 2026: revenue fell 9.7%, EBITDA – 24.8%, net profit – 33.3%. The EBITDA margin compressed to 25.2%. Operating cash flow dropped sharply while capital expenditures rose, leaving minimal free cash flow. Debt load remains high at 4.64x EBITDA. Dividend yield of 1.08% is unattractive. According to the portal's model, the stock is overvalued by 70%. All this makes the stock unattractive for investment at current levels.
Open the company's financial profile SMTO →
See also: market overview · valuation map · stock screeners