B3 Exchange: profit rose 40.8% but quarterly cash flow nearly halved
B3 Exchange reported second-quarter 2026 results. Revenue rose 23.2% year on year to $606.8 million, EBITDA – 22.9% to $377.08 million, and net profit – 40.8% to $335.011 million. Net margin improved to 55.2% from 48.3% a year earlier. However, operating cash flow for the quarter was only $128.632 million versus $220.16 million a year ago. In our view, the share looks attractive: EV/EBITDA LTM of 12.3 and P/E LTM of 16.9 do not appear stretched for a company with EBITDA margin above 65% and a dividend yield of 4.3%, while the portal's model points to 17% upside to fair value.
Key takeaways
— Revenue rose 23.2% year on year but fell 4.9% quarter on quarter
— Net margin climbed to 55.2% on disproportionate profit growth
— Operating cash flow for the quarter fell to $128.632 million, though it was $795.9 million over the trailing twelve months
— Net debt remains negative at $309.04 million, with net debt/EBITDA LTM at -0.08
— Trailing twelve-month dividend yield is 4.33%, above the key rate
— EV/EBITDA LTM of 12.3 and P/E LTM of 16.9 do not look stretched for a company with a 65.2% EBITDA margin
— The portal's model estimates 17% upside to fair value
Attractiveness
Key figures, USD bn
| Metric | Q2 2025 | Q2 2026 | Change |
|---|---|---|---|
| Revenue | 0.49 | 0.61 | +23.2% |
| EBITDA | 0.32 | 0.40 | +22.9% |
| Operating profit | 0.30 | 0.38 | +23.8% |
| Net profit | 0.24 | 0.34 | +40.8% |
| Operating cash flow | 0.22 | 0.13 | -41.6% |
| Capex | 0.00 | 0.00 | -85.8% |
| EBITDA margin | 65.4% | 65.2% | -0.2 pp |
| Net margin | 48.3% | 55.2% | +6.9 pp |
Revenue rose 23.2% year on year but fell 4.9% quarter on quarter
In the second quarter of 2026, B3 Exchange revenue reached $606.8 million, up 23.2% year on year. This extends a strong growth streak: in the first quarter of 2026 revenue rose 35.0% year on year, and in the fourth quarter of 2025 it rose 9.3%. However, compared with the first quarter of 2026, revenue declined 4.9% from $638.115 million to $606.8 million.
The deceleration in annual growth from 35.0% in Q1 to 23.2% in Q2 is mainly due to a high base effect: in Q2 2025 revenue was already at $492.484 million, whereas in Q1 2025 it was only $472.804 million. The sequential decline may reflect seasonal trading volumes, but the provided data do not disclose specific drivers.
Despite the quarterly decline, annual growth remains in double digits, and the absolute revenue level is the highest for a second quarter in the history of the provided data. This supports the overall picture of sustained demand for the exchange's services.
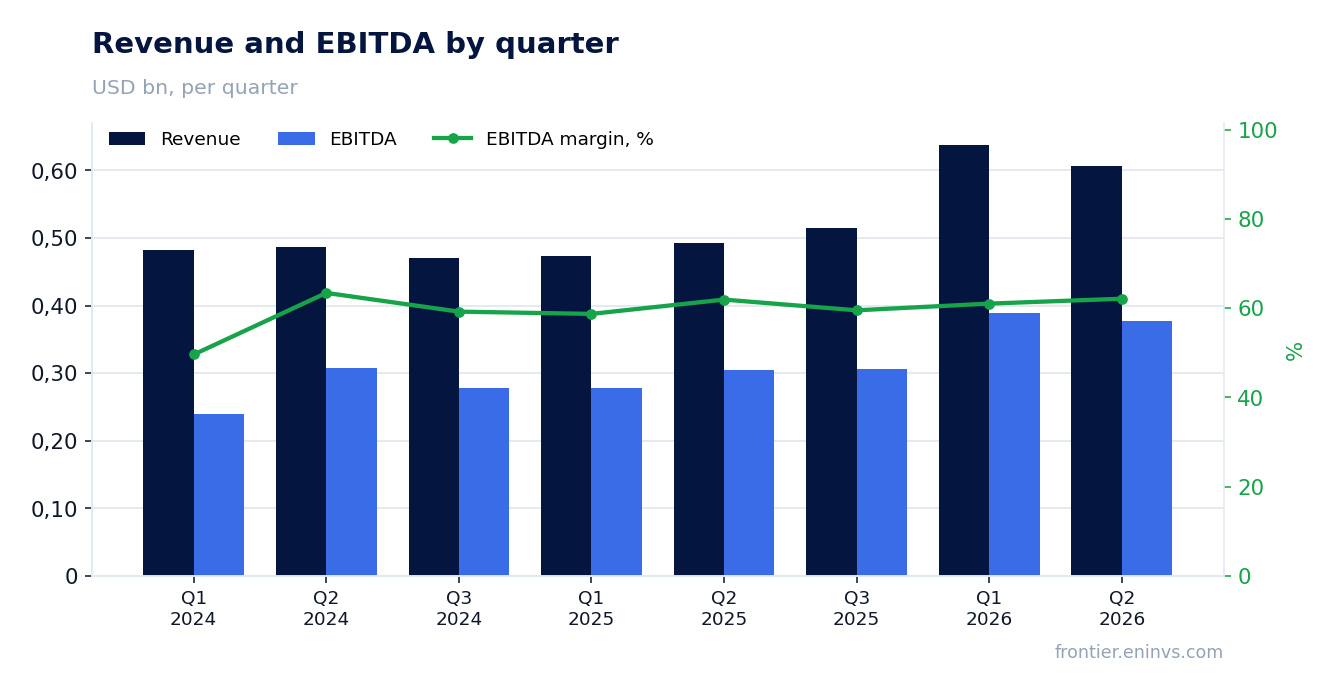
Net margin climbed to 55.2% on disproportionate profit growth
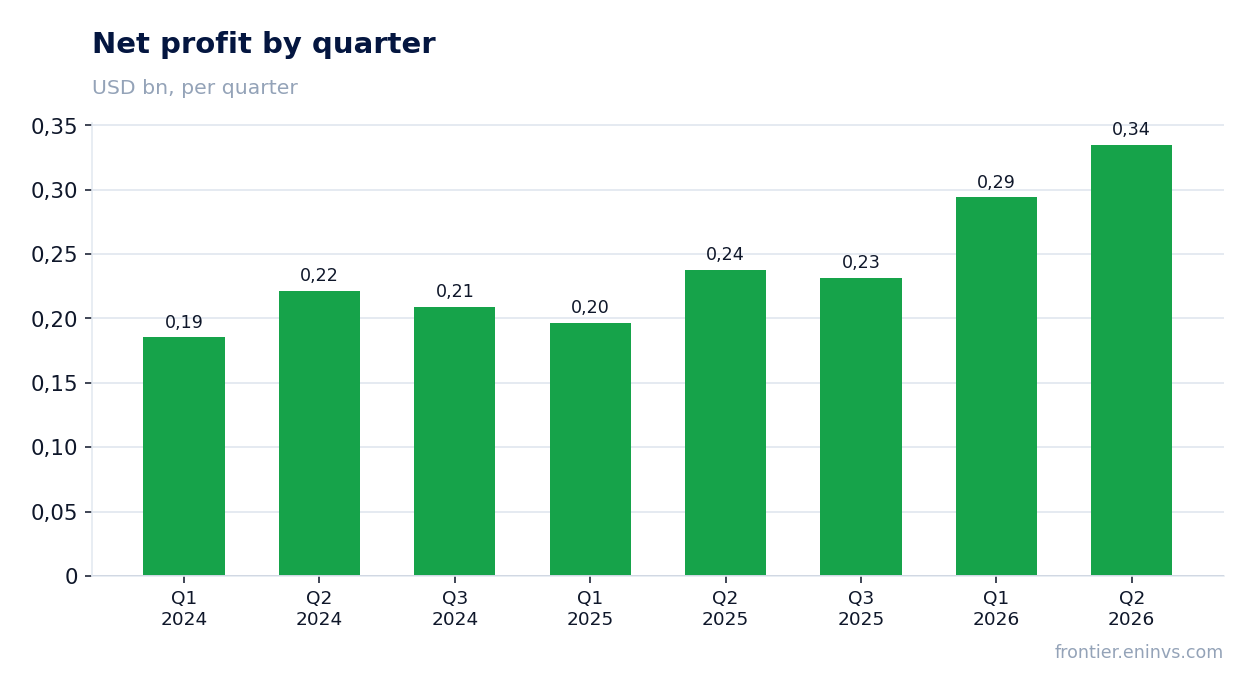
Net profit in Q2 2026 rose 40.8% year on year to $335.011 million, while revenue grew only 23.2%. As a result, net margin climbed to 55.2% from 48.3% a year earlier. This means each dollar of revenue brought 6.9 percentage points more net profit than a year ago.
EBITDA margin remained virtually unchanged at 65.2% versus 65.4% a year earlier. Thus, the improvement in net margin did not come from operating efficiency but from below the EBITDA line – likely due to a lower effective tax rate or reduced financial expenses. The provided data lack detail on these items, so the exact cause is not disclosed.
Net profit growth of 40.8% against EBITDA growth of 22.9% indicates that the disproportionate effect arose below operating profit. This is a positive signal for shareholders, but its sustainability depends on whether the favourable dynamics in tax and financial items persist in coming quarters.
Operating cash flow for the quarter fell to $128.632 million, though it was $795.9 million over the trailing twelve months
In Q2 2026, operating cash flow was $128.632 million, down 41.6% from $220.16 million in Q2 2025. This is a sharp slowdown compared with Q1 2026, when the flow was $311.063 million. However, over the trailing twelve months, operating cash flow was $795.9 million, which remains a solid figure.
Capital expenditure remains minimal at $0.683 million for the quarter, typical for an exchange business with low capital intensity. This means almost the entire operating flow converts into free cash flow available for dividends and other corporate purposes.
The decline in quarterly flow may be related to changes in working capital, but the provided data do not detail the reasons. It is important to note that for an exchange, operating cash flow can fluctuate due to client balances and central counterparty positions, so quarterly volatility does not necessarily signal problems.
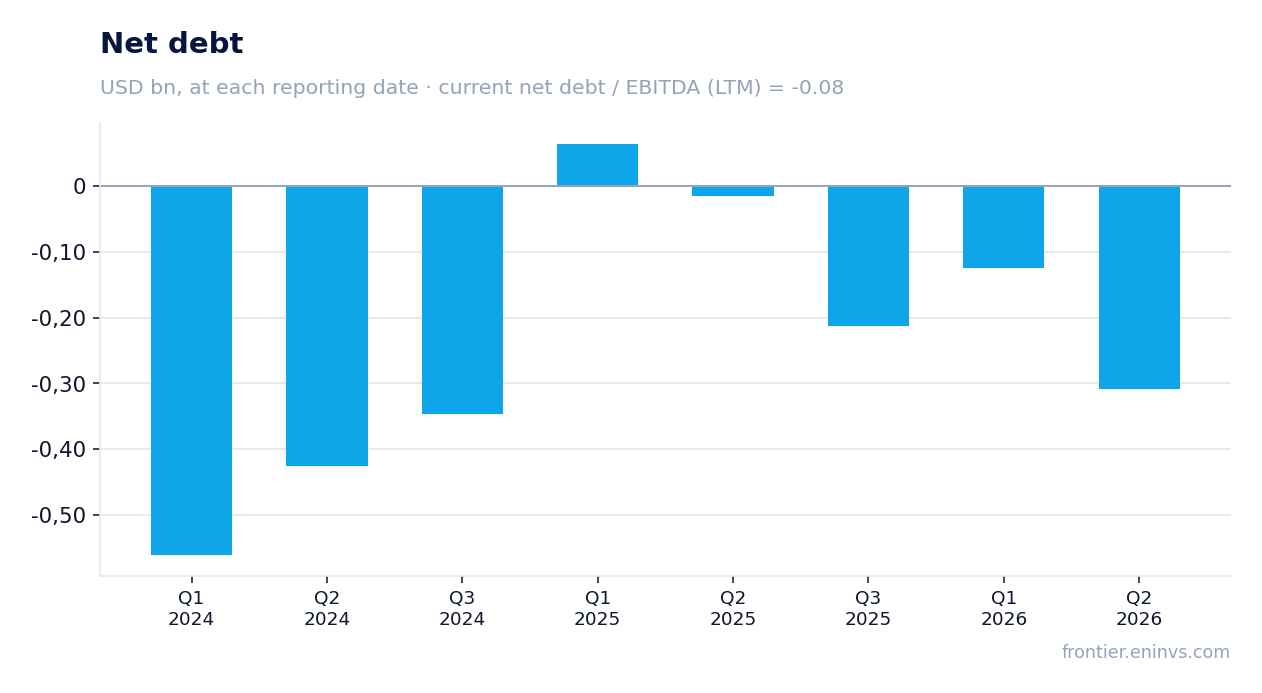
Net debt remains negative at $309.04 million, with net debt/EBITDA LTM at -0.08
As of the end of Q2 2026, B3 Exchange's net debt was minus $309.04 million, meaning cash exceeds debt obligations. The net debt/EBITDA LTM ratio is -0.08. This is a very low leverage level; effectively, the company has a net cash position.
Compared with the previous reporting date, net debt decreased by RUB 0.2 billion, and over the trailing twelve months by RUB 0.3 billion. A negative net debt means the company has no debt servicing issues, and interest expenses are likely minimal or absent.
Such financial stability allows B3 Exchange to direct a significant portion of profit to dividends or development investments without borrowing. This is an important factor in assessing the attractiveness of the shares.
Trailing twelve-month dividend yield is 4.33%, above the key rate
B3 Exchange's dividend yield over the trailing twelve months is 4.33%. This is above the current key rate, making the share attractive for income-oriented investors. The company pays dividends regularly, and with no debt burden, the payout ratio can remain high.
Our estimate for the current year's dividend assumes a conservative payout ratio in line with previous periods. With LTM net profit of $1,032.2 million and a payout ratio of about 50%, the annual dividend could be around $516 million, which at the current market capitalisation of $17,484.27 million gives a yield of about 2.95%. However, this estimate is sensitive to the base-period profit and possible one-off factors.
The main risk to the dividend is a decline in net profit, for example due to higher operating expenses or a change in the tax regime. In addition, if the company decides to allocate more funds to development, the payout ratio could be revised downwards.
EV/EBITDA LTM of 12.3 and P/E LTM of 16.9 do not look stretched for a company with a 65.2% EBITDA margin
Currently, B3 Exchange's EV/EBITDA LTM is 12.3 and P/E LTM is 16.9. For a company with a 65.2% EBITDA margin and stable revenue growth, these multiples look moderate. Market capitalisation is $17,484.27 million, and the net cash position reduces EV relative to market cap.
A comparison with its own three-year history would be useful, but the provided data lack a three-year average for these multiples. Therefore, we limit ourselves to stating current levels. At the same time, ROE is 36.56%, indicating high capital efficiency.
The portal's model estimates 17% upside to fair value. This is our own estimate based on EBITDA growth and a target multiple, and it is not a market consensus. If the company continues to deliver profit growth and maintain margins, the current valuation may prove conservative.
The portal's model estimates 17% upside to fair value
According to the portal's model, the fair value of B3 Exchange shares is 17% above the current market price. This estimate is based on EBITDA growth and a target multiple that we apply to the company. It reflects our view of the fundamental value of the business, not short-term market fluctuations.
The 17% upside combined with a 4.33% dividend yield gives a total expected return of about 21% per annum, which looks attractive against the current key rate. However, this estimate is sensitive to assumptions about future EBITDA growth and may be revised if market conditions change.
It is important to emphasise that the portal's model is our internal tool, and it does not account for possible one-off factors or regulatory changes. Nevertheless, the current multiples and the company's financial stability support this estimate.
Valuation on the latest reported figures
| Metric | Value |
|---|---|
| Market cap | 17.5 bn USD |
| P/E (LTM) | 16.9 |
| EV/EBITDA (LTM) | 12.3 |
| P/B | 5.48 |
| Net debt / EBITDA (LTM) | -0.08 |
| Operating cash flow (LTM) | 0.80 bn |
| ROE | 36.6% |
| Dividend yield (12m) | 4.3% |
Bottom line
B3 Exchange reported Q2 2026 results with strong profit growth of 40.8% and net margin expansion to 55.2%, supported by favourable dynamics below the operating line. However, revenue declined 4.9% quarter on quarter, and operating cash flow fell to $128.632 million, raising questions about earnings quality. The company maintains a net cash position and high EBITDA margin, while the 4.33% dividend yield exceeds the key rate. In our view, the share looks attractive: EV/EBITDA of 12.3 and P/E of 16.9 are moderate, and the portal's model points to 17% upside. The key question for a holder is whether the company can restore quarterly cash flow and sustain margins amid decelerating annual revenue growth.
Open the company's financial profile B3 →
See also: market overview · valuation map · stock screeners