Braskem: Q2 2026 profit of $654.4m rests on margin recovery, not cash flow
Braskem's Q2 2026 results showed a sharp reversal: revenue rose 33.5% year on year to $4,276.2m, EBITDA reached $1,026.6m, and net profit was $654.4m versus a loss a year earlier. EBITDA margin climbed to 24.0% from 4.1%, and net margin to 15.3% from -2.2%. However, operating cash flow remained negligible at $5.7m, while net debt of $8,548.1m and a net debt/EBITDA LTM ratio of 7.38 leave the sustainability of this turnaround in question. At the current price, the stock looks neutral: profit and margin have recovered, but cash flow and leverage do not justify a higher rating.
Key takeaways
— Q2 2026 revenue rose 33.5% year on year to $4,276.2m, but this is a recovery from a weak Q2 2025 when it was $3,202.8m.
— Q2 2026 EBITDA was $1,026.6m with a 24.0% margin versus 4.1% a year earlier, indicating a sharp improvement in profitability.
— Q2 2026 net profit reached $654.4m, but operating cash flow was only $5.7m, meaning profit is not converting into cash.
— Net debt at the end of Q2 2026 was $8,548.1m, and the net debt/LTM EBITDA ratio was 7.38, limiting financial flexibility.
— LTM operating cash flow was negative at -$767.0m, while Q2 2026 capex was low at $96.3m.
— EV/EBITDA LTM is 8.18, which offers no clear advantage without a historical average, which is not in the facts.
— Return on equity is negative at -90.1%, reflecting accumulated losses from prior periods.
Attractiveness
Key figures, USD bn
| Metric | Q2 2025 | Q2 2026 | Change |
|---|---|---|---|
| Revenue | 3.20 | 4.28 | +33.5% |
| EBITDA | 0.13 | 1.03 | +678.7% |
| Operating profit | -0.09 | 0.80 | в прибыль |
| Net profit | -0.07 | 0.65 | в прибыль |
| Operating cash flow | -0.05 | 0.01 | в прибыль |
| Capex | 0.12 | 0.10 | -17.1% |
| EBITDA margin | 4.1% | 24.0% | +19.9 pp |
| Net margin | -2.2% | 15.3% | +17.5 pp |
Q2 2026 revenue rose 33.5% year on year to $4,276.2m, but this is a recovery from a weak Q2 2025 when it was $3,202.8m.
Braskem's Q2 2026 revenue was $4,276.2m, up 33.5% from $3,202.8m in Q2 2025. This is the highest quarterly figure in at least two years: in prior quarters revenue did not exceed $3,690.2m in Q3 2024.
The year-on-year growth is mainly explained by the low base of Q2 2025, when revenue fell 5.8% year on year. In Q1 2026 revenue also declined by 10.9% year on year to $3,086.8m, so the current growth looks like a rebound rather than a sustainable acceleration.
Sequentially, Q2 2026 revenue rose 38.5% from Q1 2026, which may indicate seasonal demand recovery or one-off factors not disclosed in the facts.
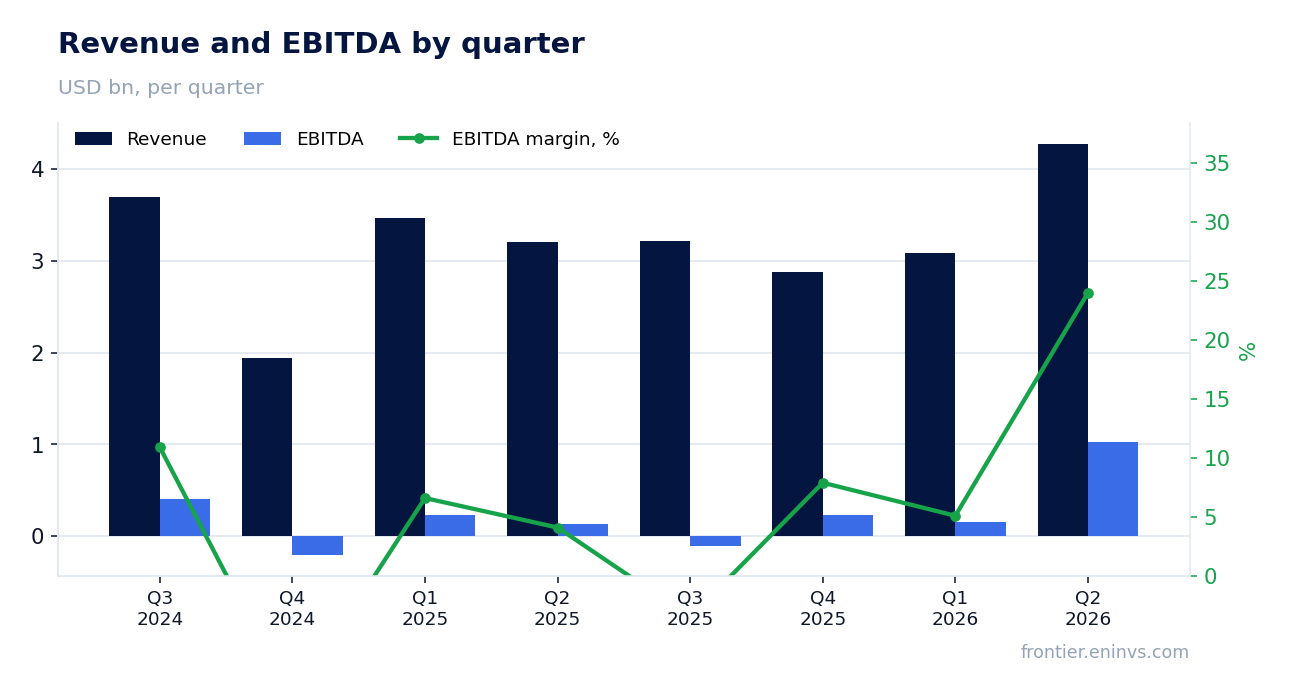
Q2 2026 EBITDA was $1,026.6m with a 24.0% margin versus 4.1% a year earlier, indicating a sharp improvement in profitability.
Q2 2026 EBITDA reached $1,026.6m, 7.8 times the $131.8m in Q2 2025. The EBITDA margin rose to 24.0% from 4.1% a year earlier.
Such a margin increase could be due to lower costs or improved pricing, but the facts do not provide a breakdown of expenses. Operating profit in Q2 2026 was $798.3m versus a loss of $90.0m a year earlier, confirming a significant improvement in operating efficiency.
For comparison, in Q1 2026 EBITDA was $156.3m with a margin of about 5.1%. Thus, Q2 was a sharp improvement, but the sustainability of this level is not yet confirmed.
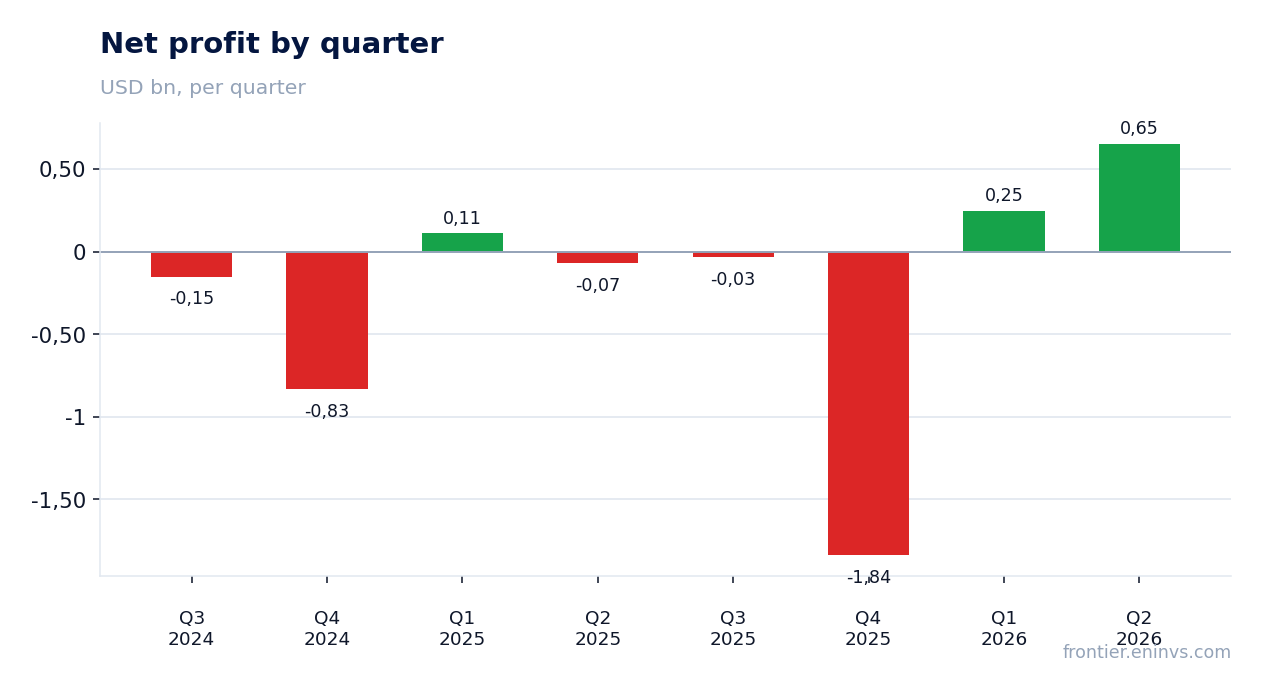
Q2 2026 net profit reached $654.4m, but operating cash flow was only $5.7m, meaning profit is not converting into cash.
Q2 2026 net profit was $654.4m versus a loss of $70.0m in Q2 2025. However, operating cash flow for the same quarter was only $5.7m, significantly below profit.
The gap between profit and cash flow may be due to working capital increases or non-cash items, but the facts do not provide details. For H1 2026, operating cash flow was negative at -$841.1m, indicating a systematic shortfall in cash from operations.
Over the last 12 months, operating cash flow was -$767.0m. This means the company is not generating enough cash to cover capex and debt servicing, which is a serious risk.
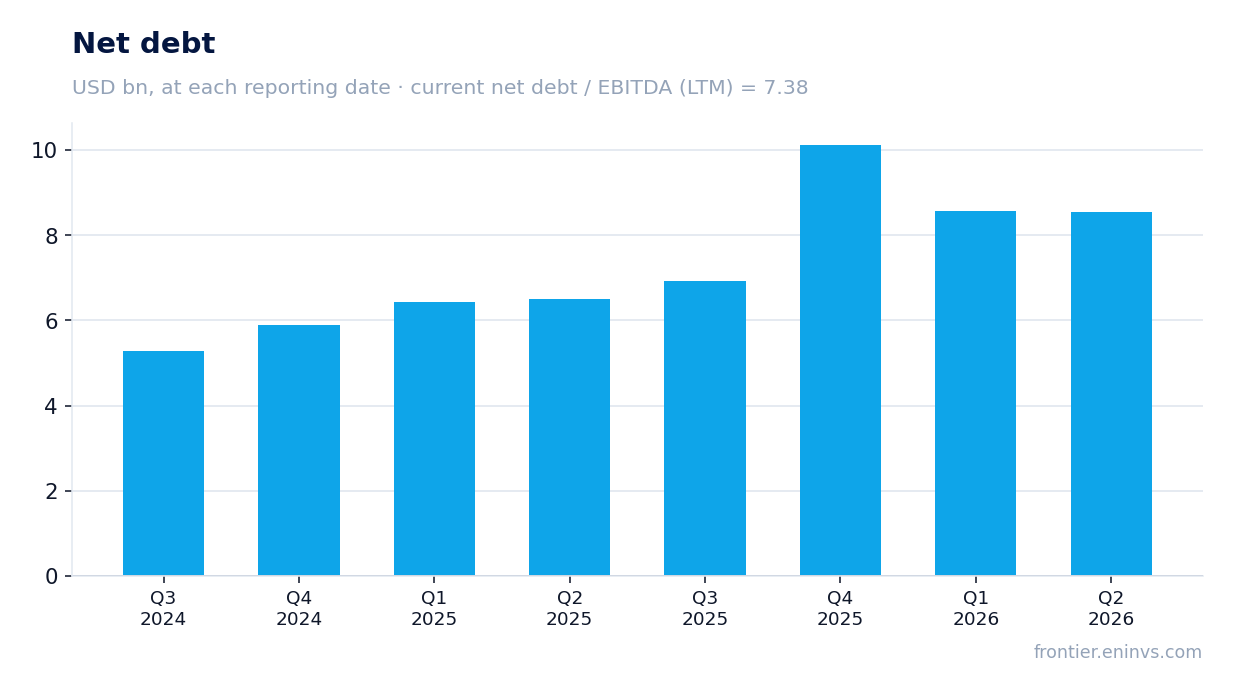
Net debt at the end of Q2 2026 was $8,548.1m, and the net debt/LTM EBITDA ratio was 7.38, limiting financial flexibility.
Braskem's net debt at the end of Q2 2026 was $8,548.1m, up $2,043.6m from $6,504.5m a year earlier. The net debt/LTM EBITDA ratio was 7.38.
Such a high level of debt relative to EBITDA limits the company's ability to raise new financing and increases risks if market conditions deteriorate. For comparison, in Q4 2025 net debt reached $10,129.2m but then declined.
Interest expenses are not disclosed in the facts, but at this debt level they could significantly erode profit. The company needs either to grow EBITDA or reduce debt to lower the burden.
LTM operating cash flow was negative at -$767.0m, while Q2 2026 capex was low at $96.3m.
LTM operating cash flow was -$767.0m, meaning the company spends more cash than it generates from operations. Q2 2026 capex was $96.3m, below the level of previous quarters (e.g., $235.6m in Q3 2025).
Low capex may be temporary, but it does not offset negative operating cash flow. In Q1 2026, capex was $130.5m and operating cash flow was -$846.8m.
Negative cash flow forces the company to fund operations through debt or asset sales, increasing risks. Without improvement in operating cash flow, the sustainability of the business remains in question.
EV/EBITDA LTM is 8.18, which offers no clear advantage without a historical average, which is not in the facts.
EV/EBITDA for the last 12 months is 8.18. This is a moderate level, but without a three-year historical average it is impossible to assess whether the company is cheap or expensive relative to its own history.
Braskem's market capitalisation is $797.0m, very small compared to net debt of $8,548.1m. This means that most of the company's value is in debt, not equity.
With such high debt and negative cash flow, the EV/EBITDA multiple may be deceptively low, as it does not account for refinancing risk and the ability to generate free cash flow.
Return on equity is negative at -90.1%, reflecting accumulated losses from prior periods.
Return on equity (ROE) is -90.1%, indicating that the company is loss-making and destroying shareholder value. This is due to large losses in previous quarters, especially in Q4 2025 when net loss was $1,838.5m.
Negative ROE despite positive net profit in Q2 2026 is explained by the fact that profit over the last 12 months is still negative. The cumulative net loss over the last 12 months was about $968.1m, which outweighs the Q2 profit.
To restore ROE, the company needs not only to maintain profitability but also to offset accumulated losses. This could take several quarters even under favourable conditions.
Valuation on the latest reported figures
| Metric | Value |
|---|---|
| Market cap | 0.80 bn USD |
| EV/EBITDA (LTM) | 8.2 |
| Net debt / EBITDA (LTM) | 7.38 |
| Operating cash flow (LTM) | -0.77 bn |
| ROE | -90.1% |
Bottom line
In Q2 2026 Braskem showed a sharp improvement in financial results: revenue rose 33.5% year on year, EBITDA reached $1,026.6m, and net profit was $654.4m. However, this improvement is not supported by cash flow: operating cash flow for the quarter was only $5.7m, and over the last 12 months it was -$767.0m. Net debt of $8,548.1m and a net debt/EBITDA ratio of 7.38 remain high, limiting room for manoeuvre. At the current price, the stock looks neutral: positive changes in reported profit are offset by weak cash flow and debt burden. A sustained positive operating cash flow and debt reduction are needed for a higher rating.
Open the company's financial profile BAK →
See also: market overview · valuation map · stock screeners