Bradesco: profit up 29.6%, but the entire gain was consumed by 110bn debt

Bradesco reported Q2 2026 results. Revenue rose 29.6% year-on-year to 15,182.0mn, net profit also rose 29.6% to 1,426.9mn, while the net margin remained at 9.4%. At the same time, net debt reached 109,923.2mn, and operating cash flow in the second quarter was negative at -10,356.7mn. In our view, the share looks unattractive: the EV/EBITDA LTM multiple stands at 29.5, well above historical levels, and the portal's model implies a -53% downside to fair value.
Key takeaways
— Revenue rose 29.6% year-on-year, but the entire gain went into debt growth, not cash
— Net margin remained at 9.4%, even though profit rose 29.6%
— Operating cash flow in the second quarter was negative at -10,356.7mn
— Net debt reached 109,923.2mn, with a net debt/EBITDA LTM ratio of 21.35
— Dividend yield of 8.5% looks less attractive against the current key rate
— EV/EBITDA LTM of 29.5 is multiples above historical levels, leaving no room for upside
— The portal's model implies a -53% downside to fair value
Attractiveness
Key figures, USD bn
| Metric | Q2 2025 | Q2 2026 | Change |
|---|---|---|---|
| Revenue | 11.7 | 15.2 | +29.6% |
| Operating profit | 0.78 | 1.44 | +86.1% |
| Net profit | 1.10 | 1.43 | +29.6% |
| Operating cash flow | 7.13 | -10.4 | -245.2% |
| Capex | 0.52 | 0.40 | -21.8% |
| Net margin | 9.4% | 9.4% | +0.0 pp |
Revenue rose 29.6% year-on-year, but the entire gain went into debt growth, not cash
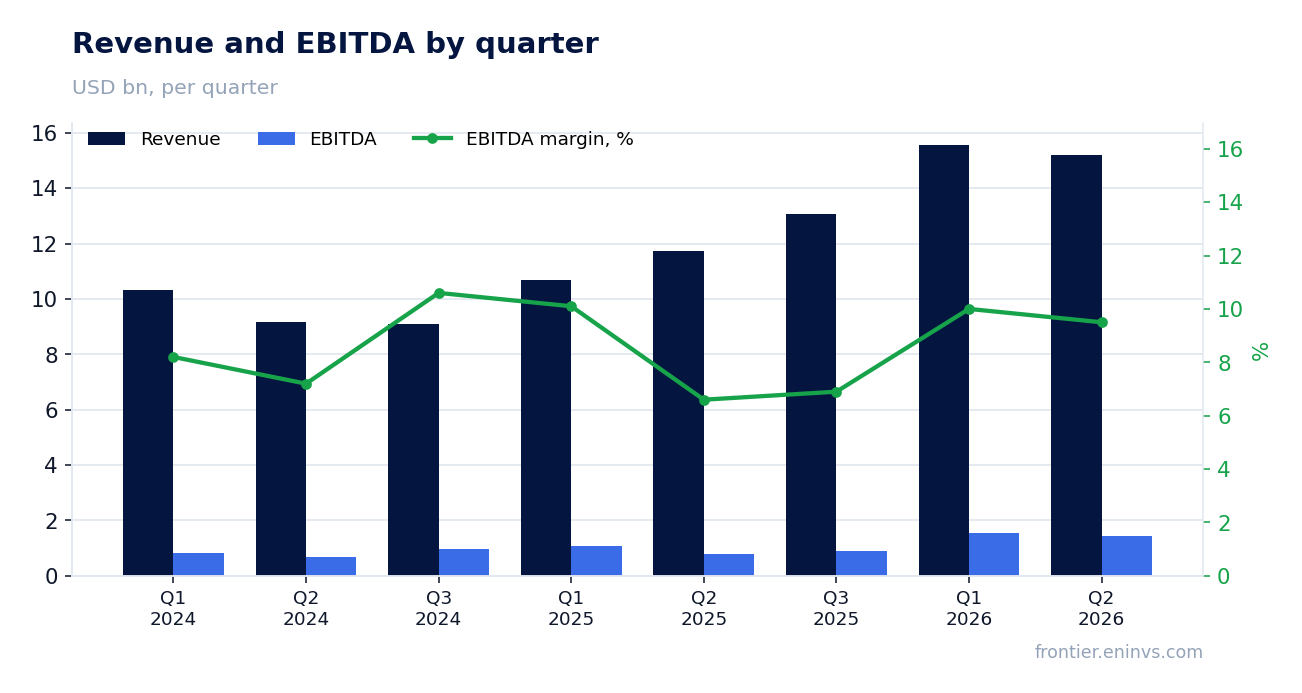
In Q2 2026, Bradesco's revenue reached 15,182.0mn, up 29.6% year-on-year. This continues a strong growth trend: in Q1 2026 revenue rose 45.5%, and in Q4 2025 it rose 43.5%. However, acceleration has given way to deceleration: from nearly 46% in Q1 to 29.6% in Q2.
The main issue is that this growth does not convert into cash. Operating cash flow in Q2 was negative at -10,356.7mn, whereas a year earlier it was positive at 7,132.1mn. The swing is over 17bn. This means revenue growth is being financed by debt rather than internal generation.
Net debt at the end of Q2 reached 109,923.2mn, up 17.0bn from the previous reporting date and up 34.7bn over 12 months. Debt is growing faster than revenue, putting pressure on future interest payments and limiting investment capacity.
Net margin remained at 9.4%, even though profit rose 29.6%
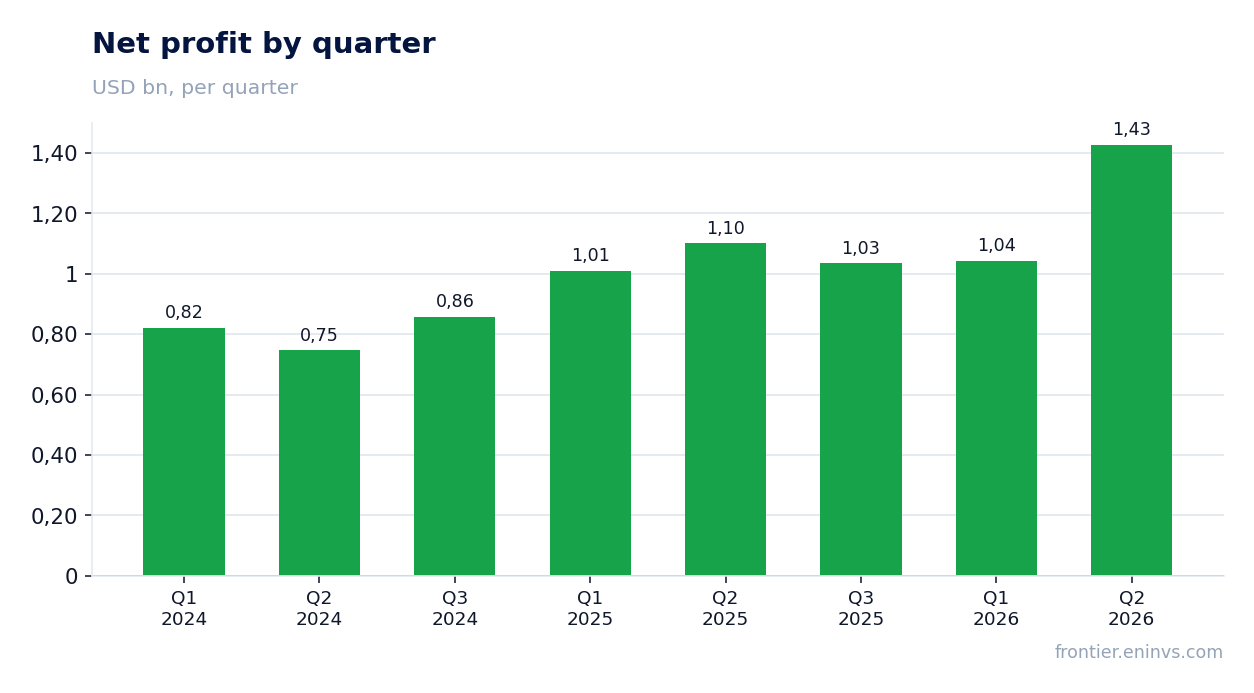
Net profit in Q2 2026 was 1,426.9mn, up 29.6% year-on-year. The net margin remained at 9.4%, exactly the same as a year earlier. This means profit growth was proportional to revenue growth but was not accompanied by efficiency gains.
EBITDA in Q2 was 1,444.9mn, up 86.1% year-on-year (from 776.5mn). However, the EBITDA margin declined: from 6.6% a year ago to 9.5% now. EBITDA growth outpaced revenue growth, but this is due to a low base last year when the metric was depressed.
Importantly, net profit over the last 12 months was 4,727.1mn, while EBITDA LTM was 4,571.8mn. At the same time, operating cash flow over the last 12 months was negative at -11,400.0mn. This means even the accumulated annual profit is not backed by cash flow.
Operating cash flow in the second quarter was negative at -10,356.7mn
Operating cash flow in Q2 2026 was -10,356.7mn, whereas a year earlier it was positive at 7,132.1mn. This is a sharp deterioration that cannot be explained by seasonality, since in Q1 2026 the flow was positive at 17,177.3mn. Thus, in Q2 the company spent more than it earned.
Negative operating cash flow means the company cannot fund its operations from internal resources. This forces it to increase debt: net debt rose by 17.0bn in the quarter. If this dynamic persists, leverage will continue to rise.
Capital expenditure in Q2 was 404.9mn, down 21.8% from 517.8mn a year earlier. The decline in capex against negative operating flow may indicate an attempt to save, but it does not solve the problem fundamentally.
Net debt reached 109,923.2mn, with a net debt/EBITDA LTM ratio of 21.35
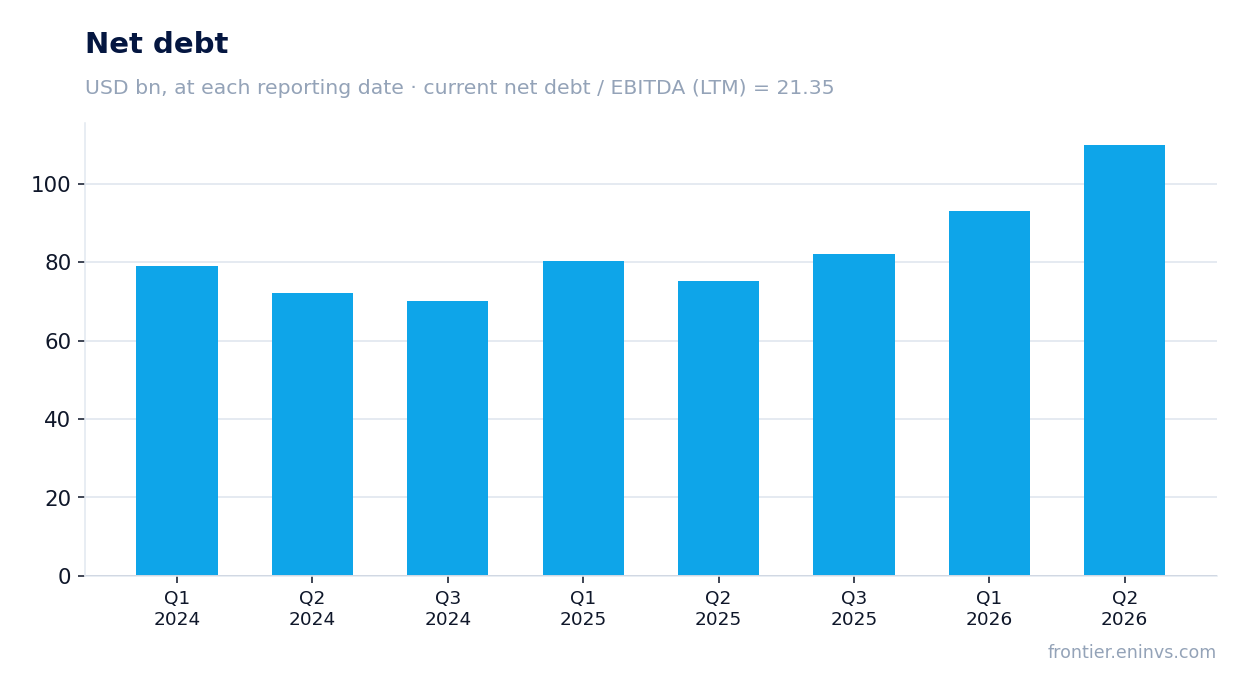
Bradesco's net debt at the end of Q2 2026 was 109,923.2mn. This is 17.0bn more than at the previous reporting date and 34.7bn more than a year earlier. The net debt/EBITDA LTM ratio is 21.35, a very high level indicating significant leverage.
For comparison, the company's market capitalisation is 37,396.3mn, meaning debt is almost three times the market cap. This creates serious risks for shareholders, especially if profit does not grow fast enough to service the debt.
Interest expenses are not disclosed in the provided data, but at this debt level they must be significant. The company spends part of its revenue on debt servicing, limiting its capacity for investment and dividend payments.
Dividend yield of 8.5% looks less attractive against the current key rate
Bradesco's dividend yield over the last 12 months is 8.5%. This is above the market average, but with the current key rate remaining high, such a yield does not look attractive. Investors can get higher yields with lower risk, for example, in government bonds.
The company did not disclose the size of the last dividend or the year for which it was paid. However, given negative operating cash flow and rising debt, the likelihood of maintaining dividend payments at the current level is decreasing. If the company continues to spend more than it earns, it will have to either cut dividends or increase debt.
We cannot make a forecast for the dividend for the current year due to the lack of data on the payout ratio and the profit from which dividends are paid. But it is obvious that with negative cash flow, dividend payments are financed by borrowed funds, which is not sustainable.
EV/EBITDA LTM of 29.5 is multiples above historical levels, leaving no room for upside
Bradesco's EV/EBITDA LTM is 29.5. This is a very high level, significantly above historical values. For comparison, P/E LTM is 7.9, which may seem low, but this is because profit includes one-off factors and the debt burden is huge.
The company's market capitalisation is 37,396.3mn, and net debt is 109,923.2mn. Thus, EV (enterprise value) is about 147bn. With EBITDA LTM of 4,571.8mn, this gives a multiple of 29.5. Such a high multiple means the market values the company very expensively relative to its operating profit.
Compared to historical levels: if EV/EBITDA previously ranged from 5-10, the current value of 29.5 looks anomalously high. This leaves no room for share price growth, even if profit continues to rise.
The portal's model implies a -53% downside to fair value
According to the portal's model, which compares EBITDA growth with a target multiple and market capitalisation, the upside to fair value is -53%. This means that, in our view, the share is overvalued by more than twice relative to its fundamentally justified value.
The model takes into account current EBITDA growth, but even under optimistic assumptions about future growth, the current price is not justified. High debt and negative cash flow make the company vulnerable to any negative market changes.
We do not provide a target price, but we note that our model sees no reason to buy the shares at current levels. A change in valuation would require sustainable cash flow growth and a reduction in debt burden.
Valuation on the latest reported figures
| Metric | Value |
|---|---|
| Market cap | 37.4 bn USD |
| P/E (LTM) | 7.9 |
| EV/EBITDA (LTM) | 29.5 |
| P/B | 0.46 |
| Net debt / EBITDA (LTM) | 21.35 |
| Operating cash flow (LTM) | -11.4 bn |
| ROE | 6.3% |
| Dividend yield (12m) | 8.5% |
Bottom line
Bradesco showed revenue and profit growth of 29.6% year-on-year, but this growth is not backed by cash flow. Operating flow is negative, debt is rising, and profitability is not improving. The dividend yield of 8.5% looks insufficient compensation for the risks associated with leverage. The EV/EBITDA multiple of 29.5 leaves no room for upside, and the portal's model indicates a -53% downside. We consider the share unattractive at current levels.
Open the company's financial profile BBDC →
See also: market overview · valuation map · stock screeners