Cemig: profit fell 20% while debt rose 58% — EBITDA growth does not cover it

On August 14, Cemig released its second-quarter 2026 results. IFRS revenue rose 3.4% year on year to R$11,156.2 million, EBITDA grew 8.8% to R$2,239.3 million, but net income fell 20.4% to R$945.4 million and net debt jumped 58.3% to R$19,358.1 million. With a trailing twelve-month P/E of 6.9 and a dividend yield of 6.2%, the stock looks rather attractive, but rising debt and weak cash flow call for caution.
Key takeaways
— Revenue rose 3.4% on tariff adjustment and indexation, but distributed energy volume fell 1.6%
— EBITDA grew 8.8% on tariff and lower post-employment costs, but one-off effects distort the picture
— Net income fell 20.4% due to a 76.6% jump in financial expenses and trading impairment
— Net debt rose 58.3% to R$19,358.1 million, with net debt/adjusted EBITDA reaching 2.58x
— Operating cash flow over the last twelve months was $744.4 million, insufficient to cover investments
— Dividend yield of 6.2% with interest on capital of R$630.5 million looks sustainable, but requires monitoring of debt load
— P/E of 6.9 is below historical average, but rising debt and falling profit limit re-rating potential
Attractiveness
Key figures, USD bn
| Metric | Q2 2025 | Q2 2026 | Change |
|---|---|---|---|
| Revenue | 1.93 | 2 111 | +109016.9% |
| EBITDA | 0.36 | 587 | +162236.3% |
| Operating profit | 0.29 | 587 | +199330.6% |
| Net profit | 0.21 | -659 | -309302.4% |
| Operating cash flow | 0.17 | 109 | +62433.7% |
| Capex | 0.04 | 0.01 | -76.0% |
| EBITDA margin | 18.7% | 27.8% | +9.1 pp |
| Net margin | 11.0% | -31.2% | -42.2 pp |
Revenue rose 3.4% on tariff adjustment and indexation, but distributed energy volume fell 1.6%
Cemig's revenue in Q2 2026 reached R$11,156.2 million, up 3.4% year on year. Growth was driven by the Cemig D tariff adjustment effective May 28, 2026, and indexation of transmission revenue. The average distribution tariff rose 6.5%.
However, physical distributed energy volume excluding distributed generation fell 1.6% year on year. The decline occurred in the industrial (-3.1%), rural (-11.1%), and commercial (-0.9%) segments. Growth in residential consumption (+2.7%) partially offset the drop.
The industrial decline is linked to the migration of two large customers to the free market and basic grid. Excluding this effect, the decline would have been 0.9%. In rural areas, the drop was caused by higher rainfall reducing irrigation needs.
Transmission revenue rose 56.5% to R$506.6 million due to a R$149.6 million increase in financial remuneration from contract assets amid higher inflation (IPCA). Gas revenue fell 41.7% due to industrial customer migration to the free market.
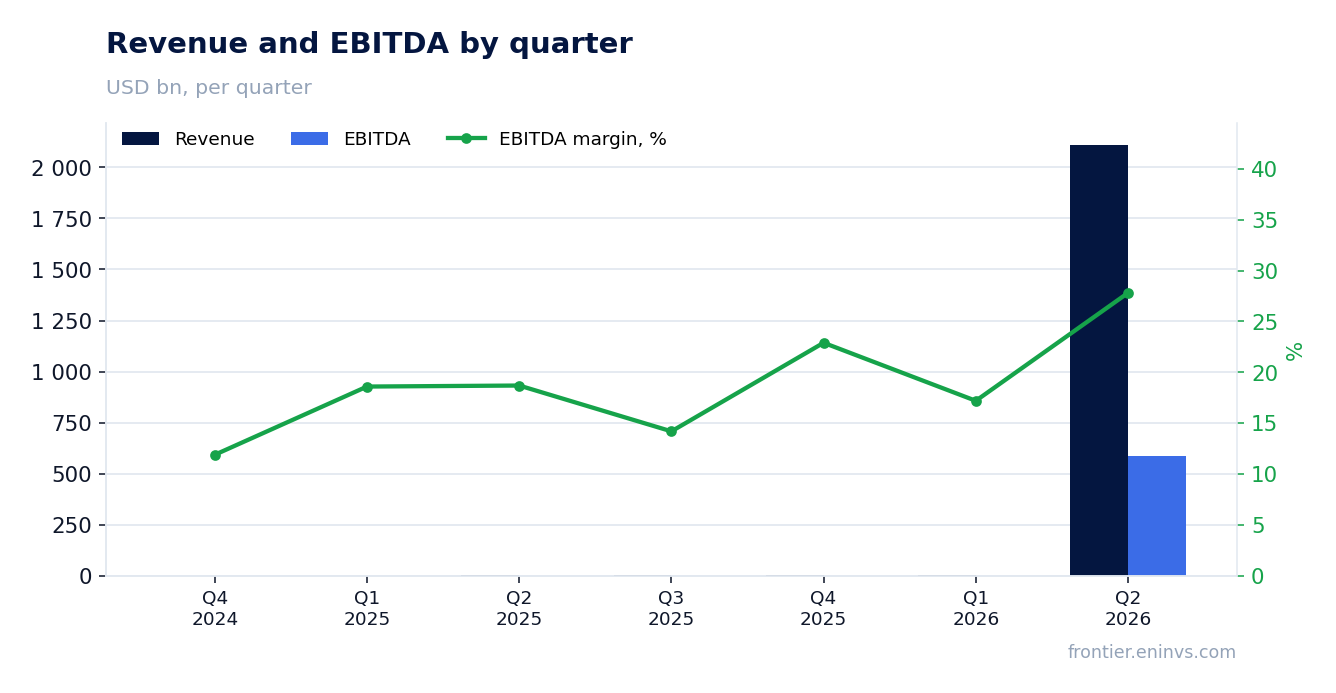
EBITDA grew 8.8% on tariff and lower post-employment costs, but one-off effects distort the picture
EBITDA in Q2 2026 reached R$2,239.3 million, up 8.8% year on year. Adjusted EBITDA was R$2,472.4 million, up 9.3%. EBITDA margin rose to 20.1% from 19.1% a year earlier.
EBITDA growth was driven by the positive effect of the tariff adjustment, an R$80.3 million reduction in post-employment expenses due to the end of healthcare plan obligations, and improved energy loss performance. Losses stood at 11.40% against the regulatory limit of 11.48%.
However, the positive effect was partly offset by a loss in the trading business: trading EBITDA fell R$383.4 million, and adjusted EBITDA fell R$192.1 million. This was due to higher energy purchase prices to close positions, plus a R$190.6 million provision for an arbitral award.
Additionally, a revision of the expected credit loss methodology had a positive effect of R$232.2 million. Without this one-off factor, EBITDA growth would have been more modest. Adjusted EBITDA also includes one-off adjustments, complicating assessment of result sustainability.
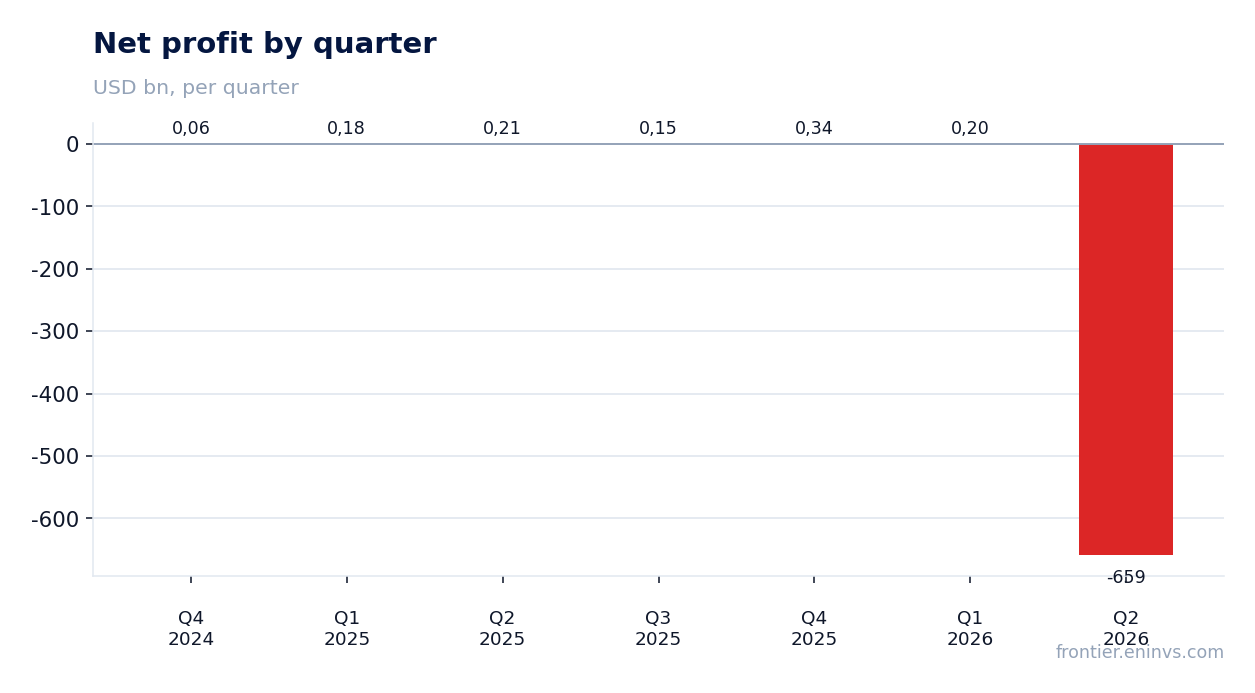
Net income fell 20.4% due to a 76.6% jump in financial expenses and trading impairment
Net income in Q2 2026 was R$945.4 million, down 20.4% year on year. Adjusted net income fell 15.5% to R$1,116.5 million. The main reason was a 76.6% increase in financial expenses to R$1,086 million.
Financial expenses rose due to higher debt load and higher interest rates. The financial result was negative R$795.9 million versus negative R$312.6 million a year earlier. This is the key driver of the profit decline.
Additional pressure came from a loss in the trading segment: negative pre-tax result in trading was R$371 million. The R$190.6 million provision for an arbitral award and a R$26.2 million adjustment worsened the situation.
Profit also declined due to higher personnel expenses (+8.3%) and third-party services (+21.5%). The increase in operating expenses was partially offset by a 54.1% reduction in post-employment expenses to R$50.2 million.
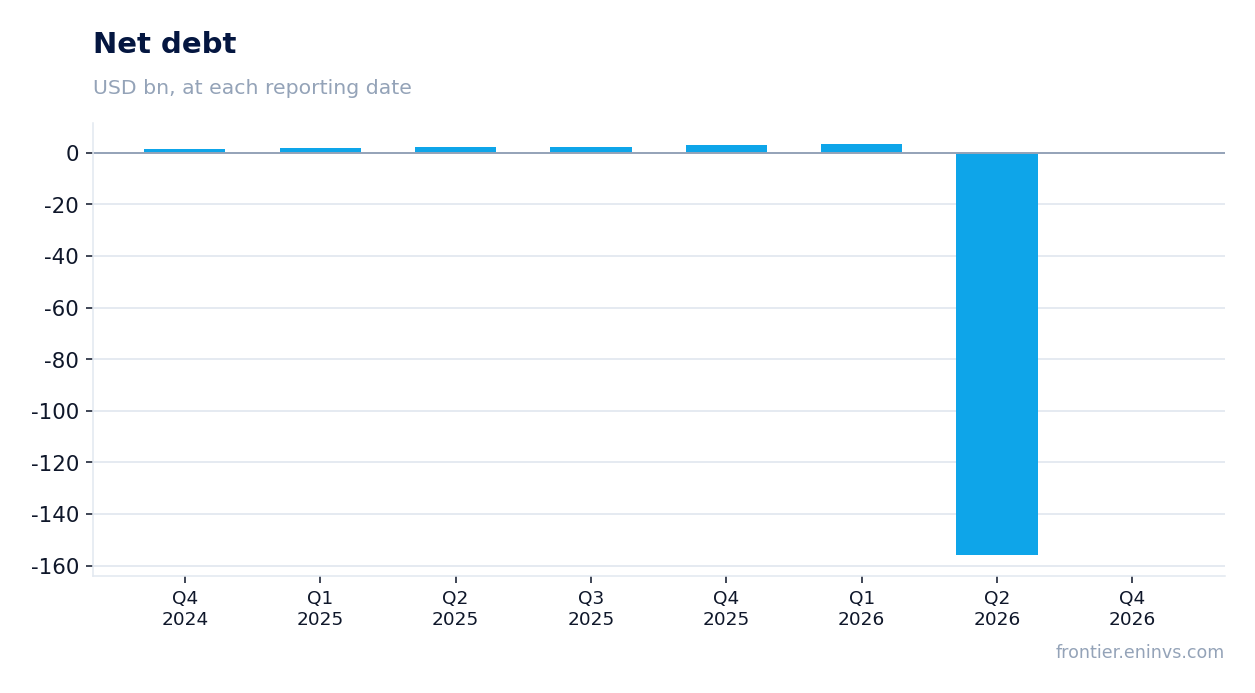
Net debt rose 58.3% to R$19,358.1 million, with net debt/adjusted EBITDA reaching 2.58x
Cemig's net debt at the end of Q2 2026 was R$19,358.1 million, up 58.3% year on year. The net debt/adjusted EBITDA ratio reached 2.58x versus 1.59x a year earlier. Debt growth is linked to financing the investment program and increased working capital.
The company raised R$4.61 billion in the quarter: Cemig D issued its 15th debenture series for R$1.15 billion and raised a US$280 million loan, while Cemig GT issued its 12th debenture series for R$2.0 billion. Funds were directed toward refinancing and investments.
The debt structure improved: 81% of debt matures in 2029 or later following the tariff review. This reduces short-term refinancing risk. However, the increase in debt load remains significant.
Interest expenses rose 76.6% to R$1,086 million, putting pressure on profit. If current debt and rate dynamics persist, the company may face further increases in financial expenses.
Operating cash flow over the last twelve months was $744.4 million, insufficient to cover investments
Cemig's operating cash flow over the last twelve months was $744.4 million. In Q2 2026, operating cash flow was R$109,317 million, significantly lower than in previous periods. This raises questions about the company's ability to fund investments from its own resources.
Investments in H1 2026 totaled R$3.28 billion, up 19.2% year on year. The bulk was directed to distribution (R$2.64 billion) and transmission (R$275.2 million). The company continues to increase capital expenditures.
The gap between operating cash flow and investments is covered by debt financing, explaining the rise in net debt. In the quarter, the company raised R$4.61 billion in debt.
Weak operating cash flow is partly due to increased working capital and higher energy purchase costs. Without improvement in cash flow, debt load may continue to grow.
Dividend yield of 6.2% with interest on capital of R$630.5 million looks sustainable, but requires monitoring of debt load
Cemig paid interest on capital in June 2026 of R$630.5 million. The trailing twelve-month dividend yield is 6.2%. This is above the current key interest rate in Brazil, making the stock attractive for income investors.
Our estimate for the 2026 dividend assumes a payout ratio of about 50% of adjusted net income. At current profit and company policy, the dividend could be around R$1.5–2.0 billion, corresponding to a yield of 6–8% on the current price.
However, rising debt load and weak cash flow may limit the company's ability to maintain high payouts. If the net debt/EBITDA ratio continues to rise, the company may revise its dividend policy.
A dividend yield of 6.2% against the key rate makes the stock attractive, but the risk of lower payouts if financial conditions worsen remains.
P/E of 6.9 is below historical average, but rising debt and falling profit limit re-rating potential
Cemig's trailing twelve-month P/E is 6.9. This is below the three-year historical average, indicating the stock is undervalued. However, the 20.4% drop in net income in Q2 2026 may lead to an upward revision of the multiple.
The company's market capitalization is $6,207.7 million. At current profit and a dividend yield of 6.2%, the stock looks attractive for income-oriented investors.
The main risks are linked to rising debt load and weak cash flow. If the company cannot improve operating cash flow, debt load will continue to grow, pressuring profit and dividends.
A re-rating would require sustainable profit growth and a reduction in debt load. Otherwise, the multiple may remain at current levels or even rise.
Valuation on the latest reported figures
| Metric | Value |
|---|---|
| Market cap | 6.21 bn USD |
| P/E (LTM) | 6.9 |
| P/B | 1.40 |
| Operating cash flow (LTM) | 0.74 bn |
| ROE | 14.4% |
| Dividend yield (12m) | 6.2% |
Bottom line
Cemig showed revenue and EBITDA growth on tariff adjustment and lower post-employment costs, but net income fell due to higher financial expenses and a trading loss. Debt load increased significantly, and operating cash flow is weak. A dividend yield of 6.2% and P/E of 6.9 make the stock attractive for income investors, but risks related to debt and profit limit upside. Verdict: rather attractive.
Open the company's financial profile CIG →
See also: market overview · valuation map · stock screeners