Equatorial Energia: double-digit revenue growth but Q2 profit halved
Equatorial Energia reported Q2 2026 results. Revenue grew 17.9% year-on-year to 2,705.5 million, but EBITDA declined 1.5% and net profit fell 44.4%. EBITDA margin narrowed to 25.2% from 30.1% a year earlier. At the current price, the shares look neutral: the business is growing, but profitability and leverage raise questions.
Key takeaways
— Q2 2026 revenue grew 17.9% year-on-year to 2,705.5 million, but this did not translate into profit
— EBITDA declined 1.5% year-on-year, with EBITDA margin falling to 25.2% from 30.1%
— Q2 2026 net profit was 128.6 million, down 44.4% from a year earlier
— Leverage remains high: net debt/EBITDA LTM at 6.21
— Dividend yield over the trailing 12 months is 4.0%
— Valuation: P/E LTM at 27.6, EV/EBITDA LTM at 13.7
— Operating cash flow over the last 12 months was 725.7 million, but capital expenditures in Q2 2026 were negative
Attractiveness
Key figures, USD bn
| Metric | Q2 2025 | Q2 2026 | Change |
|---|---|---|---|
| Revenue | 2.29 | 2.71 | +17.9% |
| EBITDA | 0.69 | 0.68 | -1.5% |
| Operating profit | 0.53 | 0.50 | -6.9% |
| Net profit | 0.23 | 0.13 | -44.4% |
| Operating cash flow | 0.16 | 0.00 | -97.8% |
| Capex | -0.34 | -0.37 | — |
| EBITDA margin | 30.1% | 25.2% | -4.9 pp |
| Net margin | 10.1% | 4.8% | -5.3 pp |
Q2 2026 revenue grew 17.9% year-on-year to 2,705.5 million, but this did not translate into profit
Equatorial Energia's Q2 2026 revenue reached 2,705.5 million, up 17.9% year-on-year. This continues double-digit growth: in Q1 2026 revenue rose 22.0%, and in Q2 2025 it was up 22.8%. The slowdown compared to previous quarters may reflect both a high base effect and changing market conditions.
Despite revenue growth, Q2 2026 net profit fell 44.4% year-on-year to 128.6 million. This means that higher sales did not translate into proportional profit growth. The reason lies in faster cost growth, which led to lower profitability.
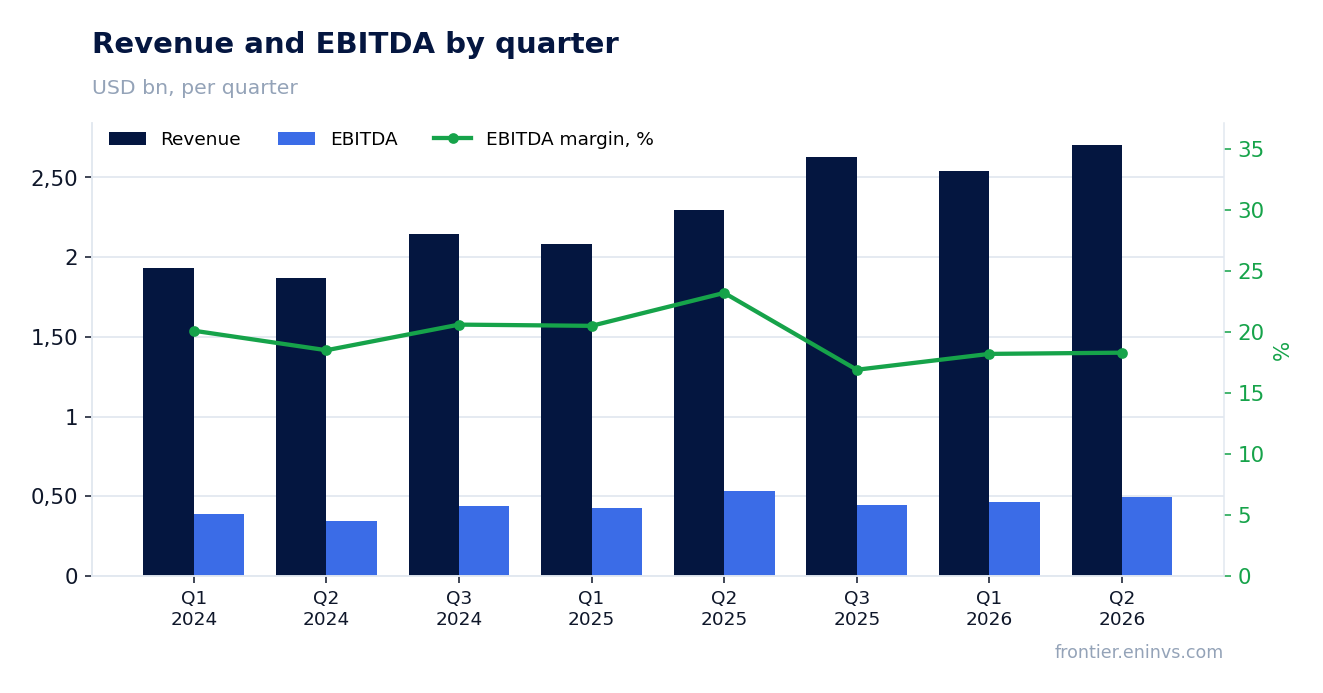
EBITDA declined 1.5% year-on-year, with EBITDA margin falling to 25.2% from 30.1%
Q2 2026 EBITDA was 495.1 million, down 1.5% year-on-year. This decline occurred despite revenue growth, indicating a significant increase in operating costs. EBITDA margin narrowed to 25.2% from 30.1% in the same period last year.
The margin decline may be linked to higher raw material, electricity, or other operating costs. Without additional data, it is difficult to pinpoint a specific factor, but the trend of deteriorating profitability is clear. This is a key risk for the company's future profitability.
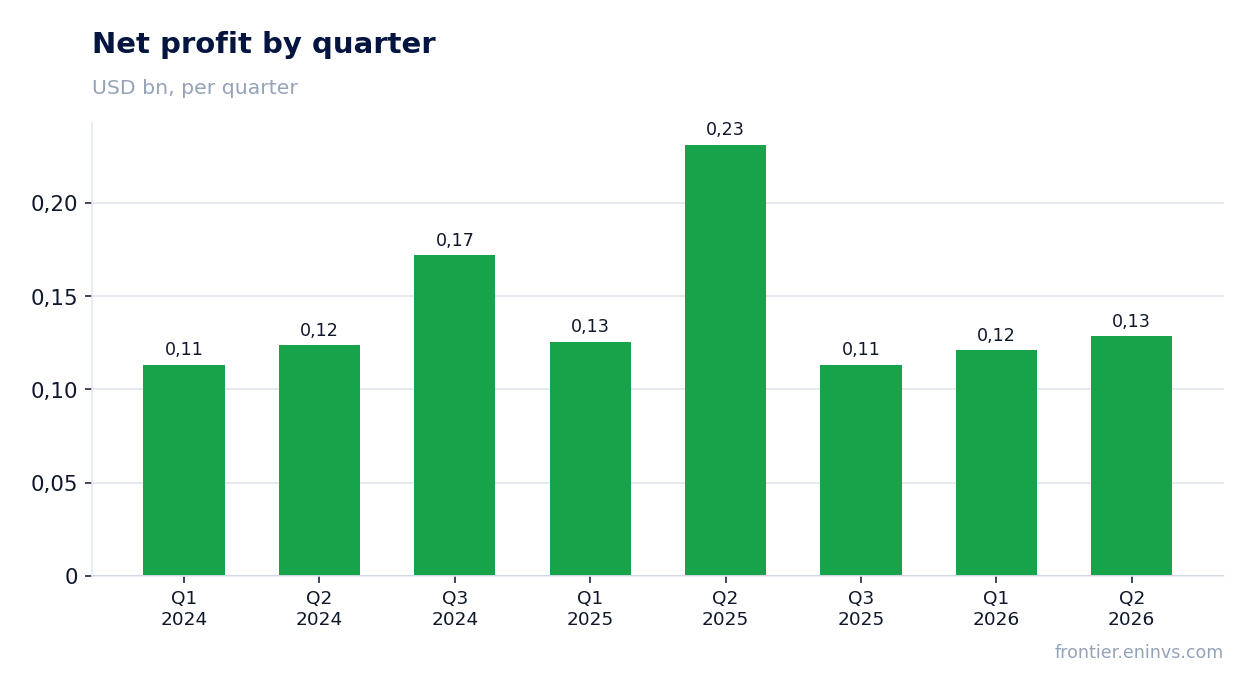
Q2 2026 net profit was 128.6 million, down 44.4% from a year earlier
Q2 2026 net profit fell to 128.6 million, down 44.4% from Q2 2025. Net margin declined to 4.8% from 10.1% a year earlier. This sharp deterioration is linked both to lower EBITDA and possibly higher financial expenses or taxes.
The decline in net profit despite revenue growth is a warning signal. If the company cannot control costs, pressure on profit will persist. It is worth noting that LTM net profit was 349.8 million, but this does not offset the weak quarterly results.
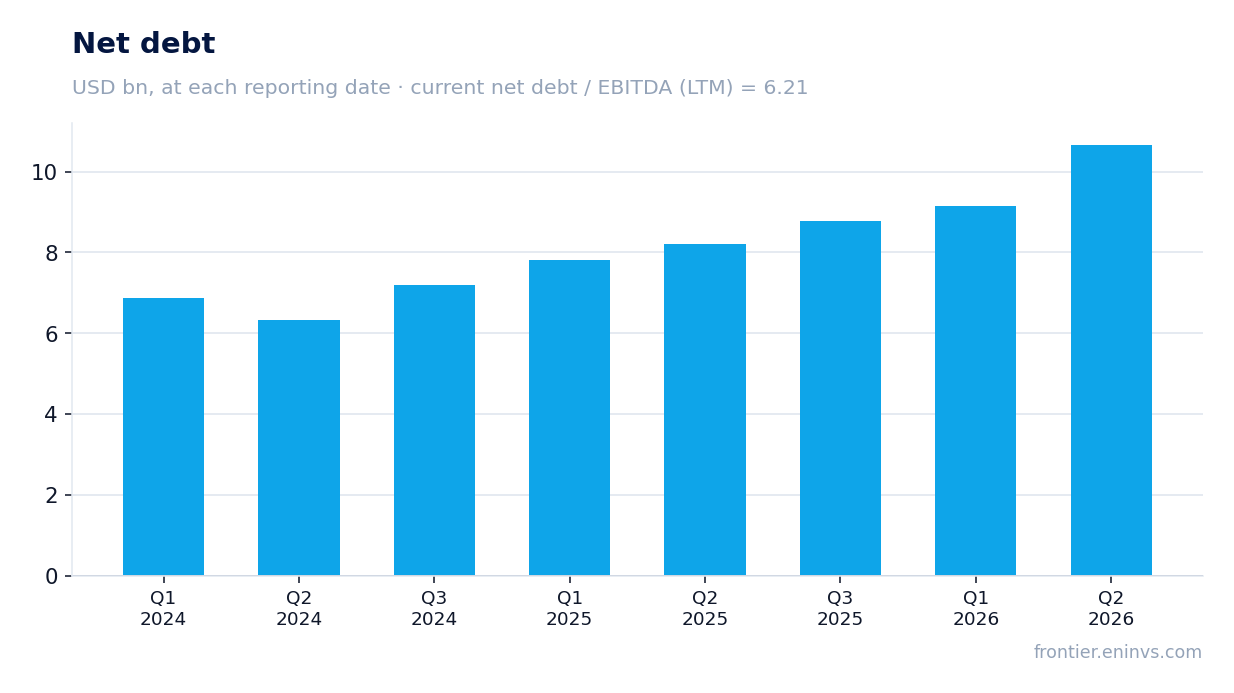
Leverage remains high: net debt/EBITDA LTM at 6.21
Net debt at the latest reporting date was 8,032.9 million, with net debt/EBITDA LTM at 6.21. This is a high level of leverage that limits financial flexibility. Over the last 12 months, net debt increased by 2.5 billion, and compared to the previous reporting date, by 1.5 billion.
High debt requires significant interest payments, putting pressure on net profit. If EBITDA declines, debt servicing becomes more burdensome. The company needs to either increase EBITDA or reduce debt to improve its financial position.
Dividend yield over the trailing 12 months is 4.0%
Dividend yield over the trailing 12 months is 4.0%. This is a moderate level that may appeal to income-oriented investors. However, with high leverage and falling profits, the sustainability of dividends is questionable.
The company has not disclosed information on dividends for the current year in the provided facts. If profits continue to decline, the likelihood of maintaining dividends at the previous level decreases. Investors should monitor dividend policy and payout ratio.
Valuation: P/E LTM at 27.6, EV/EBITDA LTM at 13.7
Current valuation: P/E LTM at 27.6, EV/EBITDA LTM at 13.7. These multiples appear high, especially given falling profits and high leverage. For comparison, historical three-year averages are not provided, but current levels may be above fair value.
At P/E 27.6, the market values the company at 27.6 times its annual profit. This implies growth expectations that may not materialize if profits continue to decline. EV/EBITDA at 13.7 also indicates a premium valuation. Investors should be cautious.
Operating cash flow over the last 12 months was 725.7 million, but capital expenditures in Q2 2026 were negative
Operating cash flow over the last 12 months was 725.7 million. However, in Q2 2026 capital expenditures were negative at -366.8 million, which may indicate a return of funds or accounting specifics. This complicates the assessment of real investments in development.
Negative capex could result from asset sales or adjustments, but without additional data it is difficult to interpret. It is important that operating cash flow covers capital expenditures, but with high leverage, free cash flow may be limited.
Valuation on the latest reported figures
| Metric | Value |
|---|---|
| Market cap | 9.65 bn USD |
| P/E (LTM) | 27.6 |
| EV/EBITDA (LTM) | 13.7 |
| P/B | 1.86 |
| Net debt / EBITDA (LTM) | 6.21 |
| Operating cash flow (LTM) | 0.73 bn |
| ROE | 9.1% |
| Dividend yield (12m) | 4.0% |
Bottom line
Equatorial Energia showed 17.9% revenue growth in Q2 2026, but this did not translate into profit growth: EBITDA fell 1.5%, net profit dropped 44.4%. Profitability declined significantly, and leverage remains high. Dividend yield of 4.0% looks moderate, but payout sustainability is questionable. At current multiples (P/E 27.6, EV/EBITDA 13.7), the shares are not cheap. Verdict – neutral: there is growth potential, but risks outweigh.
Open the company's financial profile EQTL →
See also: market overview · valuation map · stock screeners