Multiplan: profit up 77.5%, but quarterly cash flow came in at half the profit
Multiplan's Q2 2026 report showed revenue of USD 166.763m, EBITDA of USD 137.687m and net profit of USD 84.172m. Year on year revenue rose 34.0%, EBITDA 66.8% and profit 77.5%, while the EBITDA margin reached 82.6% versus 66.3% a year earlier. Operating cash flow for the quarter was only USD 51.683m against capex of USD 2.26m, and that gap is the main question raised by the report. In our view the share looks attractive: a P/E LTM of 10.7 and +8% upside to fair value on the portal's model outweigh the weak quarterly cash flow.
Key takeaways
— Revenue rose 34.0% year on year to USD 166.763m, but almost all of the gain came from a low base in the year-earlier quarter
— EBITDA jumped 66.8% to USD 137.687m, with the margin reaching 82.6% versus 66.3% a year earlier
— Net profit added 77.5% to USD 84.172m, lifting the net margin to 50.5% from 38.1%
— Operating cash flow for the quarter was USD 51.683m, half of net profit, with capex of only USD 2.26m
— Net debt stands at USD 896.26m and net debt to EBITDA LTM at 2.02, a level stated without judging direction
— Trailing 12-month dividend yield is 3.72%, below the key rate and offering no yield cushion
— P/E LTM of 10.7 and EV/EBITDA LTM of 8.82 are moderate, and the portal's model shows +8% upside to fair value
Attractiveness
Key figures, USD bn
| Metric | Q2 2025 | Q2 2026 | Change |
|---|---|---|---|
| Revenue | 0.12 | 0.17 | +34.0% |
| EBITDA | 0.08 | 0.14 | +66.8% |
| Operating profit | 0.08 | 0.13 | +71.0% |
| Net profit | 0.05 | 0.08 | +77.5% |
| Operating cash flow | 0.04 | 0.05 | +22.5% |
| Capex | 0.00 | 0.00 | +51.4% |
| EBITDA margin | 66.3% | 82.6% | +16.3 pp |
| Net margin | 38.1% | 50.5% | +12.4 pp |
Revenue rose 34.0% year on year to USD 166.763m, but almost all of the gain came from a low base in the year-earlier quarter
In Q2 2026 Multiplan's revenue was USD 166.763m, up 34.0% year on year. For comparison, growth was even higher in Q1 2026 at 76.2%, while Q2 2025 saw 29.4%. The quarter-on-quarter deceleration is explained by the higher base in Q2 2025 compared with Q1 2025, when revenue was USD 93.537m.
Sequentially, revenue was almost flat against Q1 2026: USD 166.763m versus USD 164.818m. This means the main growth impulse came in late 2025 and early 2026, and in Q2 the company reached a plateau. Without additional data from the report it is impossible to say what exactly drove the year-on-year growth – organic business or one-offs – but the fact that revenue stabilised at a high level is important for assessing the sustainability of the result.
For an investor, the key question is whether the achieved revenue level will hold in the coming quarters. If the company sustains USD 166m per quarter, annual revenue could exceed USD 660m, well above the LTM figure of USD 613.7m. However, without confirmation from management this remains an assumption.
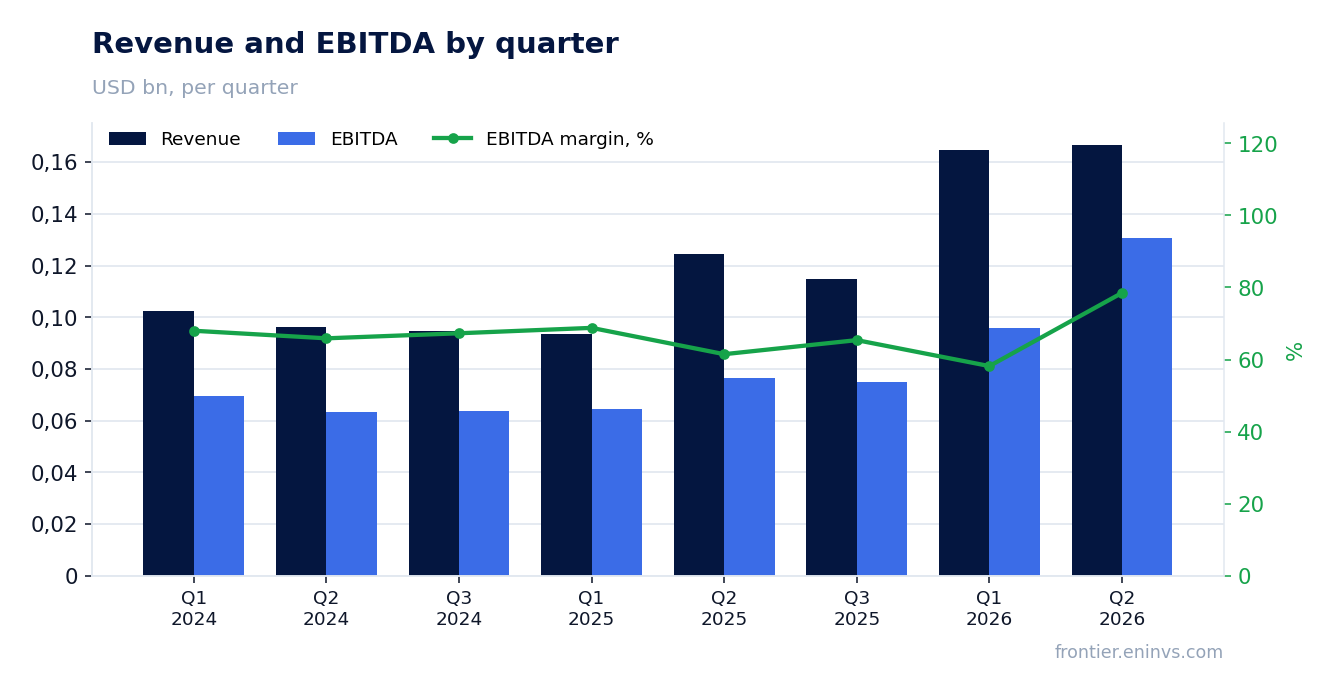
EBITDA jumped 66.8% to USD 137.687m, with the margin reaching 82.6% versus 66.3% a year earlier
EBITDA in Q2 2026 was USD 137.687m, up 66.8% year on year. The EBITDA margin reached 82.6% versus 66.3% in Q2 2025. Such margin growth with a relatively modest revenue increase suggests that operating costs barely grew, and possibly declined.
Operating profit exactly matched EBITDA at USD 130.857m, which is unusual and points to the absence of depreciation in operating costs or its immateriality. This may be an accounting feature, but for analysis it is important that the company does not carry significant non-cash charges that could distort the picture.
The margin rise from 66.3% to 82.6% is 16.3 percentage points. Such a jump is rarely sustainable: it may reflect either one-off factors or structural changes in the business. Without a breakdown of cost lines in the report, we cannot claim that the new margin level will persist. That is why the quarterly profit should be treated with caution despite its impressive growth.
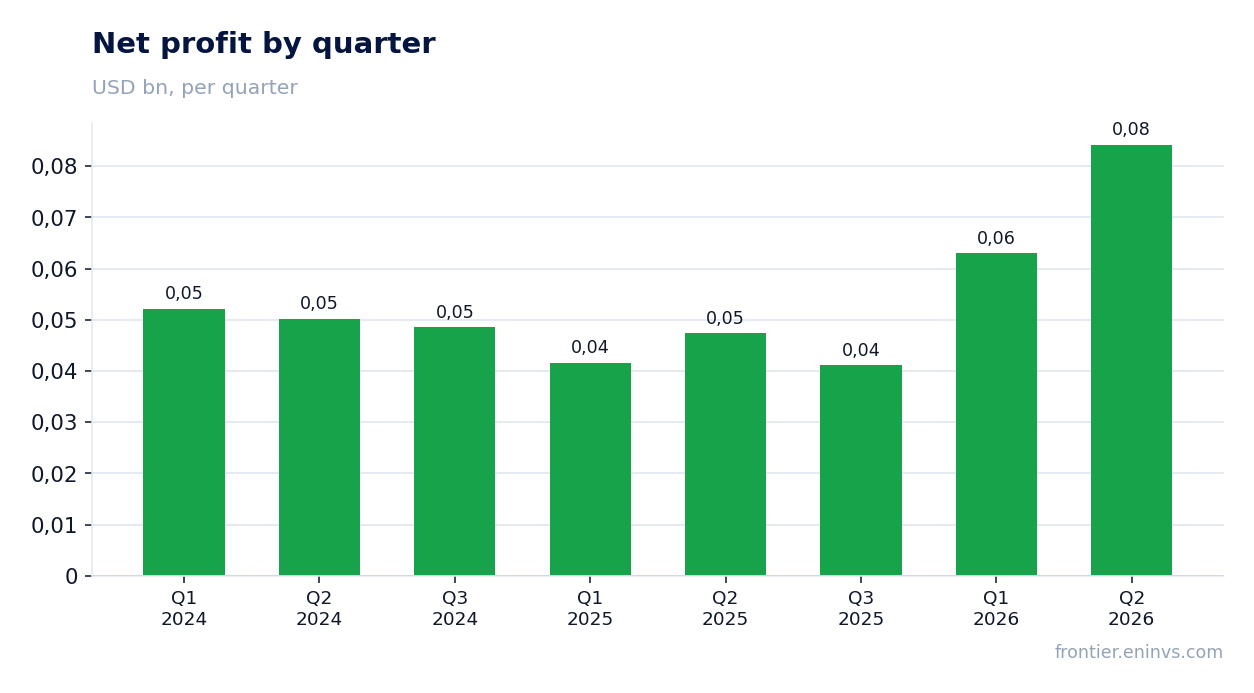
Net profit added 77.5% to USD 84.172m, lifting the net margin to 50.5% from 38.1%
Net profit in Q2 2026 was USD 84.172m, up 77.5% year on year. The net margin rose to 50.5% from 38.1%. Profit grew faster than EBITDA, which may be explained by lower interest expenses or tax burden, but without detail we can only state the fact.
Attention should be paid to the gap between profit and operating cash flow: profit of USD 84.172m versus cash flow of USD 51.683m. The difference of USD 32.489m may be related to working capital changes or non-cash items, but the report provides no explanation. For an investor, this signals that the quality of profit this quarter is lower than the headline suggests.
Over the trailing 12 months, net profit was USD 266.5m. If the quarterly level of USD 84m persists, annual profit could exceed USD 330m, which would further lower the P/E multiple. However, this is only an extrapolation, and the market will likely wait for confirmation in the next report.
Operating cash flow for the quarter was USD 51.683m, half of net profit, with capex of only USD 2.26m
Operating cash flow in Q2 2026 was USD 51.683m, almost half of net profit of USD 84.172m. At the same time, capital expenditures were minimal at USD 2.26m. This gap means that a significant portion of profit did not convert into cash, and this is the key risk in the report.
For comparison, in Q1 2026 operating cash flow was USD 76.653m against profit of USD 63.012m, exceeding profit. In Q2 the situation reversed. This may be due to seasonality or one-off payments, but without explanations in the report we cannot claim it is a one-off.
Low capex of USD 2.26m is typical for a light business model, but it also means the company is not investing in growth. If the business does not require capital, that is a plus, but if investments are being deferred, it could limit future growth. In any case, with such capex, free cash flow should be close to operating cash flow, around USD 49m, which is still below profit.
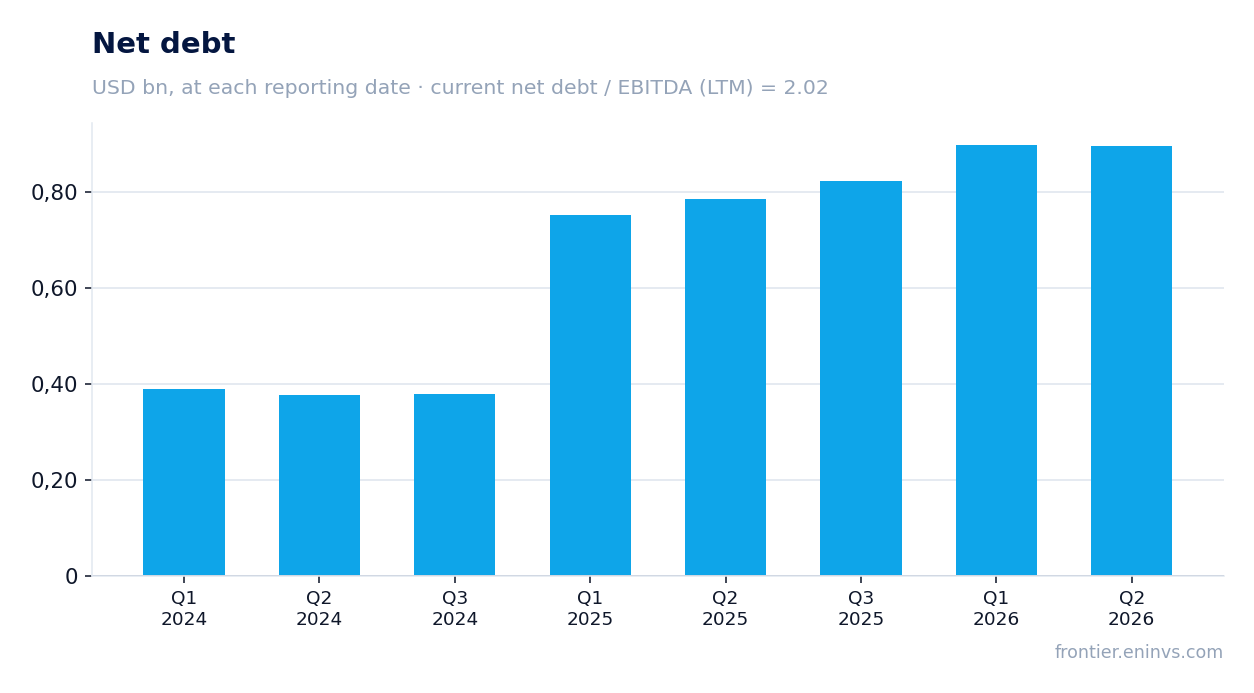
Net debt stands at USD 896.26m and net debt to EBITDA LTM at 2.02, a level stated without judging direction
Multiplan's net debt at the end of Q2 2026 was USD 896.26m. The ratio of net debt to trailing 12-month EBITDA is 2.02. This is a moderate level for a highly profitable company, but it requires monitoring, especially if cash flow remains weak.
Over the trailing 12 months, net debt changed insignificantly: versus the previous reporting date it decreased by RUB 0.0bn, and over the year it increased by RUB 0.1bn. These figures are in rubles, creating a currency mismatch with the main indicators in dollars, but they likely reflect local reporting. In any case, debt burden is not growing rapidly.
Interest expenses are not broken out in the provided data, but with LTM EBITDA of USD 421.6m and net debt of USD 896.26m, interest coverage looks comfortable. The main risk is if EBITDA declines while debt stays at the same level, the ratio could rise. For now, the level of 2.02 does not raise concerns.
Trailing 12-month dividend yield is 3.72%, below the key rate and offering no yield cushion
Multiplan's trailing 12-month dividend yield is 3.72%. This is below the current key rate, making the stock less attractive for income-oriented investors. At the same time, the company is not a classic high-payout dividend story, and the yield mainly reflects share price growth rather than generous distributions.
The provided data does not include information on specific dividend payments for the reporting period or plans for the current year. We can only state that the trailing yield of 3.72% does not provide significant support for the share price. If profit continues to grow and the payout ratio remains stable, the dividend could increase, but this will only be visible in future reports.
For an investor, it is important that with a P/E of 10.7 and a yield of 3.72%, the total return (dividends plus profit growth) could be attractive if growth continues. However, if profit proves unsustainable, the dividend could come under pressure. For now, the dividend is not the main factor in valuing this stock.
P/E LTM of 10.7 and EV/EBITDA LTM of 8.82 are moderate, and the portal's model shows +8% upside to fair value
The trailing 12-month P/E is 10.7, and EV/EBITDA is 8.82. These are moderate levels that do not look overheated, especially given profit growth. For comparison with its own history, we do not have data on three-year averages, so we cannot say whether the current valuation is above or below its historical levels.
Our valuation model, based on EBITDA growth and a target multiple, shows +8% upside to fair value. This is not a consensus forecast or a target price, but the result of our internal model. It indicates that the stock trades slightly below its fair value, but the cushion is small.
With a market capitalisation of USD 2,864.84m and net debt of USD 896.26m, EV is about USD 3,761m. With LTM EBITDA of USD 421.6m, this gives EV/EBITDA of 8.82. If EBITDA grows, the multiple will decline, creating additional upside. However, if profit growth proves unsustainable, the current valuation may prove fair.
Valuation on the latest reported figures
| Metric | Value |
|---|---|
| Market cap | 2.86 bn USD |
| P/E (LTM) | 10.7 |
| EV/EBITDA (LTM) | 8.8 |
| P/B | 2.49 |
| Net debt / EBITDA (LTM) | 2.02 |
| Operating cash flow (LTM) | 0.27 bn |
| ROE | 25.7% |
| Dividend yield (12m) | 3.7% |
Bottom line
Multiplan delivered a strong quarter on profit: revenue rose 34.0%, EBITDA 66.8%, net profit 77.5%, and the margin reached 82.6%. However, operating cash flow was half of net profit, and this is the main question raised by the report. Valuation is moderate: P/E 10.7, EV/EBITDA 8.82, with +8% upside on the portal's model. The dividend yield of 3.72% offers no cushion. In our verdict, the share looks attractive, but only if the company confirms profit sustainability and improves cash conversion in the next quarter.
Open the company's financial profile MULT →
See also: market overview · valuation map · stock screeners