PagSeguro: Q2 revenue barely grew while margin carried profit

PagSeguro reported second-quarter 2026 results in August 2026. Revenue added just 0.4% year on year, to $908.1m, EBITDA rose 13.6% to $436.9m, and net profit was up 2.3% at $98.1m. The EBITDA margin climbed to 46.8% from 41.4%, and it was the margin rather than business growth that shaped the result. With EV/EBITDA at 5.82 against its own three-year average of 5.95 and a dividend yield of 2.7%, the share looks rather unattractive: growth has stalled and the valuation offers no cushion.
Key takeaways
— Q2 revenue grew just 0.4% year on year, to $908.1m
— EBITDA rose 13.6% on revenue up 0.4% – the margin climbed to 46.8% from 41.4%
— Net profit rose 2.3% to $98.1m, with the net margin almost flat at 10.8% versus 10.6%
— Free cash flow for the quarter was $87.8m on capex of $92.6m
— Net debt rose to $7.81bn, with net debt/EBITDA at 4.25 for the trailing twelve months
— The 2.7% dividend yield rests on a payout that debt service could shrink
— EV/EBITDA of 5.82 against its own three-year average of 5.95 – the stock trades slightly below its history, but the portal model implies 26% downside to fair value
Attractiveness
Key figures, USD bn
| Metric | Q2 2025 | Q2 2026 | Change |
|---|---|---|---|
| Revenue | 0.90 | 0.91 | +0.4% |
| EBITDA | 0.37 | 0.43 | +13.6% |
| Operating profit | 0.35 | 0.35 | -0.1% |
| Net profit | 0.10 | 0.10 | +2.3% |
| Operating cash flow | 0.40 | 0.18 | -54.9% |
| Capex | 0.09 | 0.09 | -2.1% |
| EBITDA margin | 41.4% | 46.8% | +5.4 pp |
| Net margin | 10.6% | 10.8% | +0.2 pp |
Q2 revenue grew just 0.4% year on year, to $908.1m
In the second quarter of 2026 PagSeguro's revenue was $908.1m, up 0.4% from $904.2m a year earlier. That is a slowdown from the first quarter, when growth was 3.2%. The quarterly trend has weakened consistently: revenue reached $964.7m in the fourth quarter of 2025, then fell to $894.8m in the first quarter of 2026 and $908.1m in the second.
For the trailing twelve months revenue was $3.70bn. The company operates in a saturated payments market, and growth has almost stalled. For an investor this is a key signal: the business has stopped growing at the double-digit rates that the previous valuation assumed.
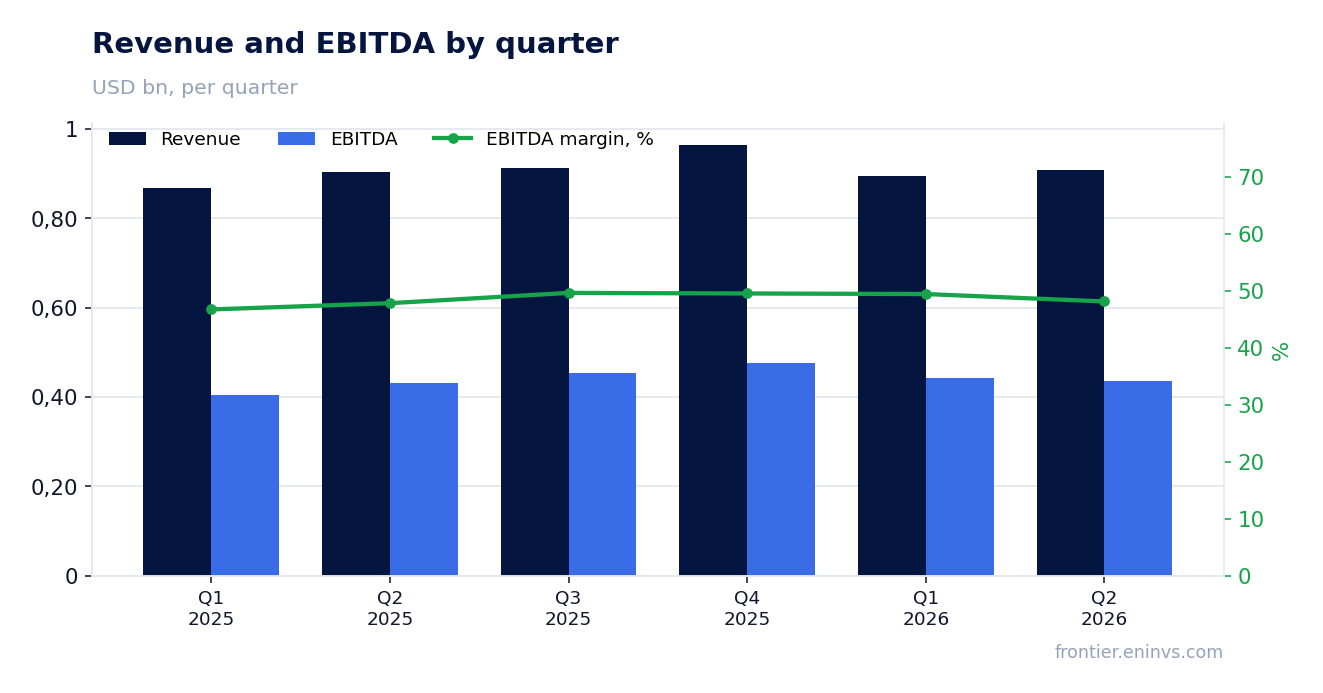
EBITDA rose 13.6% on revenue up 0.4% – the margin climbed to 46.8% from 41.4%
EBITDA in the second quarter of 2026 rose 13.6% year on year to $436.9m. With revenue up only 0.4%, that means profitability improved: the EBITDA margin climbed to 46.8% from 41.4% a year earlier. Such a jump in margin on almost flat revenue points to cost cuts or a shift in revenue mix toward higher-margin products.
Operating profit for the quarter was $351.4m versus $351.9m a year earlier – essentially unchanged. The gap between EBITDA growth and stagnant operating profit may be explained by one-off items below the operating line, but the facts do not provide that detail. For the sustainability of the result it matters that the margin rose through structural shifts rather than a one-off cost cut, yet the report offers no confirmation.
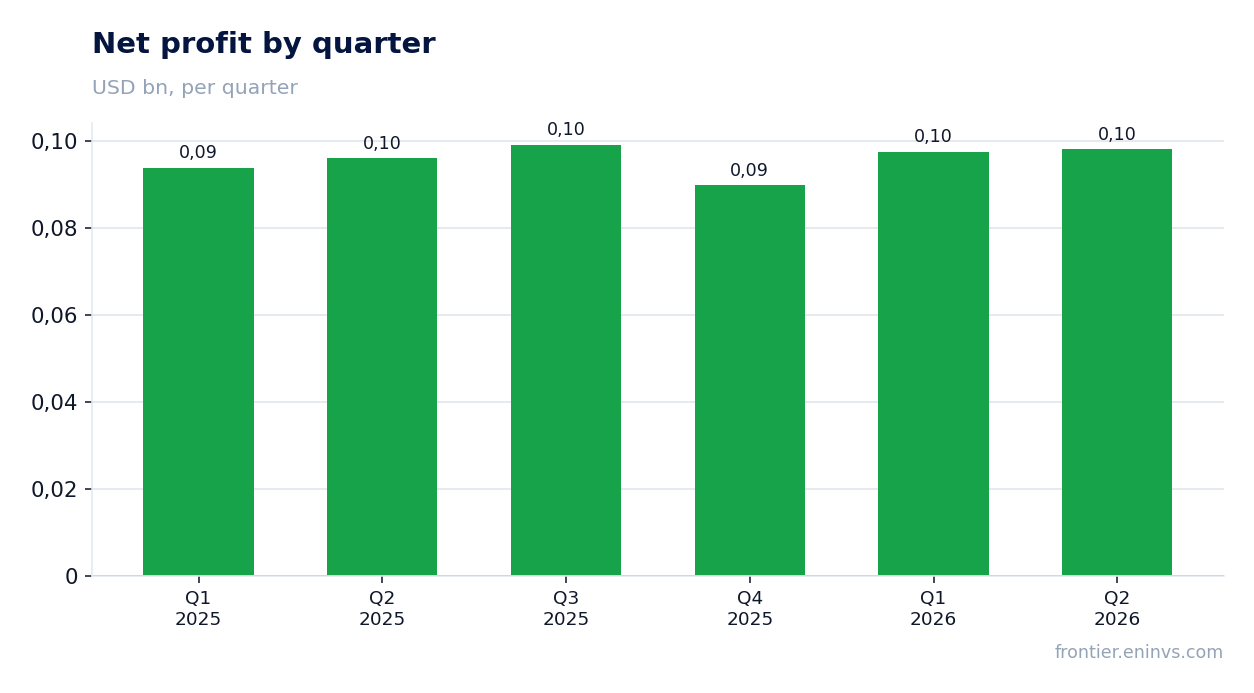
Net profit rose 2.3% to $98.1m, with the net margin almost flat at 10.8% versus 10.6%
Net profit in the second quarter of 2026 was $98.1m, up 2.3% year on year. The net margin was almost unchanged at 10.8% versus 10.6%. That means EBITDA growth did not translate into profit: the higher operating margin was eaten by expenses below the operating line, likely interest payments on debt.
For the trailing twelve months net profit was $384.5m. Against a market capitalisation of $2.72bn that gives a P/E of 7.06. For a company with almost zero revenue growth, that multiple looks neither cheap nor expensive – it reflects stagnation.
Free cash flow for the quarter was $87.8m on capex of $92.6m
Operating cash flow in the second quarter of 2026 was $180.4m, with capex of $92.6m. Free cash flow therefore came to $87.8m. That is below the previous quarter, when operating cash flow was $166.2m on capex of $101.2m, and well below the second quarter of 2025, when operating cash flow reached $399.6m.
For the trailing twelve months operating cash flow was $1.40bn. Free cash flow remains positive, but its coverage of dividend payments and debt service raises questions. The company spends about half of operating cash flow on capex, which limits room for additional shareholder payouts.
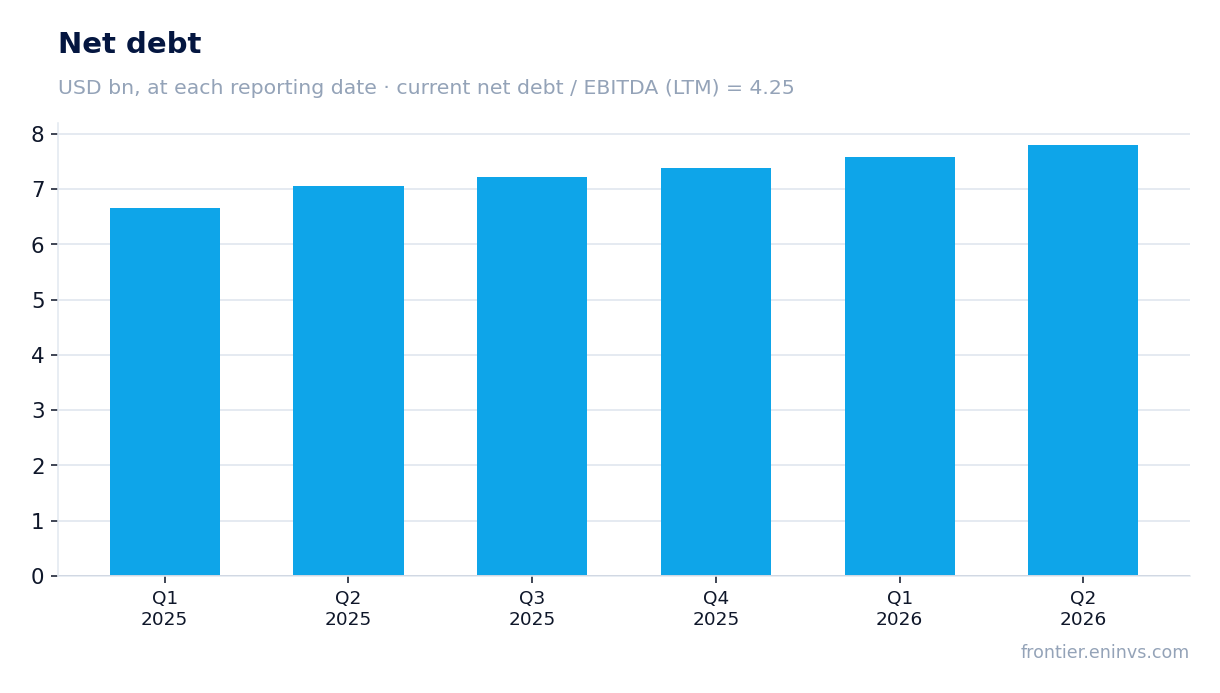
Net debt rose to $7.81bn, with net debt/EBITDA at 4.25 for the trailing twelve months
Net debt at the end of the second quarter of 2026 was $7.81bn, up $0.2bn from the previous reporting date and up $0.7bn over twelve months. The net debt/EBITDA ratio for the trailing twelve months is 4.25. That is a high level for a company with almost zero revenue growth, and it limits financial flexibility.
Rising debt against stagnant revenue means the debt burden is not declining. Interest expenses likely consume a significant portion of operating profit, which explains the weak net profit growth despite strong EBITDA. For an investor this is a key risk: further debt increases could pressure profit and dividends.
The 2.7% dividend yield rests on a payout that debt service could shrink
PagSeguro's dividend yield over the trailing twelve months is 2.7%. That is a modest level, especially given the high debt burden. With trailing twelve-month net profit of $384.5m and a market capitalisation of $2.72bn, paying out a significant portion of profit is constrained by the need to service $7.81bn of debt.
Our estimate: the dividend this year may stay at a level that provides a yield of about 2.7%, but that depends on profit holding up and no large one-off write-offs. If the debt burden continues to grow, the company may be forced to cut payments. For an income-oriented investor this creates uncertainty.
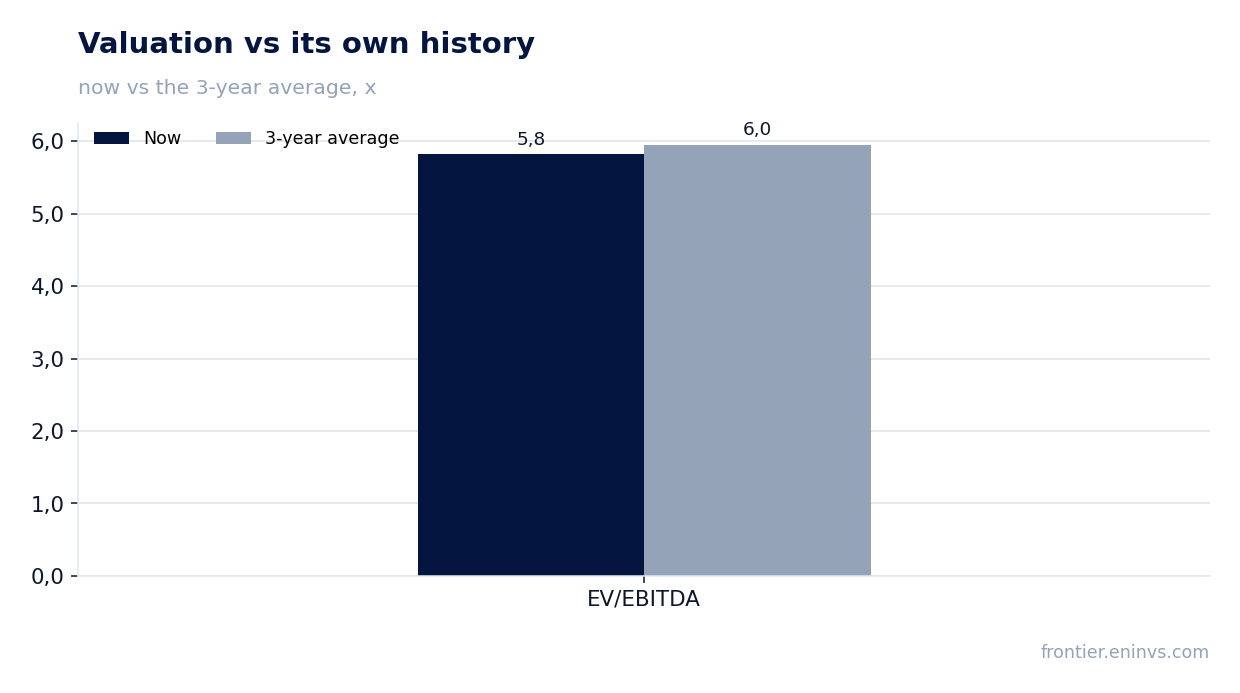
EV/EBITDA of 5.82 against its own three-year average of 5.95 – the stock trades slightly below its history, but the portal model implies 26% downside to fair value
The current EV/EBITDA multiple is 5.82, slightly below its own three-year average of 5.95. That means the stock trades a little cheaper than its average over the past three years. However, the trailing twelve-month P/E is 7.06 and ROE is 14.9%. With almost zero revenue growth and a high debt burden, this valuation offers no significant cushion.
On the portal's model, which compares EBITDA growth with a target multiple and market capitalisation, the downside to fair value is 26%. This is our own estimate, not a market consensus. It indicates that the current price does not reflect the risks associated with stagnant revenue and debt.
Valuation on the latest reported figures
| Metric | Value |
|---|---|
| Market cap | 2.72 bn USD |
| P/E (LTM) | 7.1 |
| EV/EBITDA (LTM) | 5.8 |
| P/B | 1.04 |
| Net debt / EBITDA (LTM) | 4.25 |
| Operating cash flow (LTM) | 1.40 bn |
| ROE | 14.9% |
| Dividend yield (12m) | 2.7% |
| EV/EBITDA, 3-year average | 6.0 |
Bottom line
The strong point of the report remains the margin: EBITDA rose 13.6% on revenue up 0.4%, and the margin climbed to 46.8%. However, that growth did not reach net profit – it added only 2.3%, and the net margin was almost unchanged. Debt of $7.81bn with a net debt/EBITDA ratio of 4.25 and stagnant revenue are the main questions for a holder. The EV/EBITDA valuation of 5.82 is slightly below its own three-year average of 5.95, but the portal model implies 26% downside to fair value. With a 2.7% dividend yield and the risk of a cut, the share looks rather unattractive.
Open the company's financial profile PAGS →
See also: market overview · valuation map · stock screeners