Raia Drogasil: double-digit revenue growth, but quarterly profit lags the sales trend
Raia Drogasil reported second-quarter 2026 results. Revenue rose 12.1% year on year to USD 2,178.5 million, EBITDA added 24.1% to USD 168.2 million, and net profit increased 21.7% to USD 83.6 million. The EBITDA margin improved to 12.5% from 11.3% a year earlier, and the net margin to 3.8% from 3.5%. At the current price the stock looks attractive: EV/EBITDA LTM stands at 12.5, and the portal's model puts upside to fair value at 20%.
Key takeaways
— Revenue in Q2 2026 grew 12.1% year on year to USD 2,178.5 million, but this is a slowdown from 17.8% in Q1
— EBITDA in Q2 rose 24.1% year on year, with the margin improving to 12.5% from 11.3% a year earlier
— Net profit in Q2 increased 21.7% year on year to USD 83.6 million, with the net margin reaching 3.8%
— Operating cash flow over the last twelve months was USD 443.9 million, while capital expenditure in Q2 was USD 63.9 million
— Leverage stands at 1.11x EBITDA LTM, with net debt of USD 609.7 million
— The trailing twelve-month dividend yield is 2.26%, and the P/E LTM is 24.6
— On the portal's model the stock trades at a 20% discount to fair value, with EV/EBITDA LTM at 12.5
Attractiveness
Key figures, USD bn
| Metric | Q2 2025 | Q2 2026 | Change |
|---|---|---|---|
| Revenue | 1.94 | 2.18 | +12.1% |
| EBITDA | 0.22 | 0.27 | +24.1% |
| Operating profit | 0.13 | 0.17 | +30.7% |
| Net profit | 0.07 | 0.08 | +21.7% |
| Operating cash flow | 0.09 | 0.17 | +85.7% |
| Capex | 0.06 | 0.06 | +10.1% |
| EBITDA margin | 11.3% | 12.5% | +1.2 pp |
| Net margin | 3.5% | 3.8% | +0.3 pp |
Revenue in Q2 2026 grew 12.1% year on year to USD 2,178.5 million, but this is a slowdown from 17.8% in Q1
Raia Drogasil's revenue in Q2 2026 was USD 2,178.5 million, up 12.1% year on year. This extends the growth trend, but the pace has slowed: in Q1 2026 revenue grew 17.8%, and in Q4 2025 it grew 20.7%. The deceleration may reflect a high base effect as well as changes in consumer demand.
Despite the slowdown, absolute revenue growth remains substantial: the company added more than USD 235 million in sales year on year. Support comes from network expansion and like-for-like sales growth, although the breakdown of these drivers is not available in the provided data.
Revenue dynamics are important for assessing business resilience: the company maintains double-digit growth, above inflation, but the market may expect higher figures. In the next report, it is worth watching whether the slowdown persists or was one-off.
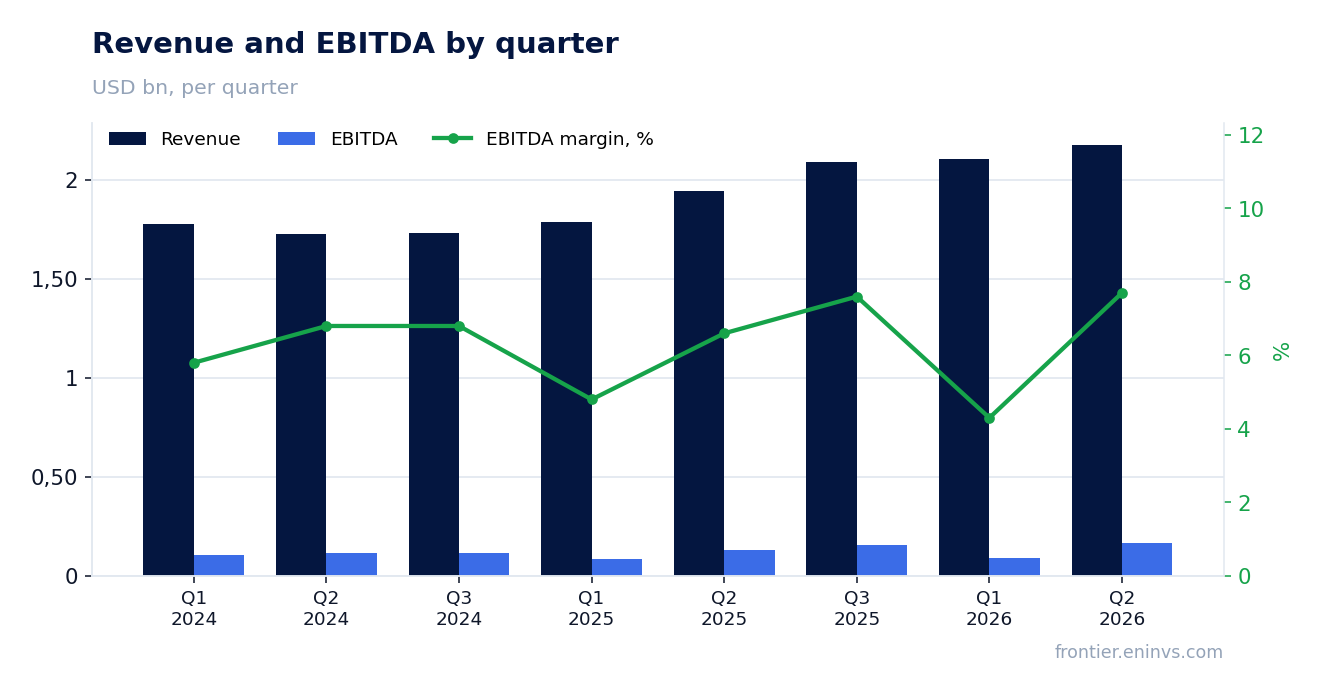
EBITDA in Q2 rose 24.1% year on year, with the margin improving to 12.5% from 11.3% a year earlier
EBITDA in Q2 2026 rose 24.1% year on year to USD 168.2 million. The EBITDA margin increased to 12.5% from 11.3% a year earlier. This means the company is not only growing sales but also improving efficiency.
The margin improvement could be due to cost control or a change in sales mix. However, without a breakdown of expense items, it is difficult to say which factor was decisive. Importantly, EBITDA growth outpaces revenue growth, indicating operating leverage.
In Q1 2026, EBITDA was USD 90.4 million, and the margin was lower. The second quarter typically sees seasonal growth, which may have supported the figure. The question is whether the margin improvement will persist in the coming quarters.
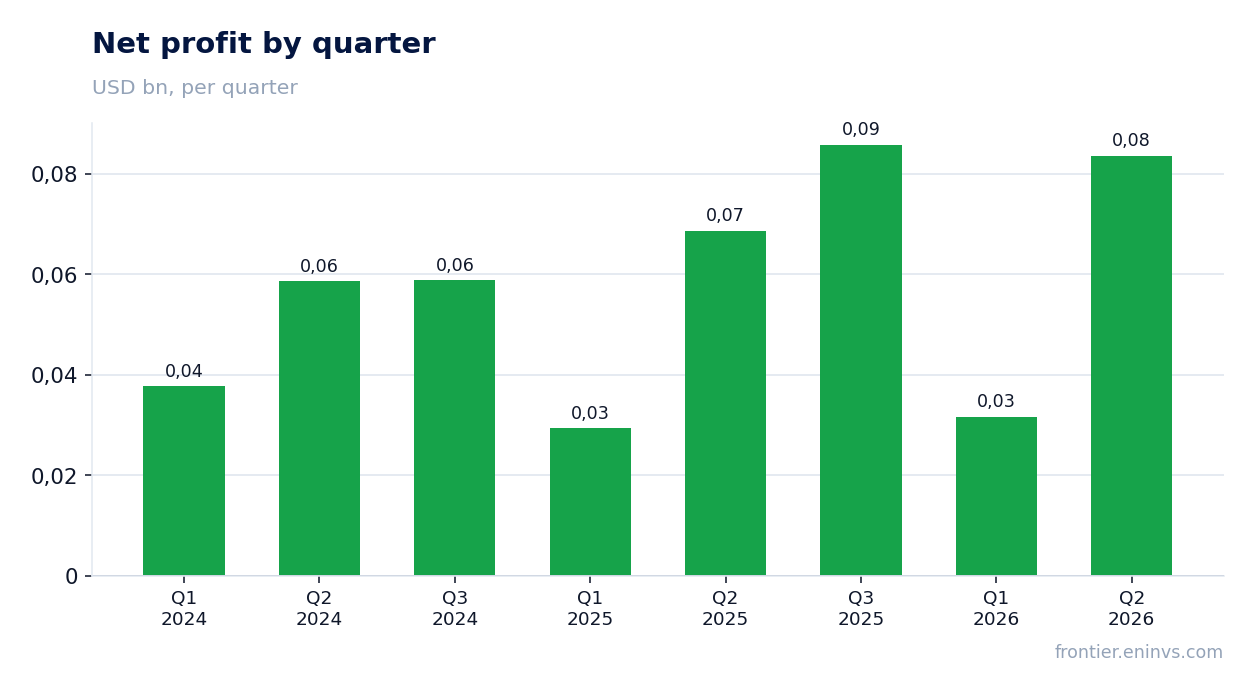
Net profit in Q2 increased 21.7% year on year to USD 83.6 million, with the net margin reaching 3.8%
Net profit in Q2 2026 was USD 83.6 million, up 21.7% year on year. The net margin rose to 3.8% from 3.5% in the same period last year. Profit growth slightly lags EBITDA dynamics, which may be due to higher expenses below the operating line.
The net margin improvement of 0.3 percentage points indicates that the company manages not only operating but also other expenses effectively. However, it is worth noting that net profit could have been affected by one-off factors not disclosed in the provided data.
Over the last twelve months, net profit was USD 254.7 million. This figure is important for assessing the dividend base and the overall financial health of the company.
Operating cash flow over the last twelve months was USD 443.9 million, while capital expenditure in Q2 was USD 63.9 million
Operating cash flow over the last twelve months was USD 443.9 million. This is a substantial amount that covers capital expenditure and allows financing development. In Q2 2026, capital expenditure was USD 63.9 million, higher than in Q1 (USD 51.8 million).
The increase in capital expenditure may be related to network expansion or infrastructure investments. Importantly, operating cash flow significantly exceeds capital expenditure, leaving room for dividends and debt reduction.
Free cash flow (operating cash flow minus capital expenditure) over the last twelve months remains positive, supporting financial stability.
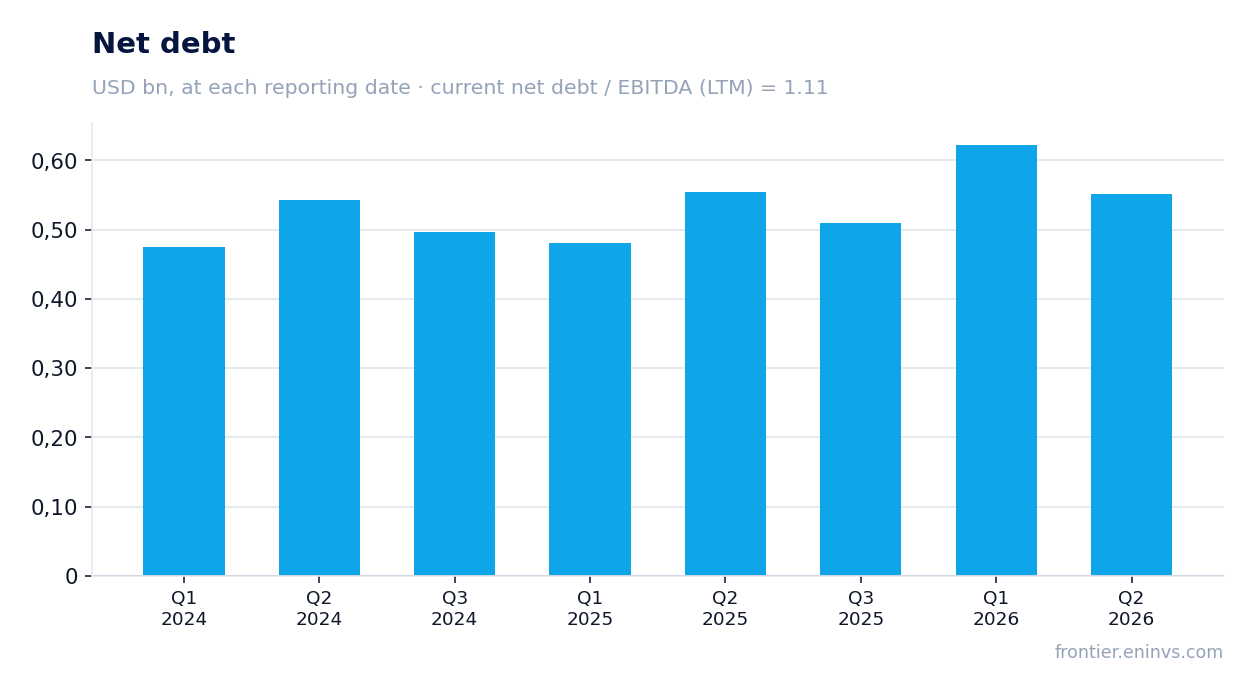
Leverage stands at 1.11x EBITDA LTM, with net debt of USD 609.7 million
Net debt at the latest reporting date was USD 609.7 million, and the net debt to EBITDA LTM ratio was 1.11. This is a moderate level of leverage that does not raise concerns. Over the last twelve months, net debt has remained virtually unchanged.
The reduction in net debt compared to the previous reporting date was insignificant – by RUB 0.1 billion. This indicates stability in debt policy. At the current EBITDA level, the company can comfortably service its debt.
It is important to note that the debt/EBITDA ratio stands at 1.11, below critical levels. This gives the company flexibility for further investments or shareholder payouts.
The trailing twelve-month dividend yield is 2.26%, and the P/E LTM is 24.6
Raia Drogasil's dividend yield over the last twelve months is 2.26%. This is a moderate level that may appeal to income-oriented investors. However, the specific amount of the last dividend and the year for which it was paid are not provided in the data.
Our estimate for the current year's dividend is based on a conservative approach: assuming the payout ratio is maintained and profit stays at current levels, the yield may remain near historical values. The key factor is net profit, which over the last twelve months was USD 254.7 million.
The yield of 2.26% is comparable to the key rate, but without data on the rate a direct comparison is not possible. If profit continues to grow, the dividend may increase, supporting the yield. A risk to the dividend is a decline in profit or an increase in capital expenditure.
On the portal's model the stock trades at a 20% discount to fair value, with EV/EBITDA LTM at 12.5
According to the portal's model, the fair value of Raia Drogasil shares is 20% above the current market price. This is our own model's estimate, not a market consensus. The model takes into account EBITDA growth and a target multiple.
The current EV/EBITDA LTM multiple is 12.5. For comparison with its own three-year history, the provided facts do not contain data, so we cannot say whether the current level is above or below the average. However, the absolute value of 12.5 looks moderate for a company with growing revenue and EBITDA.
The P/E LTM ratio is 24.6, which is also an important benchmark. At current profit and expected growth, the stock may be interesting for investors willing to take risk. The upside potential on the portal's model is 20%, which outweighs the risks.
Valuation on the latest reported figures
| Metric | Value |
|---|---|
| Market cap | 6.26 bn USD |
| P/E (LTM) | 24.6 |
| EV/EBITDA (LTM) | 12.5 |
| P/B | 4.67 |
| Net debt / EBITDA (LTM) | 1.11 |
| Operating cash flow (LTM) | 0.44 bn |
| ROE | 23.1% |
| Dividend yield (12m) | 2.3% |
Bottom line
Bottom line: Raia Drogasil delivered strong Q2 2026 results – revenue up 12.1%, EBITDA up 24.1%, net profit up 21.7%. Margins improved, leverage is moderate, and cash flow covers capital expenditure. However, the slowdown in revenue growth and the lack of data on the current year's dividend policy warrant attention. At the current price, the stock looks attractive: EV/EBITDA LTM of 12.5 and 20% upside on the portal's model outweigh the risks.
Open the company's financial profile RADL →
See also: market overview · valuation map · stock screeners