Sabesp: revenue up a quarter, but profit down a quarter – margin compressed by 5.1 pp

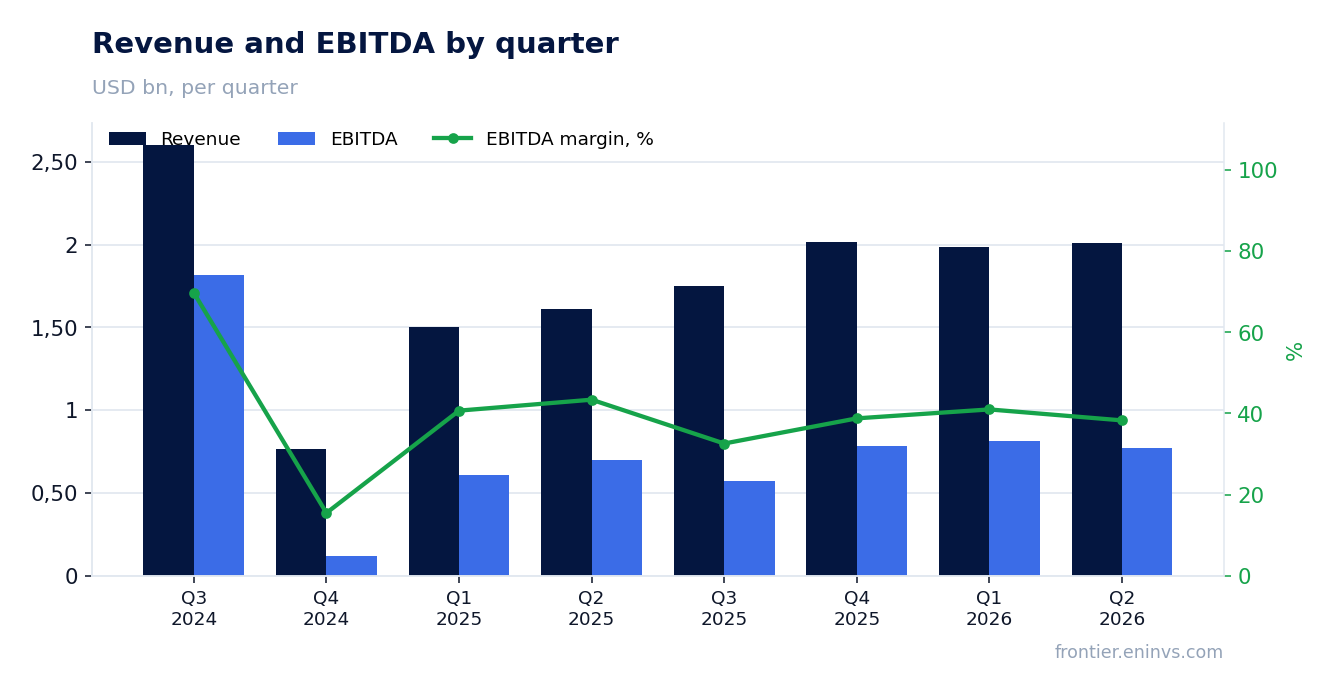
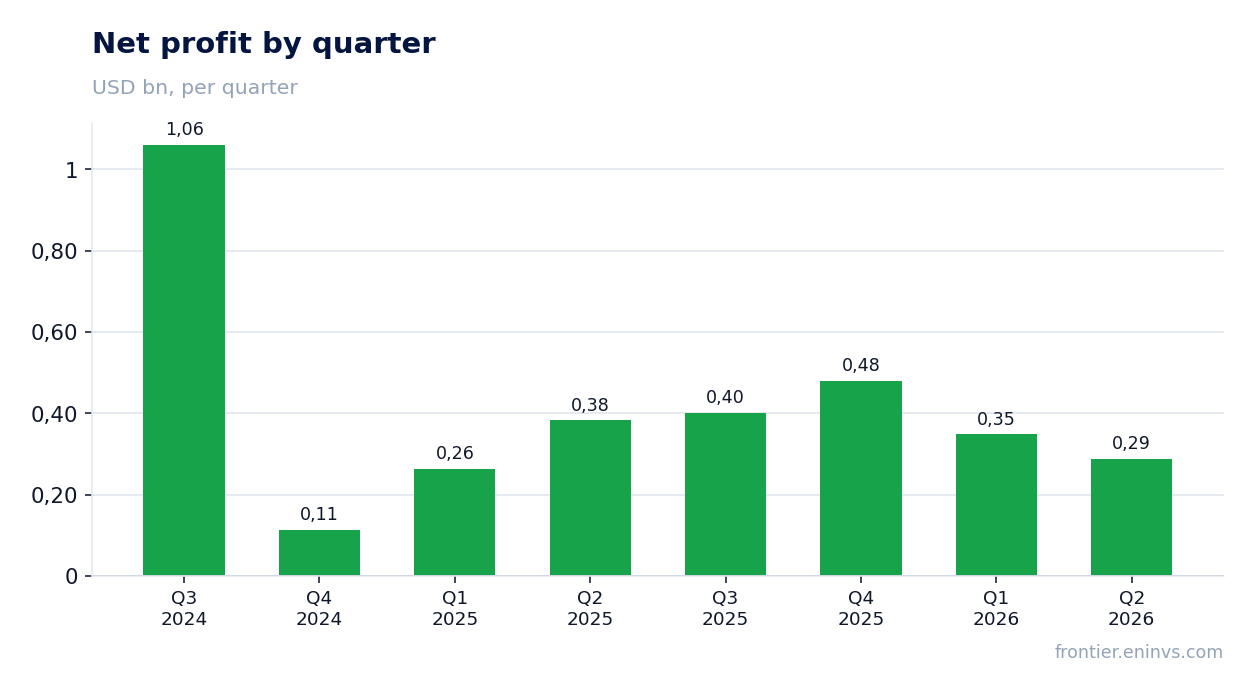
Sabesp released its second-quarter 2026 results. Revenue rose 25.0% year on year to USD 2,010.4 mn, EBITDA added 10.3% to USD 769.1 mn, while net profit fell 24.7% to USD 288.4 mn. The EBITDA margin narrowed to 38.3% from 43.4% a year earlier, and the net margin to 14.3% from 23.8%. With a P/E LTM of 11.7 and a dividend yield of 0.61%, the share looks neutral: top-line growth is not converting into profit because of margin compression, and leverage at 1.85 EBITDA LTM limits room for manoeuvre.
Key takeaways
— Revenue rose 25.0% year on year to USD 2,010.4 mn, but that did not help profit
— EBITDA added only 10.3%, and its margin compressed to 38.3% from 43.4%
— Net profit fell 24.7% to USD 288.4 mn, and the net margin to 14.3% from 23.8%
— Operating cash flow for the quarter was USD 662.9 mn with capex of USD 684.4 mn
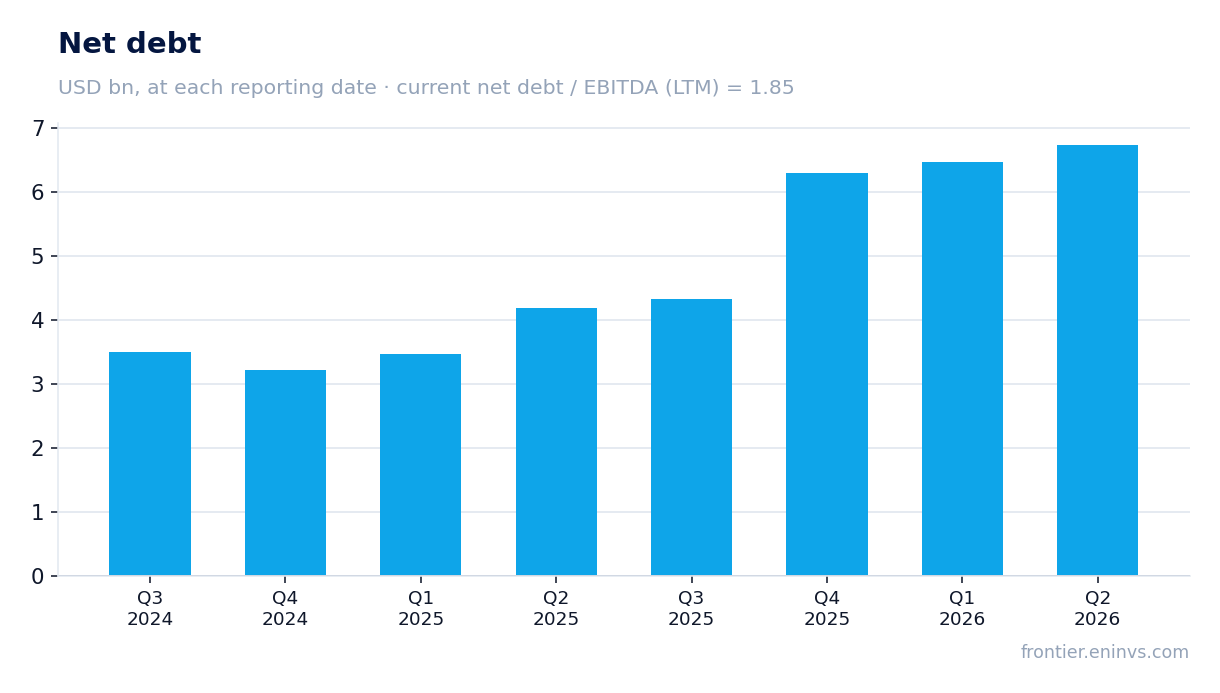
— Leverage stands at 1.85 EBITDA LTM with net debt of USD 5,071.3 mn
— Trailing 12-month dividend yield is 0.61%, below the key rate
— P/E LTM 11.7 and EV/EBITDA LTM 8.36 – valuation does not look overheated, but margin pressure weighs
Attractiveness
Key figures, USD bn
| Metric | Q2 2025 | Q2 2026 | Change |
|---|---|---|---|
| Revenue | 1.61 | 2.01 | +25.0% |
| EBITDA | 0.70 | 0.77 | +10.3% |
| Operating profit | 0.60 | 0.62 | +3.9% |
| Net profit | 0.38 | 0.29 | -24.7% |
| Operating cash flow | 0.57 | 0.66 | +16.2% |
| Capex | 0.78 | 0.68 | -11.9% |
| EBITDA margin | 43.4% | 38.3% | -5.1 pp |
| Net margin | 23.8% | 14.3% | -9.5 pp |
Revenue rose 25.0% year on year to USD 2,010.4 mn, but that did not help profit
In the second quarter of 2026, Sabesp's revenue reached USD 2,010.4 mn, up 25.0% year on year. This continues robust growth: in the first quarter of 2026 revenue added 32.5%, and in the fourth quarter of 2025 – 164.1%. However, the growth rate is decelerating: from 32.5% in Q1 2026 to 25.0% in Q2 2026.
Revenue growth did not translate into profit: net profit fell 24.7% to USD 288.4 mn, while EBITDA rose only 10.3% to USD 769.1 mn. This means costs grew faster than revenue. Operating profit in Q2 2026 was USD 623.8 mn, lower than USD 600.2 mn a year earlier, despite higher revenue. Consequently, operating profitability declined.
Quarterly revenue dynamics show that after the surge in Q4 2025 (up 164.1%), a slowdown followed. In Q3 2025, revenue even contracted 32.7% year on year. Such volatility complicates trend assessment. Nevertheless, the last two quarters show growth above 25%, which may indicate a recovery.
EBITDA added only 10.3%, and its margin compressed to 38.3% from 43.4%
EBITDA in Q2 2026 was USD 769.1 mn, up 10.3% year on year. However, the EBITDA margin fell to 38.3% from 43.4% in Q2 2025. The 5.1 pp compression is the key negative of the report.
With revenue up 25.0%, EBITDA rose only 10.3%, indicating faster cost growth. Operating profit also declined: USD 623.8 mn versus USD 600.2 mn a year earlier. This means the company could not maintain operating efficiency at the previous level.
The margin decline may be due to higher cost of sales or operating expenses, but the provided facts do not break down cost items. Therefore, one can only state the fact of margin compression and its impact on profit. For investors, this is a signal of potential pressure on future results if the trend persists.
Net profit fell 24.7% to USD 288.4 mn, and the net margin to 14.3% from 23.8%
Net profit in Q2 2026 was USD 288.4 mn, down 24.7% year on year. The net margin narrowed to 14.3% from 23.8%. This is a significant deterioration in profitability.
The fall in net profit despite revenue and EBITDA growth is explained by margin compression and possibly higher interest expenses or other items below operating profit. However, the facts do not provide data on interest expenses or taxes, so the exact cause is not specified. One can only note that net profit fell more than EBITDA, indicating additional pressure factors.
To assess the sustainability of profit, one-off effects are important, but they are not in the provided data. Therefore, the current profit decline may be due to either operational or financial issues. Investors should monitor net margin dynamics in the coming quarters.
Operating cash flow for the quarter was USD 662.9 mn with capex of USD 684.4 mn
In Q2 2026, operating cash flow was USD 662.9 mn, while capital expenditures were USD 684.4 mn. Thus, free cash flow was negative: capex exceeded operating cash flow by USD 21.5 mn. This means the company did not generate enough funds to cover investments.
For comparison, in Q1 2026 operating cash flow was only USD 151.8 mn with capex of USD 1,007.8 mn, also resulting in negative free cash flow. In Q2 the situation improved: operating cash flow rose and capex fell, but still exceeded the flow.
Negative free cash flow may limit the company's ability to pay dividends or reduce debt. Given that the trailing 12-month dividend yield is only 0.61% and leverage is 1.85 EBITDA LTM, the company is likely to prioritise investments or debt servicing over generous payouts.
Leverage stands at 1.85 EBITDA LTM with net debt of USD 5,071.3 mn
Sabesp's net debt at the latest reporting date was USD 5,071.3 mn, with a net debt to EBITDA ratio of 1.85 for the trailing twelve months. This is a moderate leverage level that does not raise immediate concerns but requires monitoring.
Over the past 12 months, net debt increased by RUB 2.5 bn, and versus the previous reporting date – by RUB 0.3 bn. Rising debt amid negative free cash flow could lead to further leverage increase if the company does not improve cash generation.
Interest expenses are not disclosed in the facts, but rising debt could increase financial costs and pressure on net profit. Given that net profit has already fallen 24.7%, further debt growth could worsen the situation. However, with EBITDA LTM of USD 2,734.9 mn, leverage of 1.85 appears manageable.
Trailing 12-month dividend yield is 0.61%, below the key rate
Sabesp's dividend yield over the trailing 12 months is 0.61%. This is a low level, significantly below the key rate. For a company with such a metric, dividends are not the main factor of investment appeal.
The facts do not provide the size of the last paid dividend or the payout ratio. However, with LTM net profit of USD 1,518.1 mn and a market capitalisation of USD 17,793.3 mn, a dividend yield of 0.61% suggests the company allocates an insignificant portion of profit to dividends or has not paid them recently.
The low dividend yield may be due to the need to finance capital expenditures, which in recent quarters exceeded operating cash flow. If the company continues to invest in development, dividends are likely to remain modest. For income-oriented investors, this limits the appeal of the stock.
P/E LTM 11.7 and EV/EBITDA LTM 8.36 – valuation does not look overheated, but margin pressure weighs
The trailing twelve-month P/E multiple is 11.7, and EV/EBITDA is 8.36. These levels appear moderate, especially against the backdrop of falling profit. However, without comparison to the company's historical averages, it is difficult to judge how attractive the current valuation is.
Return on equity (ROE) over the trailing twelve months is 13.1%. This is a decent figure, but it may decline if margin pressure persists. At the current price, the stock trades at 11.7 times annual earnings, implying expectations of stable or moderate profit growth.
The main risk to valuation is further margin compression. If net profit continues to fall, the P/E multiple will rise even if the price remains unchanged. On the other hand, if the company manages to stabilise its margin, the current valuation may prove conservative. For now, the market is likely pricing in the risk of declining profit.
Valuation on the latest reported figures
| Metric | Value |
|---|---|
| Market cap | 17.8 bn USD |
| P/E (LTM) | 11.7 |
| EV/EBITDA (LTM) | 8.4 |
| P/B | 2.30 |
| Net debt / EBITDA (LTM) | 1.85 |
| Operating cash flow (LTM) | 1.50 bn |
| ROE | 13.1% |
| Dividend yield (12m) | 0.6% |
Bottom line
Bottom line: Sabesp showed 25.0% revenue growth in Q2 2026, but net profit fell 24.7% due to margin compression. EBITDA rose only 10.3%, and its margin declined to 38.3% from 43.4%. Operating cash flow was insufficient to cover capital expenditures, resulting in negative free cash flow. Leverage at 1.85 EBITDA LTM and a low dividend yield of 0.61% limit appeal. At a P/E of 11.7, the stock is neutrally valued: there is top-line growth potential, but without margin recovery, profit is unlikely to show sustainable growth. Verdict – neutral.
Open the company's financial profile SBS →
See also: market overview · valuation map · stock screeners