TOTVS: profit tripled, but almost none of it came from software
TOTVS reported results for the second quarter of 2026. Revenue grew 41.6% year on year to USD 378.04 million, EBITDA rose 50.2% to USD 94.565 million, and net profit jumped 287.5% to USD 135.587 million. Revenue growth has accelerated for five consecutive quarters, but net profit of USD 135.6 million on revenue of USD 378 million means the bulk of it came from below the operating line rather than from the core business. At an EV/EBITDA LTM of 17.9 and a P/E LTM of 13.8, the stock looks neutral: operating growth is strong, but profit and cash flow do not yet fully confirm it.
Key takeaways
— Revenue has grown for five consecutive quarters, adding 41.6% year on year in Q2 2026
— EBITDA rose 50.2%, but its margin gained only 1.4 percentage points to 25.0%
— Net profit of 135.6 million is nearly triple operating profit of 69.6 million, and the gap came from below the operating line
— Operating cash flow of 90.9 million covers capex of 17.0 million more than five times over
— Net debt of 592.1 million against LTM EBITDA of 215.6 million gives a ratio of 0.04 – debt is almost absent
— At a market cap of 3,851.4 million, P/E LTM is 13.8 and EV/EBITDA LTM is 17.9, while the portal model shows only +6% upside to fair value
— Trailing 12-month dividend yield of 2.0% is below the key rate and does not compensate for the lack of cash confirmation of profit
Attractiveness
Key figures, USD bn
| Metric | Q2 2025 | Q2 2026 | Change |
|---|---|---|---|
| Revenue | 0.27 | 0.38 | +41.6% |
| EBITDA | 0.06 | 0.09 | +50.2% |
| Operating profit | 0.05 | 0.07 | +48.1% |
| Net profit | 0.03 | 0.14 | +287.5% |
| Operating cash flow | 0.06 | 0.09 | +44.0% |
| Capex | 0.01 | 0.02 | +32.1% |
| EBITDA margin | 23.6% | 25.0% | +1.4 pp |
| Net margin | 13.1% | 35.9% | +22.8 pp |
Revenue has grown for five consecutive quarters, adding 41.6% year on year in Q2 2026
In Q2 2026, TOTVS revenue reached USD 378.04 million, up 41.6% from a year earlier. This is the fifth consecutive quarter of positive year-on-year growth: Q3 2024 was a symbolic +1.0%, Q1 2025 was 6.7%, Q2 2025 was 15.6%, Q3 2025 was 25.8%, and Q1 2026 was 30.0%. The acceleration is consistent and sustained, and in Q2 2026 it reached the highest pace in the entire available period.
Absolute quarterly revenue has also grown without interruption: USD 230.8 million in Q2 2024, USD 260.1 million in Q1 2025, USD 266.9 million in Q2 2025, USD 290.3 million in Q3 2025, USD 338.2 million in Q1 2026, and USD 378.0 million in Q2 2026. Over two years, quarterly revenue has grown more than one and a half times. This is not a one-off spike but a shift in trajectory.
For a software company, such revenue growth is the main argument in favour of the stock. However, it does not by itself answer whether that growth translates into profit and cash. The following sections address that question.
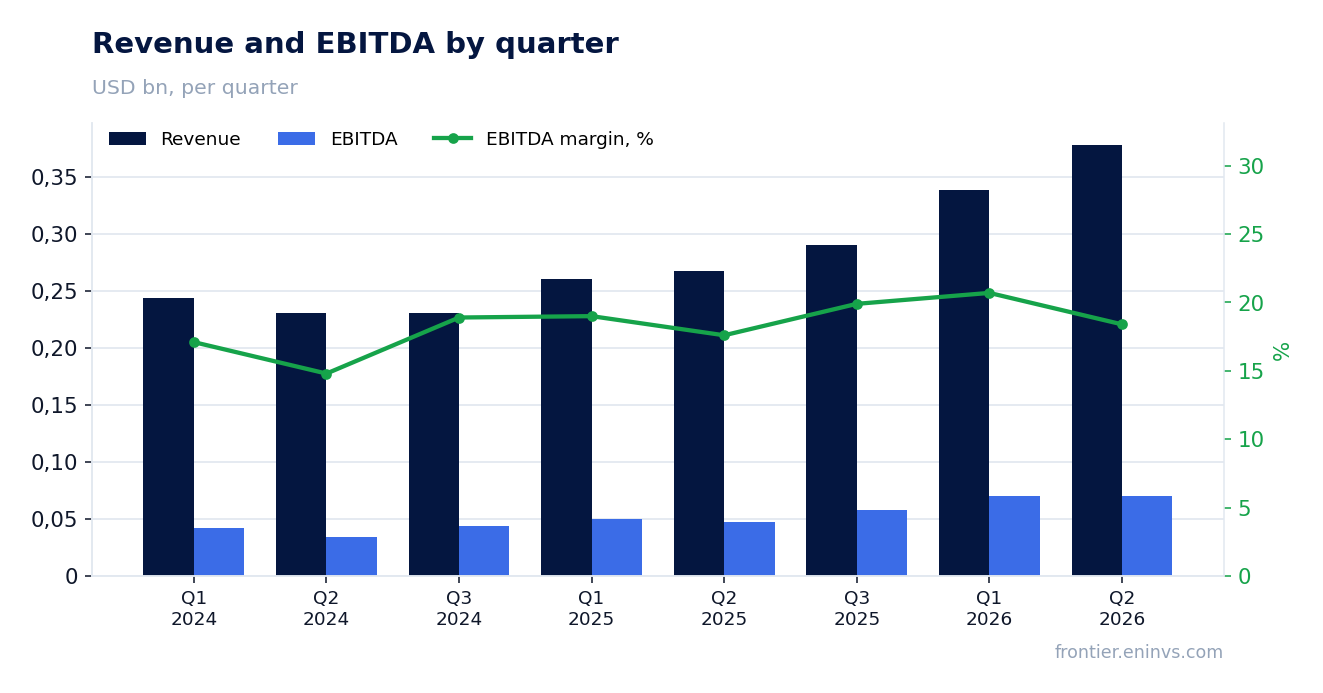
EBITDA rose 50.2%, but its margin gained only 1.4 percentage points to 25.0%
EBITDA in Q2 2026 was USD 94.565 million, up 50.2% from Q2 2025. EBITDA growth outpaces revenue growth, which is formally a good sign. However, the EBITDA margin rose only from 23.6% to 25.0%, or 1.4 percentage points. With revenue accelerating to 41.6%, such a margin gain looks modest.
Operating profit in Q2 2026 was USD 69.597 million. In previous quarters, operating profit equalled EBITDA, and in the reporting period there is no gap between them either. This means that depreciation and other non-cash items do not distort the picture at the operating profit level, and the entire difference between revenue and operating profit is operating expenses.
The ratio of operating profit to revenue – 18.4% – is noticeably below the EBITDA margin of 25.0%. The 6.6 percentage point gap is depreciation and possibly other non-cash charges not disclosed in the provided data. For a software company capitalising development, such a difference is typical, but it means EBITDA does overstate operating profitability.
The main takeaway: EBITDA growth of 50.2% is primarily a consequence of revenue growth, not an improvement in unit economics. The margin rose, but only slightly, and operating profit of 69.6 million on revenue of 378.0 million indicates that a significant portion of revenue goes to expenses.
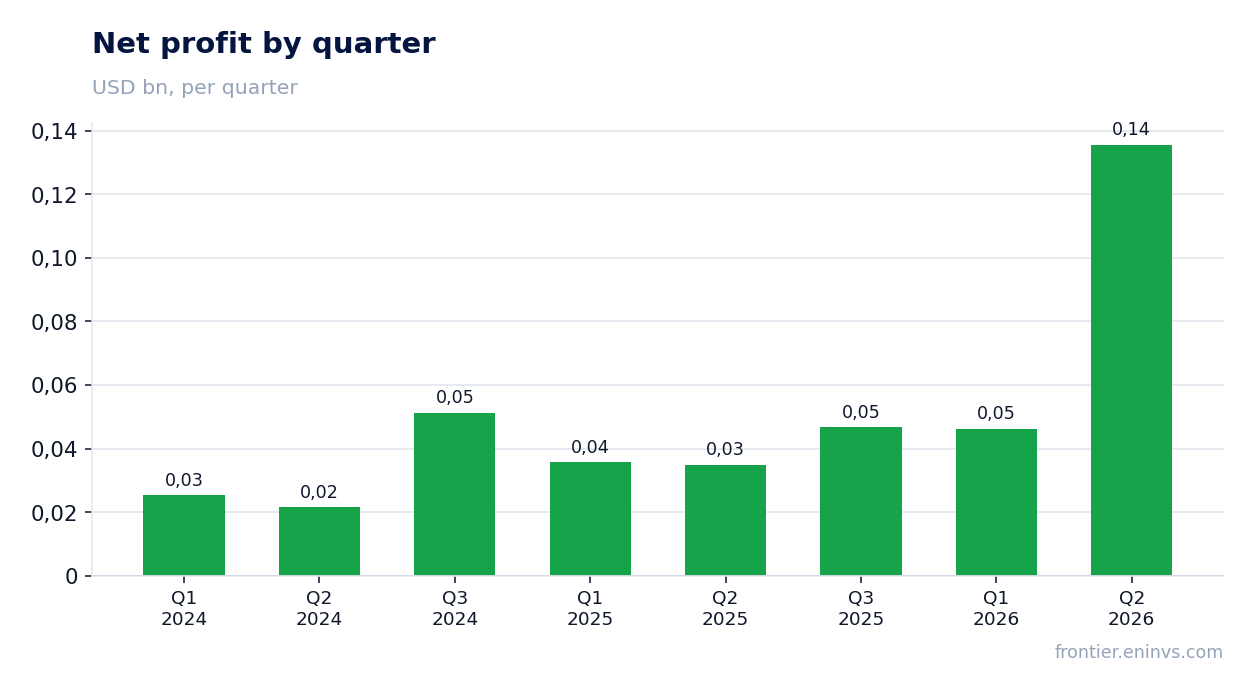
Net profit of 135.6 million is nearly triple operating profit of 69.6 million, and the gap came from below the operating line
Net profit in Q2 2026 was USD 135.587 million, up 287.5% from Q2 2025. This is the strongest growth among all reported metrics. However, operating profit for the same period was USD 69.597 million. Net profit exceeds operating profit almost twofold, meaning the company received significant non-operating income below the operating line.
The net margin in Q2 2026 was 35.9% versus 13.1% a year earlier. A margin increase of 22.8 percentage points against an operating margin gain of only a few percentage points directly indicates that the main contribution came not from operational improvements but from one-off or financial items.
The provided data does not break down the items below operating profit. It is only known that the gap between operating and net profit is USD 66.0 million. This could be foreign exchange gains, asset sales, a tax effect, or other items. Without disclosure of the source, it is impossible to assess whether this effect will recur next quarter.
For the investor, this is the key risk: if Q2 2026 profit is largely one-off, then the P/E LTM of 13.8 calculated on its basis is understated, and the company's real valuation on sustainable profit is higher. The next report will show whether this was a one-off item or a new norm.
Operating cash flow of 90.9 million covers capex of 17.0 million more than five times over
Operating cash flow in Q2 2026 was USD 90.863 million, capital expenditures were USD 16.961 million. Free cash flow thus exceeds USD 73 million. This is a healthy ratio: the company generates enough cash to fund investments and potential dividends.
However, operating cash flow of USD 90.9 million is noticeably below net profit of USD 135.6 million. The gap of USD 44.7 million indicates that part of the profit is not confirmed by cash – this could be receivables growth, non-cash income, or other working capital items. For a company whose net profit is almost double operating profit, such a gap is expected.
Capital expenditures of USD 17.0 million represent 4.5% of revenue. For a software company, this is a moderate level, although it has risen relative to previous quarters: in Q1 2026 capex was USD 27.5 million, in Q2 2025 it was USD 12.8 million. The increase in capital expenditures may reflect investment in development or infrastructure.
Free cash flow remains the main confirmation of profit quality. As long as it is positive and covers capex, the company can fund development without increasing debt. But if the gap between profit and cash flow persists, it will limit dividend capacity.
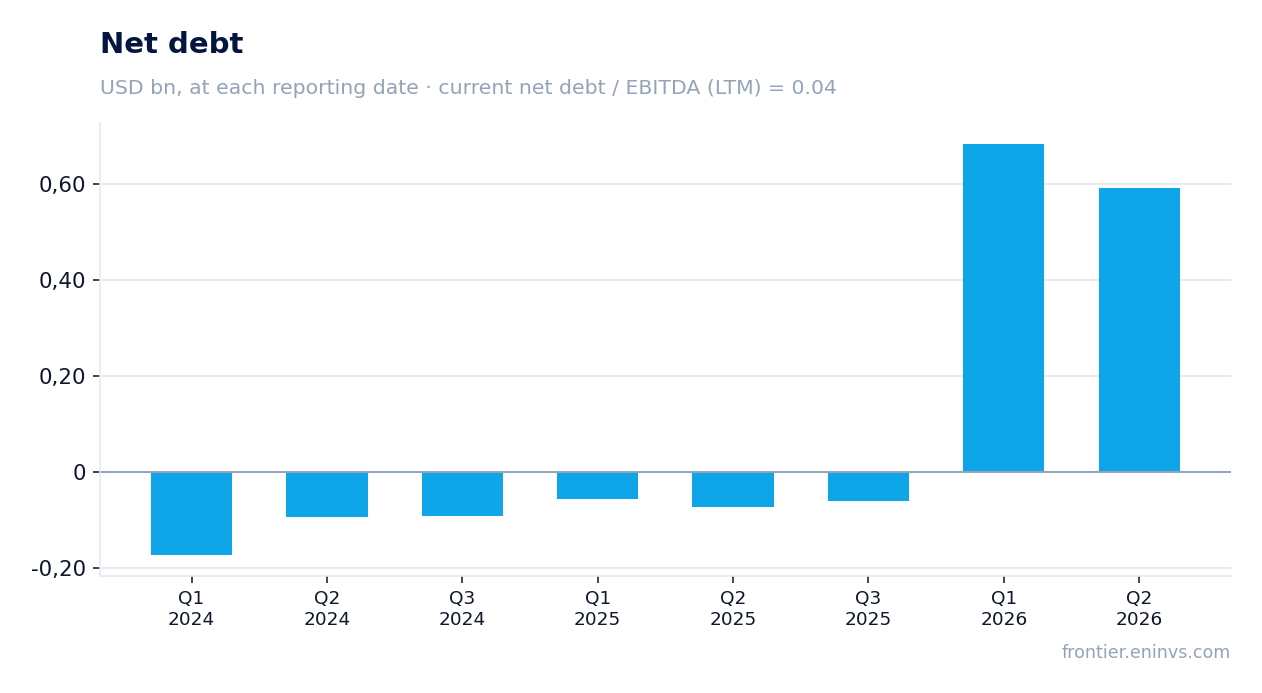
Net debt of 592.1 million against LTM EBITDA of 215.6 million gives a ratio of 0.04 – debt is almost absent
TOTVS net debt at the end of Q2 2026 was USD 592.119 million. With LTM EBITDA of USD 215.6 million, the net debt to EBITDA ratio is 0.04. This is an extremely low level: the company barely uses debt financing.
Over the quarter, net debt decreased by RUB 0.1 billion; over 12 months it increased by RUB 0.7 billion. However, these changes do not alter the picture: debt load remains minimal. In Q1 2026 net debt was USD 683.6 million; in Q2 2025 it was minus USD 72.0 million, meaning the company moved from a net cash position to net debt, but in absolute terms debt is insignificant relative to revenue and EBITDA.
Low debt is a strength. It gives the company freedom of manoeuvre: the ability to fund growth, acquisitions, or dividends without pressure from creditors. At the same time, it means the company does not use financial leverage to boost return on capital. ROE of 50.9% with such low debt is evidence of high return on equity, not of leverage.
For the investor, the absence of debt load reduces risk. Even if operating profit temporarily declines, the company will not face debt servicing problems. This is an important argument in favour of the stock amid high profit volatility.
At a market cap of 3,851.4 million, P/E LTM is 13.8 and EV/EBITDA LTM is 17.9, while the portal model shows only +6% upside to fair value
TOTVS market capitalisation is USD 3,851.4 million. With LTM net profit of USD 279.3 million, P/E LTM is 13.8. With LTM EBITDA of USD 215.6 million, EV/EBITDA LTM is 17.9. The ratio of these two multiples shows that the market values the company fairly highly relative to its cash profit, but moderately relative to EBITDA.
The portal model, which values EBITDA growth at a target multiple, shows only +6% upside to fair value. This means the current price is close to our model's valuation. For the investor, this is a signal that the stock does not look undervalued despite strong revenue growth.
Comparison with the company's own history is not possible because the provided data does not include three-year average multiples. However, it can be noted that P/E LTM of 13.8 is lower than one might expect for a company with revenue growth of 41.6%. This is explained by the fact that LTM profit includes one-off income that inflates the base. Without them, P/E would be higher.
The trailing 12-month dividend yield is 2.0%. With a key rate that is not specified in the provided data but is clearly above 2%, the dividend is not the main argument for buying. The main question is whether the company can sustain profit growth without one-off items.
Trailing 12-month dividend yield of 2.0% is below the key rate and does not compensate for the lack of cash confirmation of profit
TOTVS trailing 12-month dividend yield is 2.0%. This is a modest level. At a market capitalisation of USD 3,851.4 million, the annual dividend flow is about USD 77 million. For a company generating operating cash flow of USD 219.7 million over the last 12 months, this is a moderate payout.
As for the current year, our dividend estimate is based on LTM profit of USD 279.3 million and a historical payout ratio not specified in the provided data. If the company maintains a conservative approach to payouts, the dividend for 2026 may be close to the current yield level. However, a significant portion of LTM profit may have been one-off, which limits the payout base.
A dividend yield of 2.0% is below the key rate, which in Russia at the time of writing is substantially higher. This means that for an income-oriented investor, the TOTVS stock is not attractive. The main argument for buying is capital growth, not dividends.
What could make the payout smaller: further increases in capital expenditures, a decline in operating profit, or rising debt. As long as net debt is minimal and free cash flow is positive, the risk of a dividend cut is low. But if one-off income does not recur, profit may be lower, and the board may revise the payout.
Valuation on the latest reported figures
| Metric | Value |
|---|---|
| Market cap | 3.85 bn USD |
| P/E (LTM) | 13.8 |
| EV/EBITDA (LTM) | 17.9 |
| P/B | 3.87 |
| Net debt / EBITDA (LTM) | 0.04 |
| Operating cash flow (LTM) | 0.22 bn |
| ROE | 50.9% |
| Dividend yield (12m) | 2.0% |
Bottom line
TOTVS delivered a strong quarter on revenue: 41.6% year-on-year growth, the fifth consecutive acceleration, and this is the main positive of the report. However, net profit of USD 135.6 million is almost double operating profit of USD 69.6 million, and the gap came from below-the-line items whose nature is not disclosed. Operating cash flow of USD 90.9 million confirms only part of the profit, and a dividend yield of 2.0% does not compensate for the risks. At EV/EBITDA LTM of 17.9 and P/E LTM of 13.8, the stock is neutrally valued, and the portal model shows only +6% upside to fair value. The real question for a holder is whether the company can convert revenue growth into sustainable operating profit without one-off income.
Open the company's financial profile TOTS →
See also: market overview · valuation map · stock screeners