Ultrapar: EBITDA doubled, but half the gain came from a weak year-ago base

On 25 August Ultrapar reported results for the second quarter of 2026. Revenue rose 21.9% year on year to 7,422.3 million, EBITDA doubled (+101.2%) to 639.2 million, and net profit increased 42.3% to 276.9 million. The EBITDA margin expanded to 8.7% from 5.3% a year earlier. At the current price the stock looks attractive: EV/EBITDA of 6.2 against a three-year average of 5.8, while the portal's model puts upside to fair value at +73%.
Key takeaways
— Revenue rose 21.9% year on year in Q2 2026 to 7,422.3 million – the strongest quarterly result in the last five quarters
— EBITDA doubled (+101.2%) to 639.2 million, but half the gain is explained by a low year-ago base: 322.4 million in Q2 2025
— The EBITDA margin expanded to 8.7% from 5.3%, the highest level in the last five quarters
— Net profit increased 42.3% to 276.9 million, while operating cash flow reached 856.1 million – more than three times net profit
— Leverage remains moderate: net debt / LTM EBITDA stands at 1.71, and net debt itself fell to 2,362.9 million from 3,024.3 million at end-2025
— Trailing twelve-month dividend yield is 2.6%, below the key rate, but the payout could rise with profit
— On the portal's model the stock trades at a discount to fair value, with upside estimated at +73%
Attractiveness
Key figures, USD bn
| Metric | Q2 2025 | Q2 2026 | Change |
|---|---|---|---|
| Revenue | 6.09 | 7.42 | +21.9% |
| EBITDA | 0.32 | 0.65 | +101.2% |
| Operating profit | 0.25 | 0.56 | +123.0% |
| Net profit | 0.19 | 0.28 | +42.3% |
| Operating cash flow | 0.16 | 0.86 | +421.7% |
| Capex | 0.09 | 0.07 | -14.0% |
| EBITDA margin | 5.3% | 8.7% | +3.4 pp |
| Net margin | 3.2% | 3.7% | +0.5 pp |
Revenue rose 21.9% year on year in Q2 2026 to 7,422.3 million – the strongest quarterly result in the last five quarters
Ultrapar's revenue in Q2 2026 reached 7,422.3 million, up 21.9% year on year. This is the highest quarterly figure in the last five quarters: Q1 2026 revenue was 6,569.7 million, Q4 2025 – 6,784.2 million.
Growth accelerated: in Q1 2026 revenue rose 10.3% year on year, while in Q2 it was already 21.9%. This points to strengthening operational momentum, although the exact drivers are not disclosed in the provided data.
Over the trailing twelve months revenue amounted to 27,400.0 million. The company shows sustained growth: even allowing for seasonal fluctuations, quarterly figures are consistently increasing.
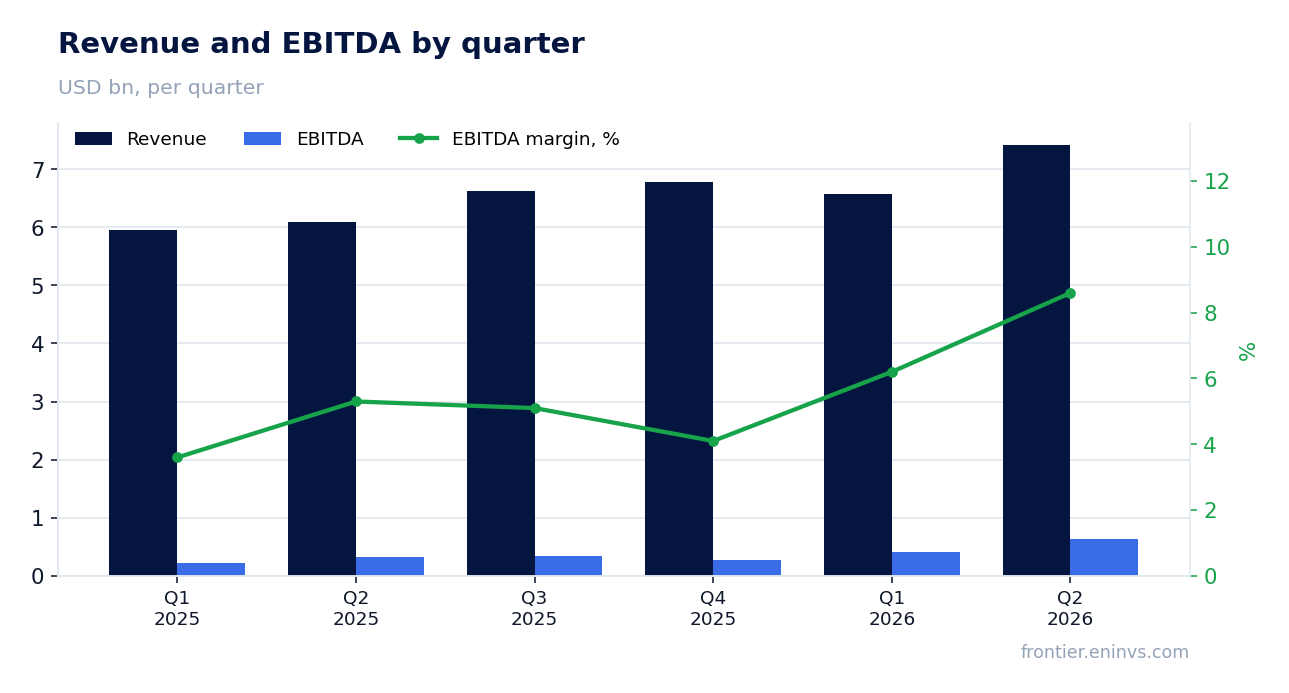
EBITDA doubled (+101.2%) to 639.2 million, but half the gain is explained by a low year-ago base: 322.4 million in Q2 2025
EBITDA in Q2 2026 was 639.2 million, up 101.2% from 322.4 million in Q2 2025. Such growth looks impressive, but it is partly due to a low base: a year earlier the figure was 322.4 million, significantly below the average of the last five quarters.
For comparison: in Q1 2026 EBITDA was 404.1 million, in Q4 2025 – 280.1 million. Thus, the current EBITDA level is the highest in the last five quarters and more than double the year-ago figure.
Over the trailing twelve months EBITDA amounted to 1,766.3 million. The increase in the reporting quarter may be linked to both higher revenue and improved operational efficiency, but cost details are not available in the provided data.
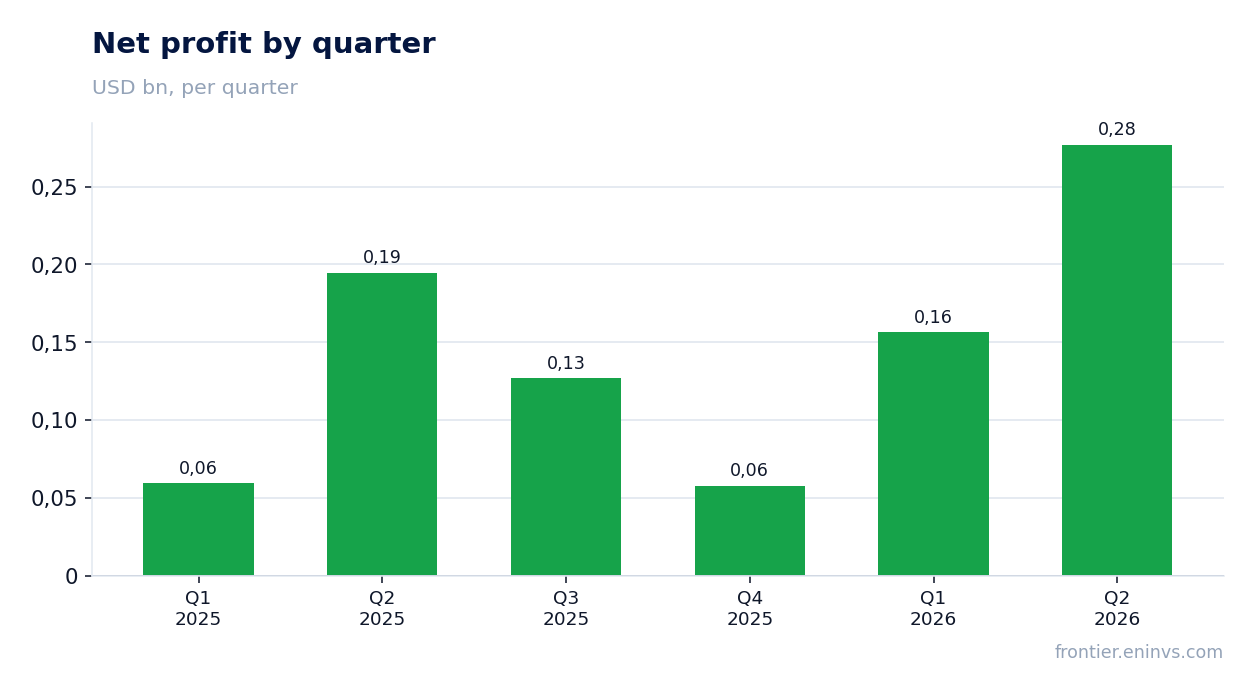
The EBITDA margin expanded to 8.7% from 5.3%, the highest level in the last five quarters
The EBITDA margin in Q2 2026 reached 8.7%, compared with 5.3% a year earlier. This is the highest level in the last five quarters: in Q1 2026 the margin was 6.2%, in Q4 2025 – 4.1%.
The margin expansion is explained by EBITDA growing faster than revenue: revenue rose 21.9%, while EBITDA jumped 101.2%. This points to improved operational efficiency, possibly through lower relative costs.
The net margin also improved: in the reporting quarter it was 3.7% versus 3.2% a year earlier. However, net profit growth was less pronounced (42.3%) than EBITDA growth, which may be due to higher depreciation, interest, or taxes.
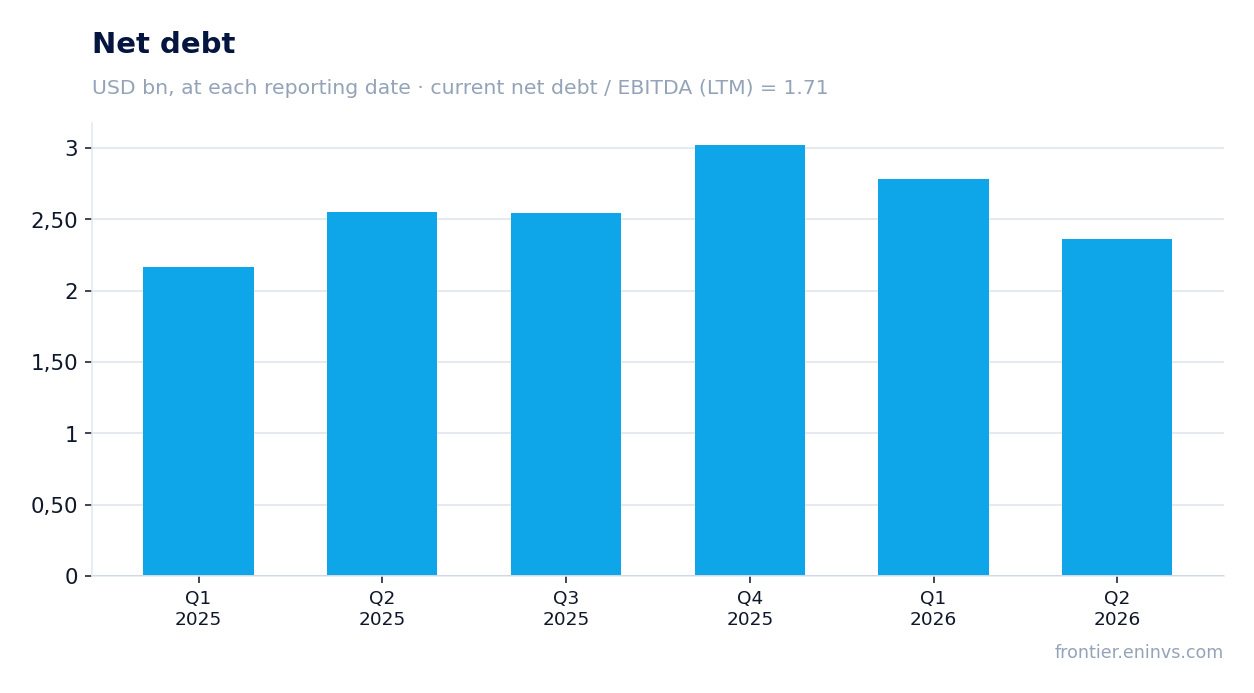
Net profit increased 42.3% to 276.9 million, while operating cash flow reached 856.1 million – more than three times net profit
Ultrapar's net profit in Q2 2026 was 276.9 million, up 42.3% from 194.6 million a year earlier. This is the best quarterly result in the last five quarters: in Q1 2026 profit was 156.5 million, in Q4 2025 – 57.8 million.
Operating cash flow in the reporting quarter reached 856.1 million, significantly exceeding net profit. This may indicate high earnings quality and efficient working capital management. For comparison: in Q1 2026 operating cash flow was 197.1 million, while in Q4 2025 it was negative (-113.7 million).
Over the trailing twelve months operating cash flow amounted to 974.7 million, while net profit was 618.0 million. The excess of cash flow over profit persists, which is a positive signal for financial stability.
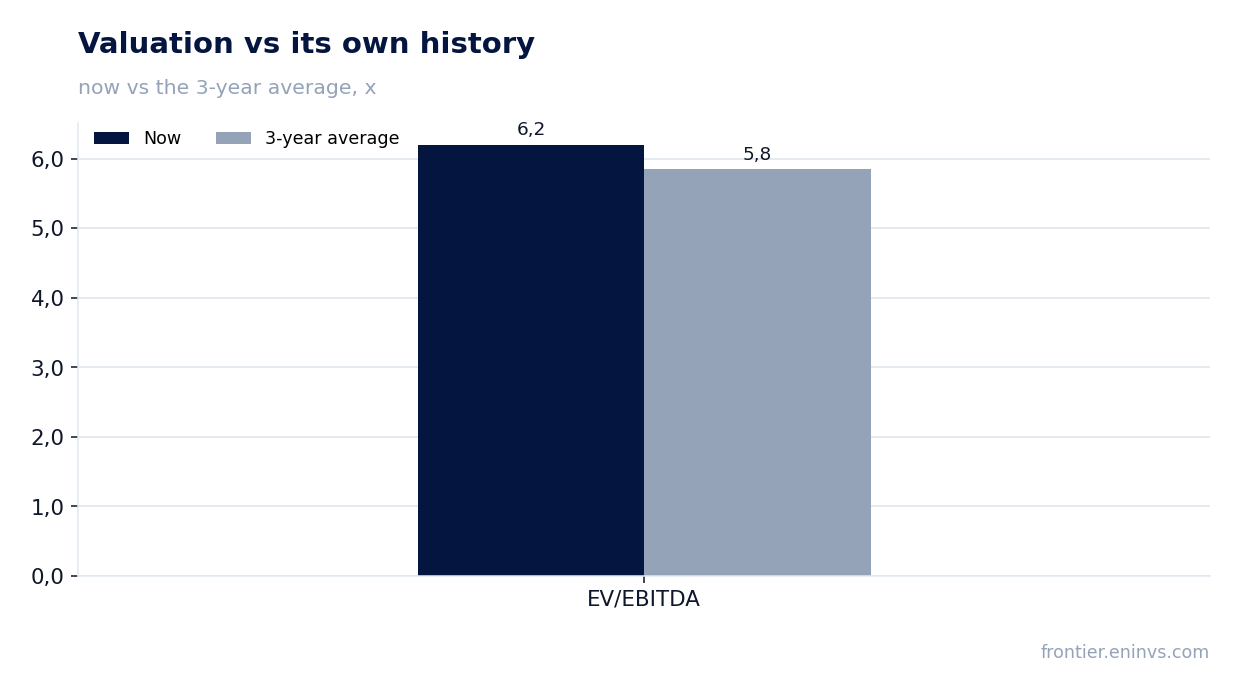
Leverage remains moderate: net debt / LTM EBITDA stands at 1.71, and net debt itself fell to 2,362.9 million from 3,024.3 million at end-2025
Ultrapar's net debt at the end of Q2 2026 was 2,362.9 million, down from 3,024.3 million at end-2025. This decrease occurred alongside EBITDA growth, improving the debt burden.
The net debt / LTM EBITDA ratio stands at 1.71. This is a moderate level that does not raise concerns. However, the previous value of this ratio is not provided in the data, so it cannot be stated that leverage fell or rose – only the current level can be noted.
Interest expenses are not disclosed in the provided data, but given the growth in operating profit and cash flow, debt servicing is likely not burdensome.
Trailing twelve-month dividend yield is 2.6%, below the key rate, but the payout could rise with profit
Ultrapar's trailing twelve-month dividend yield is 2.6%. This is below the current key rate, making the stock less appealing to income-oriented investors.
The company did not disclose the size of the latest dividend or the payout ratio in the provided data. However, given the rise in net profit in Q2 2026 to 276.9 million and over the trailing twelve months to 618.0 million, dividend payments could increase this year if the company maintains or raises its payout ratio.
The main risk to dividends is a possible increase in capital expenditures or deterioration in cash flow. In the reporting quarter capital expenditures were 73.6 million, insignificant compared with operating cash flow of 856.1 million, so the current investment level does not threaten payouts.
On the portal's model the stock trades at a discount to fair value, with upside estimated at +73%
According to the portal's model, Ultrapar's fair value implies +73% upside to the current price. This is the portal's own estimate, based on EBITDA growth and a target multiple, not a market consensus.
The current EV/EBITDA multiple is 6.2, slightly above the three-year average of 5.8. Thus, the stock trades a bit above its historical norm but is still far from overvalued, especially given high EBITDA growth.
The trailing twelve-month P/E is 12.8, which also looks moderate. If current profit growth rates persist and leverage remains stable, the stock could continue to re-rate toward fair value.
Valuation on the latest reported figures
| Metric | Value |
|---|---|
| Market cap | 7.93 bn USD |
| P/E (LTM) | 12.8 |
| EV/EBITDA (LTM) | 6.2 |
| P/B | 2.83 |
| Net debt / EBITDA (LTM) | 1.71 |
| Operating cash flow (LTM) | 0.97 bn |
| ROE | 36.0% |
| Dividend yield (12m) | 2.6% |
| EV/EBITDA, 3-year average | 5.8 |
Bottom line
Ultrapar delivered strong Q2 2026 results: revenue rose 21.9%, EBITDA doubled, and the margin reached 8.7%. However, half of the EBITDA growth is explained by a low year-ago base. Net profit increased 42.3%, and operating cash flow significantly exceeded profit, indicating high earnings quality. Leverage is moderate, and the dividend yield is modest. On the portal's model the stock has +73% upside, which, combined with an EV/EBITDA of 6.2 versus the 5.8 average, makes it attractive for investors willing to accept the risk of slowing growth.
Open the company's financial profile UGP →
See also: market overview · valuation map · stock screeners