Usiminas: profit up 3.7x, but the entire gain came from financial lines, not steelmaking
On 25 August Usiminas reported results for the second quarter of 2026. Revenue added 1.6% year on year to $1,207.4 mn, EBITDA jumped 94.9% to $157.3 mn, and net profit rose 3.7x to $84.3 mn. The EBITDA margin climbed to 13.0% from 6.8% a year earlier, and the net margin to 7.0% from 1.9%. The stock looks neutral: the trailing-twelve-month EV/EBITDA multiple of 28.1x is far above its own history, and even a strong quarter does not make the valuation attractive.
Key takeaways
— Revenue added just 1.6% year on year, and the entire gain came from prices, not volumes
— EBITDA rose 94.9% on a nearly flat top line – the margin climbed from 6.8% to 13.0%
— Net profit rose 3.7x, but operating profit contributed only 114.2 mn of the 84.3 mn bottom line
— The company held a net cash position for a second consecutive quarter: net debt of minus 118.0 mn
— Operating cash flow of 70.5 mn was almost entirely absorbed by capital expenditure of 50.2 mn
— EV/EBITDA of 28.1x on a trailing-twelve-month basis is far above its own history, and that is the main argument against buying
Attractiveness
Key figures, USD bn
| Metric | Q2 2025 | Q2 2026 | Change |
|---|---|---|---|
| Revenue | 1.19 | 1.21 | +1.6% |
| EBITDA | 0.08 | 0.16 | +94.9% |
| Operating profit | 0.02 | 0.11 | +376.5% |
| Net profit | 0.02 | 0.08 | +268.4% |
| Operating cash flow | 0.11 | 0.07 | -36.1% |
| Capex | 0.05 | 0.05 | -1.9% |
| EBITDA margin | 6.8% | 13.0% | +6.2 pp |
| Net margin | 1.9% | 7.0% | +5.1 pp |
Revenue added just 1.6% year on year, and the entire gain came from prices, not volumes
Revenue in the second quarter of 2026 came to $1,207.4 mn, up 1.6% from the same quarter a year earlier. This is the second consecutive quarter of positive year-on-year dynamics after a 4.1% decline in the first quarter of 2026. The growth is minimal and is not accelerating: in the third quarter of 2025 revenue was adding 3.7% year on year, so the current pace is actually slower.
With a nearly flat top line, the main contribution to the financial result came not from shipments but from pricing and sales mix. The company does not disclose production and sales volumes in the provided data, so it is impossible to decompose the 1.6% into price and volume. But the very fact that EBITDA grew 94.9% on 1.6% revenue growth suggests operating leverage worked not through scale but through internal efficiency or a favourable price spread.
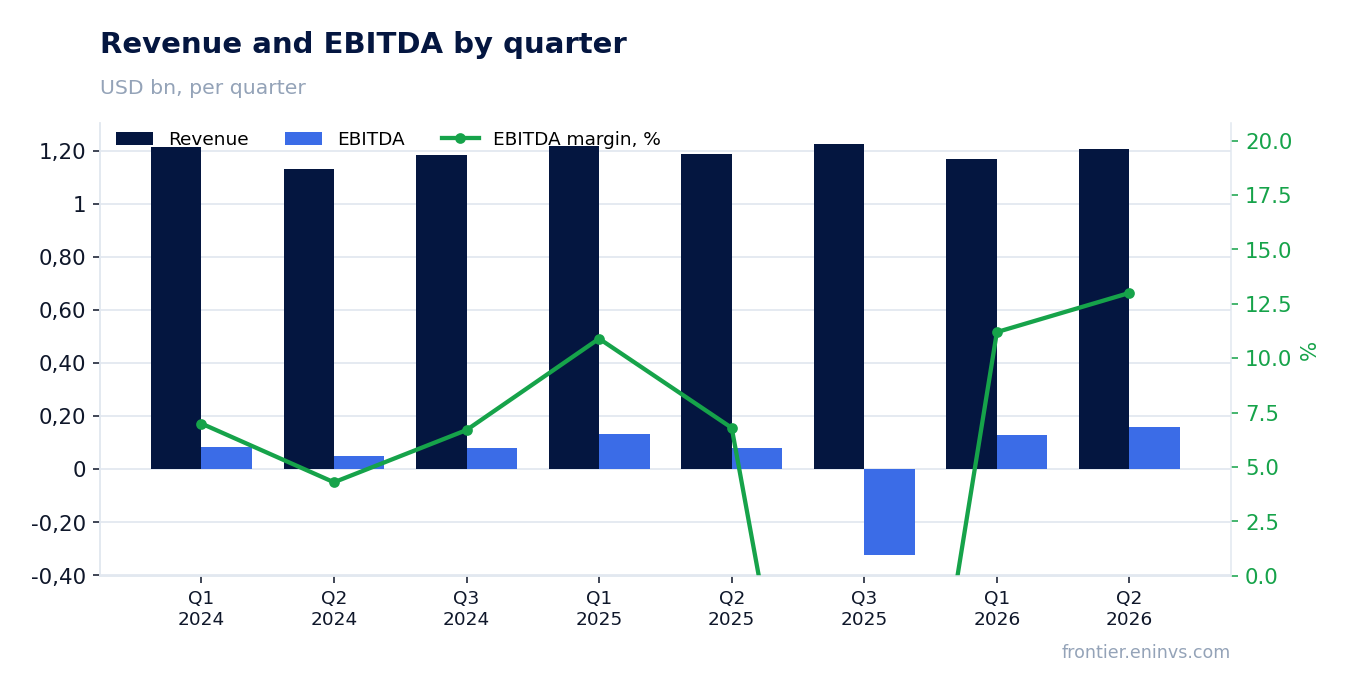
EBITDA rose 94.9% on a nearly flat top line – the margin climbed from 6.8% to 13.0%
EBITDA in the second quarter of 2026 came to $157.3 mn, up 94.9% from a year earlier. The EBITDA margin rose to 13.0% from 6.8% in the second quarter of 2025. This is the best quarterly margin reading at least since the first quarter of 2025, when the EBITDA margin was around 10.9%.
Operating profit rose to $114.2 mn from 24.0 mn a year earlier. The gap between EBITDA and operating profit is about 43 mn, roughly corresponding to depreciation. The main contribution to the margin gain came from lower unit costs: with revenue up 1.6%, cost of goods sold and operating expenses clearly did not rise proportionally, judging by the profit dynamics. The company does not disclose cost line details, so the exact source of savings cannot be named, but the scale of the improvement – a 1.9x margin increase – points to a serious internal shift.
The sustainability of this margin will be tested next quarter: if revenue growth stays at 1–2% and the margin holds above 12%, it will mean the company has reached a new efficiency level. If the margin returns to 7–8%, the current quarter will prove to be a one-off spike.
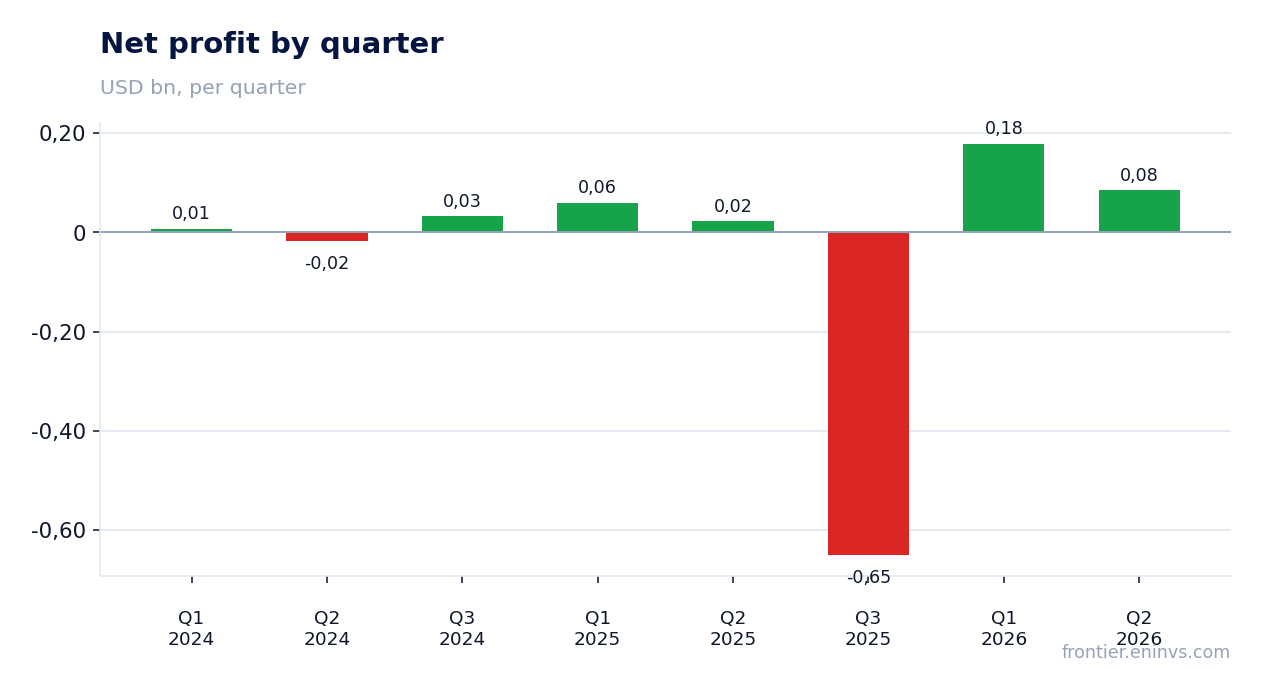
Net profit rose 3.7x, but operating profit contributed only 114.2 mn of the 84.3 mn bottom line
Net profit in the second quarter of 2026 came to $84.3 mn, 3.7x the 22.9 mn a year earlier. However, operating profit of 114.2 mn exceeds net profit, meaning the company incurred net expenses below the operating line – likely financial and tax. This is a key point: the entire net profit gain was driven not only by improved operating efficiency but also by a reversal in financial items.
In the first quarter of 2026 net profit was even higher – 178.6 mn, nearly double the second quarter. This dynamics suggests a significant one-off factor in the first quarter, possibly related to foreign exchange differences or asset sales. In the second quarter profit normalised but remains high relative to last year.
For assessing profit sustainability, it is important that operating profit in the second quarter of 2026 (114.2 mn) significantly exceeds operating profit in the first quarter of 2026 (74.5 mn). That is, the operating business is improving, not deteriorating. This is a positive signal that partly offsets the question about one-off factors in the first quarter.
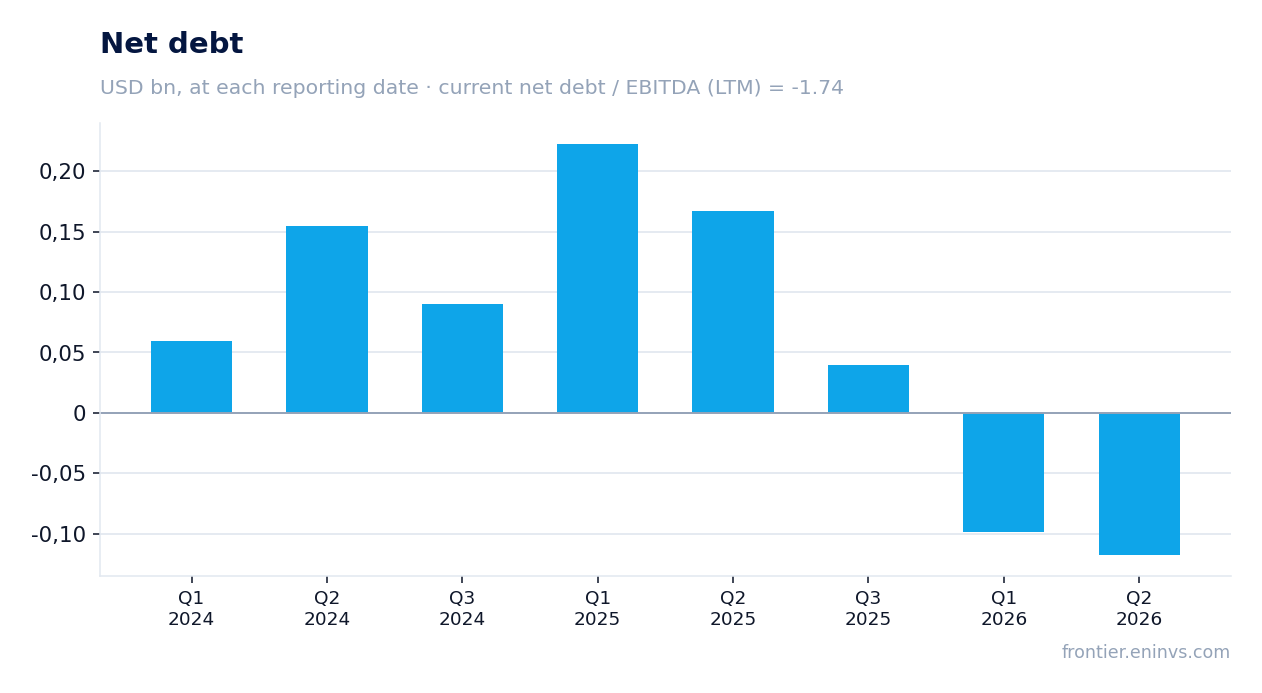
The company held a net cash position for a second consecutive quarter: net debt of minus 118.0 mn
Net debt at the end of the second quarter of 2026 stood at minus $118.0 mn, meaning cash exceeds debt obligations. This is the second consecutive quarter with negative net debt: at the end of the first quarter of 2026 the figure was minus 98.5 mn. A year earlier, at the end of the second quarter of 2025, net debt was positive at 166.8 mn.
The net debt to EBITDA ratio for the trailing twelve months is minus 1.74, reflecting a net cash position. This is a level, not a direction: comparison with a previous value is impossible because it is not in the provided data. But the very fact that the company has net cash rather than debt removes the question of debt burden for the coming quarters.
Interest expenses are likely minimal or absent, given the negative net debt. This means financial expenses are not weighing on net profit, and the entire operating result almost fully reaches the bottom line, less taxes.
Operating cash flow of 70.5 mn was almost entirely absorbed by capital expenditure of 50.2 mn
Operating cash flow in the second quarter of 2026 came to $70.5 mn, while capital expenditure was $50.2 mn. Free cash flow was therefore about 20.3 mn, which against net profit of 84.3 mn means the quality of earnings is not high: a significant portion of profit is tied up in working capital or goes into investment.
For comparison: in the first quarter of 2026 operating cash flow was 73.7 mn and capital expenditure 52.9 mn, giving free cash flow of about 20.8 mn. The dynamics are stable but not impressive. The company generates cash flow sufficient to maintain current operations but not for significant shareholder payouts or debt reduction (of which there is none).
Capital expenditure in the second quarter of 2026 (50.2 mn) is slightly lower than a year earlier (51.2 mn) and lower than in the first quarter of 2026 (52.9 mn). This may indicate that the investment programme is in its final stage or that the company is optimising costs. In any case, capex remains at about 4% of revenue, which is fairly modest for steelmaking.
EV/EBITDA of 28.1x on a trailing-twelve-month basis is far above its own history, and that is the main argument against buying
The trailing-twelve-month EV/EBITDA multiple stands at 28.1x. This is a very high level, reflecting not so much current profitability as a distorted base: trailing-twelve-month EBITDA is only $58.1 mn, well below the second-quarter 2026 EBITDA of 157.3 mn. The reason is weak results in the third quarter of 2025, when EBITDA was negative (minus 324.6 mn).
The company's market capitalisation is $1,734.9 mn, and net debt is negative (minus 101.1 mn), giving an enterprise value of about 1,633.8 mn. Against trailing-twelve-month EBITDA of 58.1 mn, this yields the 28.1x multiple. If one used the latest quarter's EBITDA of 157.3 mn and annualised it, the multiple would fall to about 10.4x, but that does not conform to the trailing-twelve-month methodology.
Comparing the current multiple with its own three-year history is impossible because historical EV/EBITDA values are not in the provided data. However, it is clear that 28.1x is a level that requires either a sharp recovery in EBITDA in coming quarters or a significant decline in market capitalisation to return to normal values. So far the company is showing strong quarterly EBITDA, but the trailing-twelve-month figure remains depressed.
Valuation on the latest reported figures
| Metric | Value |
|---|---|
| Market cap | 1.73 bn USD |
| EV/EBITDA (LTM) | 28.1 |
| P/B | 0.40 |
| Net debt / EBITDA (LTM) | -1.74 |
| Operating cash flow (LTM) | 0.40 bn |
| ROE | 7.2% |
Bottom line
Bottom line: the second quarter of 2026 was strong operationally – EBITDA rose 94.9%, the margin climbed to 13.0%, and the company maintains a net cash position. However, revenue added only 1.6%, and net profit of 84.3 mn came in below operating profit of 114.2 mn, indicating pressure from financial items. The key question for a holder is valuation: the trailing-twelve-month EV/EBITDA of 28.1x is far above historical levels, and even with a strong quarter the stock does not look cheap. Verdict – neutral: the operating turnaround is evident, but it is largely priced in, and the sustainability of the margin and cash flow needs confirmation next quarter.
Open the company's financial profile USIM →
See also: market overview · valuation map · stock screeners