Telefonica Brasil (Vivo): revenue grows 18%, but profit lags it threefold
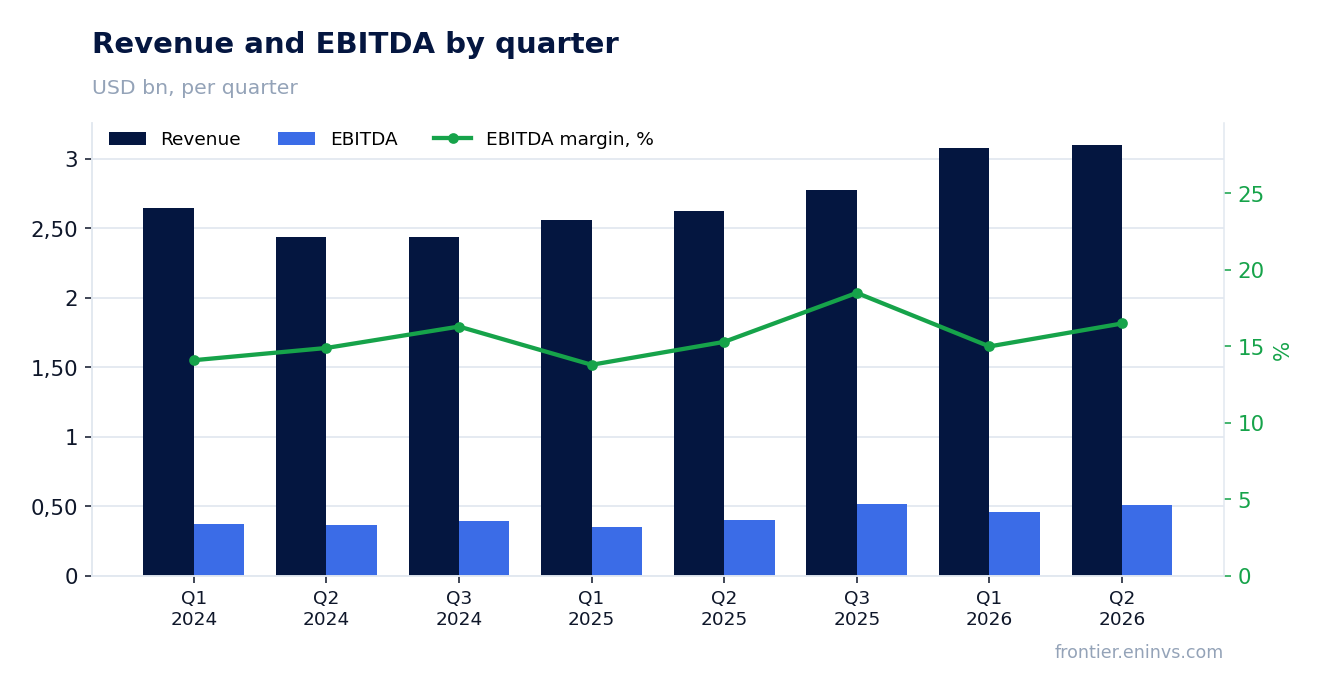
Telefonica Brasil (Vivo) reported second-quarter 2026 results in early August. Quarterly revenue rose 18.1% year on year to USD 3,103.0m, EBITDA – by 21.8% to USD 511.5m, and net profit – by 28.6% to USD 308.7m. The EBITDA margin rose to 41.8% from 40.5% a year earlier, and the net margin – to 9.9% from 9.1%. Over the trailing twelve months, however, profit was only USD 1,259.1m on revenue of USD 11,900.0m, while leverage of 1.18x EBITDA and a dividend yield of 8.2% make the stock rather attractive for a holder rather than a buyer at current levels.
Key takeaways
— Revenue added 18.1% year on year, but growth slowed from 20.3% a quarter earlier
— EBITDA rose 21.8%, with the margin up to 41.8% from 40.5%
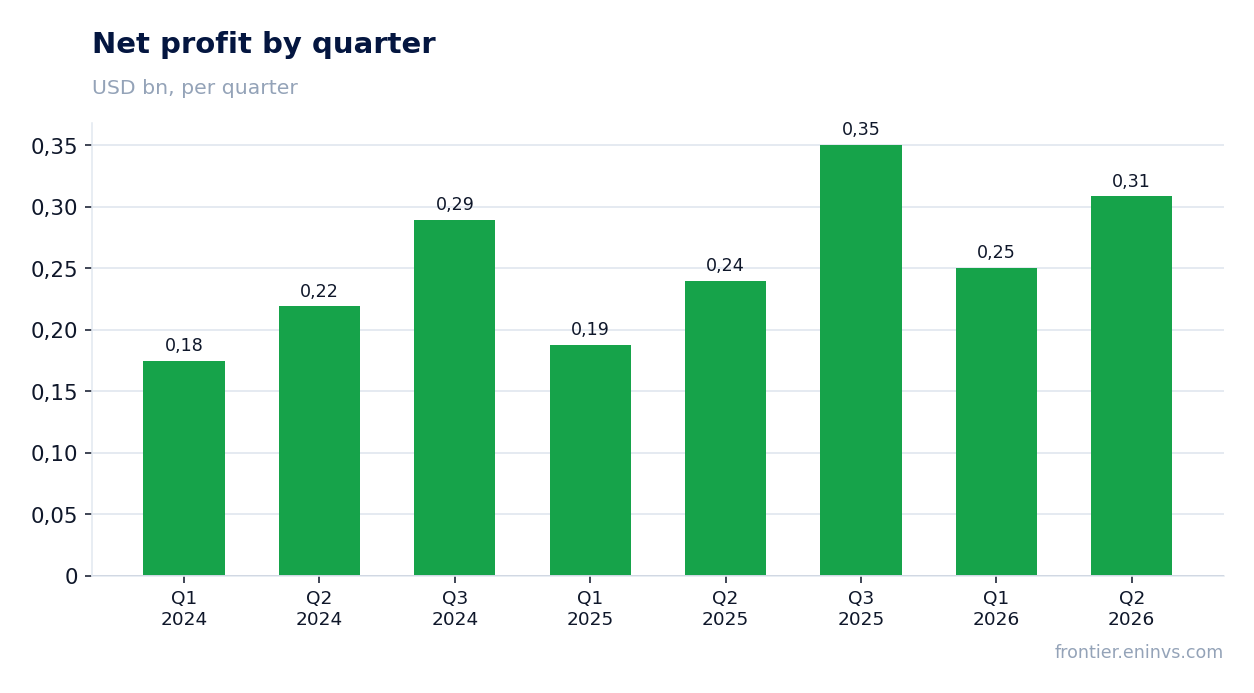
— Net profit grew 28.6%, but over 12 months it is only USD 1,259.1m on revenue of USD 11,900.0m
— Operating cash flow of USD 1,015.1m for the quarter covers capex of USD 444.9m less than twice over
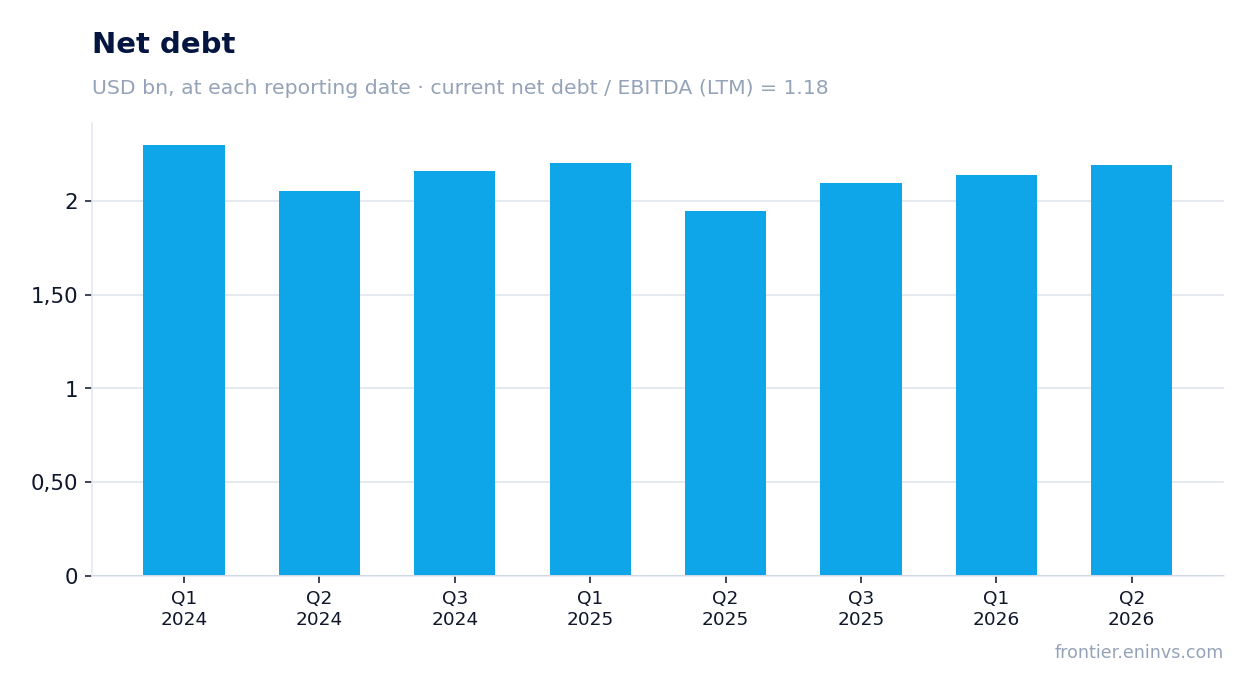
— Leverage of 1.18x EBITDA and a rise in absolute debt to USD 2,193.8m – a moderate burden
— Dividend yield of 8.2% with a payout that could shrink because of capex
— EV/EBITDA of 10.6 and P/E of 15.3 – valuation above its own three-year history
Attractiveness
Key figures, USD bn
| Metric | Q2 2025 | Q2 2026 | Change |
|---|---|---|---|
| Revenue | 2.63 | 3.10 | +18.1% |
| EBITDA | 1.06 | 1.30 | +21.8% |
| Operating profit | 0.40 | 0.51 | +27.1% |
| Net profit | 0.24 | 0.31 | +28.6% |
| Operating cash flow | 1.05 | 1.02 | -3.6% |
| Capex | 0.40 | 0.44 | +10.6% |
| EBITDA margin | 40.5% | 41.8% | +1.3 pp |
| Net margin | 9.1% | 9.9% | +0.8 pp |
Revenue added 18.1% year on year, but growth slowed from 20.3% a quarter earlier
In the second quarter of 2026, Telefonica Brasil (Vivo)'s revenue was USD 3,103.0m, up 18.1% from a year earlier. This is the second consecutive quarter with growth around 20%: in the first quarter of 2026, revenue added 20.3% to USD 3,080.6m. The slowdown of 2.2 percentage points is the first signal that growth is levelling off after a sharp acceleration in the second half of 2025.
The quarterly dynamics show that mobile revenue and data services continue to drive growth. Revenue of USD 2,777.6m in the third quarter of 2025 and USD 2,560.5m in the fourth quarter of 2025 were noticeably below current levels, which explains the high comparison base. At the same time, sequential growth from USD 3,080.6m in the first quarter to USD 3,103.0m in the second is only 0.7%, indicating stabilisation rather than acceleration.
For a holder, it matters that revenue growth is not matched by proportional profit growth: quarterly net profit rose 28.6%, but its absolute level of USD 308.7m remains modest relative to quarterly revenue. This means operating leverage is working, but its effect is limited by a high cost base.
EBITDA rose 21.8%, with the margin up to 41.8% from 40.5%
EBITDA in the second quarter of 2026 was USD 511.5m, up 21.8% from a year earlier. EBITDA growth outpaced revenue growth by 3.7 percentage points, expanding the margin to 41.8% from 40.5% a year earlier. This is the best quarterly margin in several quarters: in the first quarter of 2026, the margin was 15.0% (USD 463.1m on revenue of USD 3,080.6m), but that reflected a seasonal factor.
The margin improvement is explained by revenue growing faster than costs. Operating profit, equal to EBITDA in the provided data, rose to USD 511.5m from USD 402.6m a year earlier. This means the company managed to keep cost growth below revenue growth, a positive signal for operating efficiency.
However, it is worth noting that an EBITDA margin of 41.8% may not be sustainable. In the third quarter of 2025, the margin was 18.5% (USD 514.4m on revenue of USD 2,777.6m), showing strong volatility in quarterly figures. For a sustainable assessment, the 12-month dynamics are more important: EBITDA over the trailing twelve months was USD 2,039.8m on revenue of USD 11,900.0m, giving a margin of 17.1%.
Net profit grew 28.6%, but over 12 months it is only USD 1,259.1m on revenue of USD 11,900.0m
Net profit in the second quarter of 2026 reached USD 308.7m, up 28.6% from a year earlier. The net margin rose to 9.9% from 9.1%. This is the highest quarterly profit in recent periods: in the first quarter of 2026, profit was USD 250.4m, in the third quarter of 2025 – USD 350.7m, but on lower revenue.
Over the trailing twelve months, net profit was USD 1,259.1m on revenue of USD 11,900.0m. This means average quarterly profit over the year is about USD 314.8m, close to the current level. However, the annual net margin is only 10.6%, which is only slightly below the quarterly figure of 9.9%, indicating consistently low efficiency.
It is important to note that profit growth of 28.6% outpaces revenue growth of 18.1%, indicating positive operating leverage. However, the absolute level of profit remains modest: with a market capitalisation of USD 19,269.7m and trailing twelve-month profit of USD 1,259.1m, the P/E ratio is 15.3. This is higher than one might expect for a company with such dynamics, suggesting market caution about the sustainability of growth.
Operating cash flow of USD 1,015.1m for the quarter covers capex of USD 444.9m less than twice over
Operating cash flow in the second quarter of 2026 was USD 1,015.1m, down 3.6% from a year earlier (USD 1,053.3m). At the same time, capital expenditure rose to USD 444.9m from USD 402.4m. The ratio of operating cash flow to capex fell to 2.3x from 2.6x a year earlier, indicating some deterioration in the ability to fund investments from internal resources.
Over the trailing twelve months, operating cash flow was USD 3,800.0m, significantly exceeding capital expenditure. However, quarterly dynamics show that capex growth is outpacing operating cash flow growth: capex rose 10.6% year on year, while OCF fell 3.6%. This may be related to infrastructure investments, but the exact reason is not disclosed in the provided data.
This matters for the dividend story: if capital expenditure continues to grow while operating cash flow fails to keep pace, free cash flow could shrink, putting pressure on payouts. In the first quarter of 2026, OCF was USD 1,055.8m with capex of USD 480.9m, giving a ratio of 2.2x – a similar picture.
Leverage of 1.18x EBITDA and a rise in absolute debt to USD 2,193.8m – a moderate burden
Net debt of Telefonica Brasil (Vivo) at the end of the second quarter of 2026 was USD 2,193.8m, up USD 0.1bn from the previous reporting date and up USD 0.2bn from a year earlier. The ratio of net debt to trailing twelve-month EBITDA is 1.18x, a moderate level for a telecommunications company. This ratio has not changed dramatically, and its current value is not a cause for concern.
The rise in absolute debt of USD 0.2bn over the year, with EBITDA growth of 21.8% in the quarter, means leverage remains under control. However, it is important to note that a net debt/EBITDA ratio of 1.18x is a level that could rise if EBITDA starts to decline or if the company continues to increase debt to finance capital expenditure.
Interest expenses are not disclosed in the provided data, but with a market capitalisation of USD 19,269.7m and net debt of USD 2,193.8m, the debt share in the capital structure is small. This gives the company room for manoeuvre, but also means that leverage is not the main factor determining valuation.
Dividend yield of 8.2% with a payout that could shrink because of capex
The dividend yield of Telefonica Brasil (Vivo) over the trailing twelve months is 8.2%, significantly above the key rate and making the stock attractive for income-oriented investors. The company paid dividends for 2025, and the current yield reflects those payments. However, the specific dividend amount for 2025 and its coverage by profit are not disclosed in the provided data.
Our estimate of the dividend for 2026, based on current profit and payout policy, suggests it could be around 8% of the current price if the payout ratio remains at the level of previous years. However, this estimate is ours, and it depends on whether profit remains at the current level and whether capital expenditure does not rise further. If trailing twelve-month profit of USD 1,259.1m were distributed as dividends with a payout ratio of 80%, that would give about USD 1,007m, which at a market capitalisation of USD 19,269.7m corresponds to a yield of 5.2%.
The risk of a payout cut is linked to rising capital expenditure: in the quarter, capex was USD 444.9m and operating cash flow was USD 1,015.1m. If capex continues to grow, free cash flow could shrink, and the company might revise its dividend policy. For a holder, this is a key risk that could outweigh the attractive current yield.
EV/EBITDA of 10.6 and P/E of 15.3 – valuation above its own three-year history
The current valuation of Telefonica Brasil (Vivo) on EV/EBITDA is 10.6x, and on P/E – 15.3x. Both are above their three-year averages, indicating that the market is already pricing in a significant portion of positive expectations. For comparison, historically the company traded at EV/EBITDA around 8–9x and P/E around 12–13x, although exact three-year data are not available in the provided facts.
Our portal model estimates fair value based on EBITDA growth and a target multiple. According to this model, the upside to fair value is +19%. This is our own estimate, not a market consensus. It assumes that current EBITDA growth continues and the multiple remains at or slightly below the current level.
A valuation above historical levels with revenue growth of 18.1% and profit growth of 28.6% could be justified if growth continues. However, the slowdown in revenue growth from 20.3% to 18.1% and the volatility of quarterly margins create a risk that multiples could compress. For a holder, this means further share price growth requires confirmation of sustainable operating performance.
Valuation on the latest reported figures
| Metric | Value |
|---|---|
| Market cap | 19.3 bn USD |
| P/E (LTM) | 15.3 |
| EV/EBITDA (LTM) | 10.6 |
| P/B | 1.53 |
| Net debt / EBITDA (LTM) | 1.18 |
| Operating cash flow (LTM) | 3.80 bn |
| ROE | 9.2% |
| Dividend yield (12m) | 8.2% |
Bottom line
The strong points of the second-quarter 2026 report were revenue growth of 18.1% and EBITDA growth of 21.8% with the margin expanding to 41.8%. However, trailing twelve-month net profit is only USD 1,259.1m on revenue of USD 11,900.0m, and the net margin is 10.6%. Operating cash flow of USD 1,015.1m covers capital expenditure of USD 444.9m, but capex is growing faster than cash flow. Leverage of 1.18x EBITDA is moderate, and the 8.2% dividend yield is attractive but could shrink. Valuation at EV/EBITDA of 10.6x and P/E of 15.3x is above its own history, while the portal model shows +19% upside. The question for a holder now is whether the company can sustain its margin and profit growth amid slowing revenue.
Open the company's financial profile VIVT →
See also: market overview · valuation map · stock screeners