WEG: revenue and profit grew, but quarterly cash flow lagged profit
On 30 July 2026, WEG reported results for the second quarter of 2026. Revenue rose 9.1% year on year to USD 1,997.51 million, EBITDA – by 7.5% to USD 435.72 million, and net profit – by 6.8% to USD 324.24 million. The EBITDA margin slipped to 21.8% from 22.1%, while quarterly operating cash flow was USD 234.10 million against capital expenditures of USD 153.38 million. With a P/E LTM of 32.3 and EV/EBITDA LTM of 27.0, the shares look neutral: growth is present but not accelerating, and cash flow lags profit.
Key takeaways
— Revenue grew 9.1% year on year, but slower than in the previous quarter
— EBITDA rose 7.5%, while the margin slipped to 21.8% from 22.1%
— Net profit grew 6.8%, but operating cash flow was USD 90.1 million lower
— Quarterly capital expenditures reached USD 153.38 million, above last year's USD 104.64 million
— Debt decreased: net cash position reached USD 735.47 million
— Dividend yield of 3.94% with a payout that could grow with profit
— Valuation: P/E LTM 32.3 and EV/EBITDA LTM 27.0 – neutral for a growing but not accelerating company
Attractiveness
Key figures, USD bn
| Metric | Q2 2025 | Q2 2026 | Change |
|---|---|---|---|
| Revenue | 1.83 | 2.00 | +9.1% |
| EBITDA | 0.41 | 0.44 | +7.5% |
| Operating profit | 0.36 | 0.39 | +6.2% |
| Net profit | 0.30 | 0.32 | +6.8% |
| Operating cash flow | 0.26 | 0.23 | -8.5% |
| Capex | 0.10 | 0.15 | +46.6% |
| EBITDA margin | 22.1% | 21.8% | -0.3 pp |
| Net margin | 16.6% | 16.2% | -0.4 pp |
Revenue grew 9.1% year on year, but slower than in the previous quarter
In the second quarter of 2026, WEG's revenue reached USD 1,997.51 million, up 9.1% year on year. This is an acceleration from 5.2% growth in the first quarter of 2026, but a deceleration from 11.6% in the third quarter of 2025. The company did not disclose in the press release which segment or region drove the bulk of the growth, so we limit ourselves to stating: growth is present but uneven quarter to quarter.
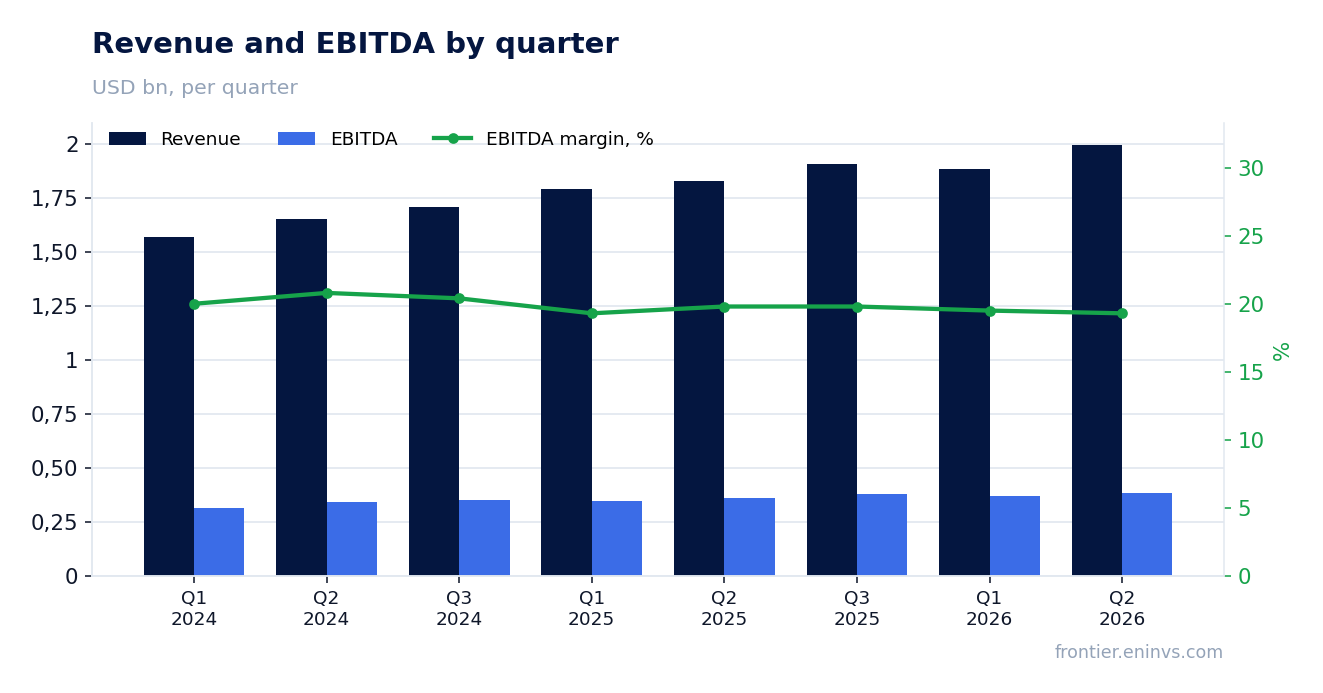
EBITDA rose 7.5%, while the margin slipped to 21.8% from 22.1%
EBITDA in the second quarter of 2026 was USD 435.72 million, up 7.5% year on year. EBITDA growth lagged revenue growth, which pushed the EBITDA margin down to 21.8% from 22.1% a year earlier. This is a slight margin contraction, but it shows that costs are rising faster than revenue. The company did not detail which cost line exerted pressure, so the cause cannot be named.
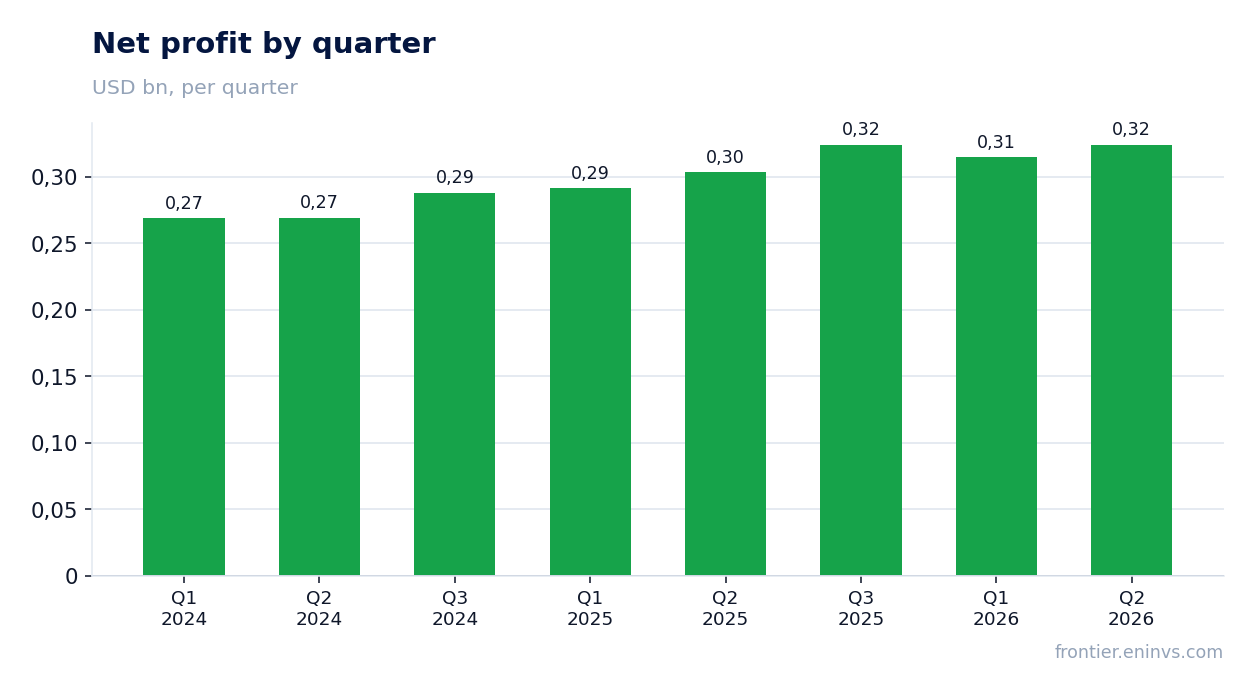
Net profit grew 6.8%, but operating cash flow was USD 90.1 million lower
Net profit in the second quarter of 2026 reached USD 324.24 million, up 6.8% year on year. However, operating cash flow for the same quarter was only USD 234.10 million, i.e. USD 90.1 million less than net profit. This gap could be explained by working capital increases or other non-cash items, but the press release does not provide details. Importantly, cash flow does not fully confirm profit.
Quarterly capital expenditures reached USD 153.38 million, above last year's USD 104.64 million
WEG's capital expenditures in the second quarter of 2026 were USD 153.38 million versus USD 104.64 million a year earlier. The 46.6% year-on-year increase in investment significantly outpaces revenue growth. This may indicate capacity expansion or modernisation, but the company provided no explanation. At the same time, free cash flow (operating cash flow minus capital expenditures) remains positive: 234.10 – 153.38 = USD 80.72 million.
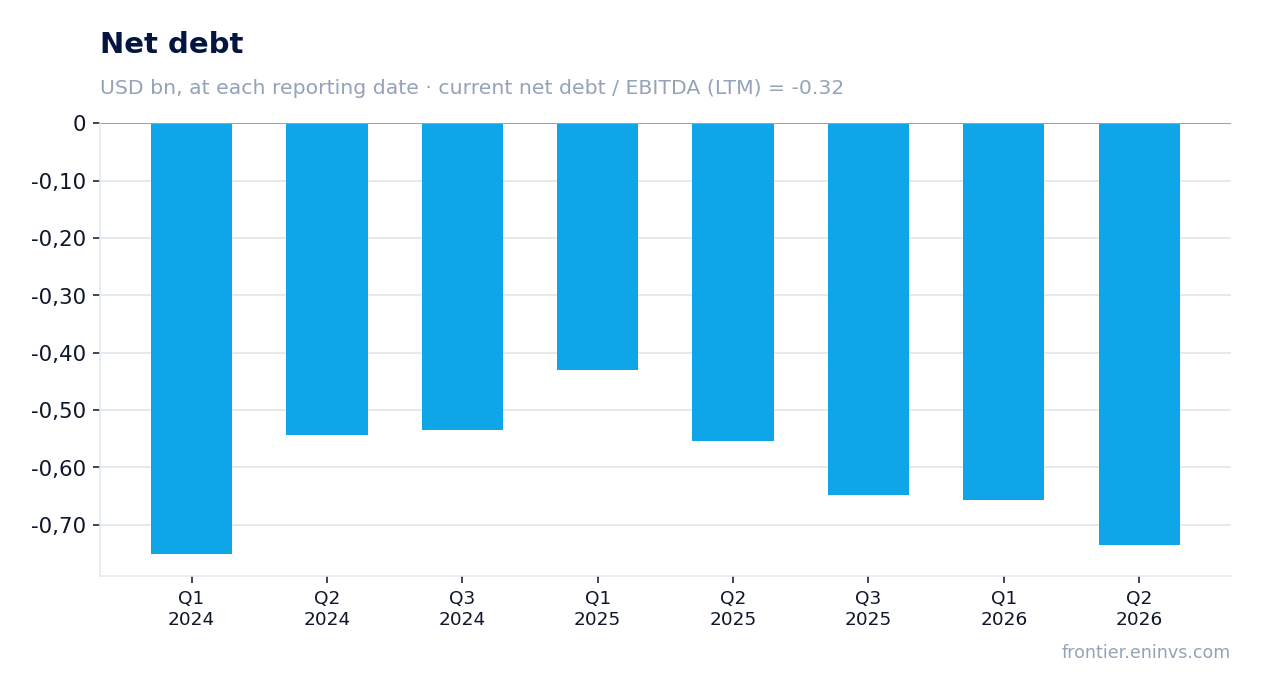
Debt decreased: net cash position reached USD 735.47 million
WEG's net debt at the end of the second quarter of 2026 was minus USD 735.47 million, meaning the company has a net cash position. This is USD 0.1 billion less than at the previous reporting date and USD 0.2 billion less than a year earlier. The net debt to EBITDA LTM ratio is -0.32, confirming the absence of debt burden. Interest expenses are not disclosed, but with such a position they are likely insignificant.
Dividend yield of 3.94% with a payout that could grow with profit
WEG's dividend yield over the last 12 months is 3.94%. The company did not disclose in the press release the size of the latest dividend or the payout ratio, so we cannot assess what share of profit it distributes to shareholders. With net profit of USD 1,281.5 million over the last 12 months and a market capitalisation of USD 41,398.73 million, the current yield looks moderate. If profit continues to grow and the payout ratio remains stable, the dividend could increase, but without data on the company's policy this is only an assumption.
Valuation: P/E LTM 32.3 and EV/EBITDA LTM 27.0 – neutral for a growing but not accelerating company
WEG's P/E LTM is 32.3, EV/EBITDA LTM is 27.0. We do not have historical three-year averages for these multiples, so we cannot say whether the current valuation is above or below its own history. According to the portal's model, the upside to fair value is estimated at +4%. That is modest, and with current rates of profit and cash flow growth, the shares appear fairly valued.
Valuation on the latest reported figures
| Metric | Value |
|---|---|
| Market cap | 41.4 bn USD |
| P/E (LTM) | 32.3 |
| EV/EBITDA (LTM) | 27.0 |
| P/B | 12.22 |
| Net debt / EBITDA (LTM) | -0.32 |
| Operating cash flow (LTM) | 1.20 bn |
| ROE | 33.3% |
| Dividend yield (12m) | 3.9% |
Bottom line
Bottom line: WEG showed revenue and profit growth, but the pace slowed compared to previous quarters, and profitability declined slightly. The company maintains a net cash position and low debt burden, which is a strength. However, operating cash flow does not fully confirm profit, and capital expenditures are growing faster than revenue. With P/E of 32.3 and EV/EBITDA of 27.0, the shares are fairly valued, and the portal model's upside is only +4%. Verdict: neutral.
Open the company's financial profile WEGE →
See also: market overview · valuation map · stock screeners