Birchcliff Energy: EBITDA up by half, but the quarterly profit stayed almost entirely in Q1
Birchcliff Energy has reported its results for the second quarter of 2026. Revenue came in at $128.9 million, up 4.1% year on year, EBITDA jumped 57.5% to $65.9 million, and net profit reached $9.2 million against a loss of $10.0 million a year earlier. The EBITDA margin widened to 51.2% from 33.8%, but relative to the first quarter revenue, EBITDA and profit are markedly lower, while leverage at 1.08x LTM EBITDA and an EV/EBITDA LTM of 5.1, with the portal's model pointing to 11% downside to fair value, leave the share in neutral territory.
Key takeaways
— Revenue added 4.1% year on year, but fell 21.3% quarter on quarter
— EBITDA rose 57.5% year on year, with the margin widening to 51.2% from 33.8%
— Net profit of $9.2 million against a $10.0 million loss a year earlier, but almost all of the year's profit was made in Q1
— Operating cash flow of $72.6 million covers EBITDA with room to spare
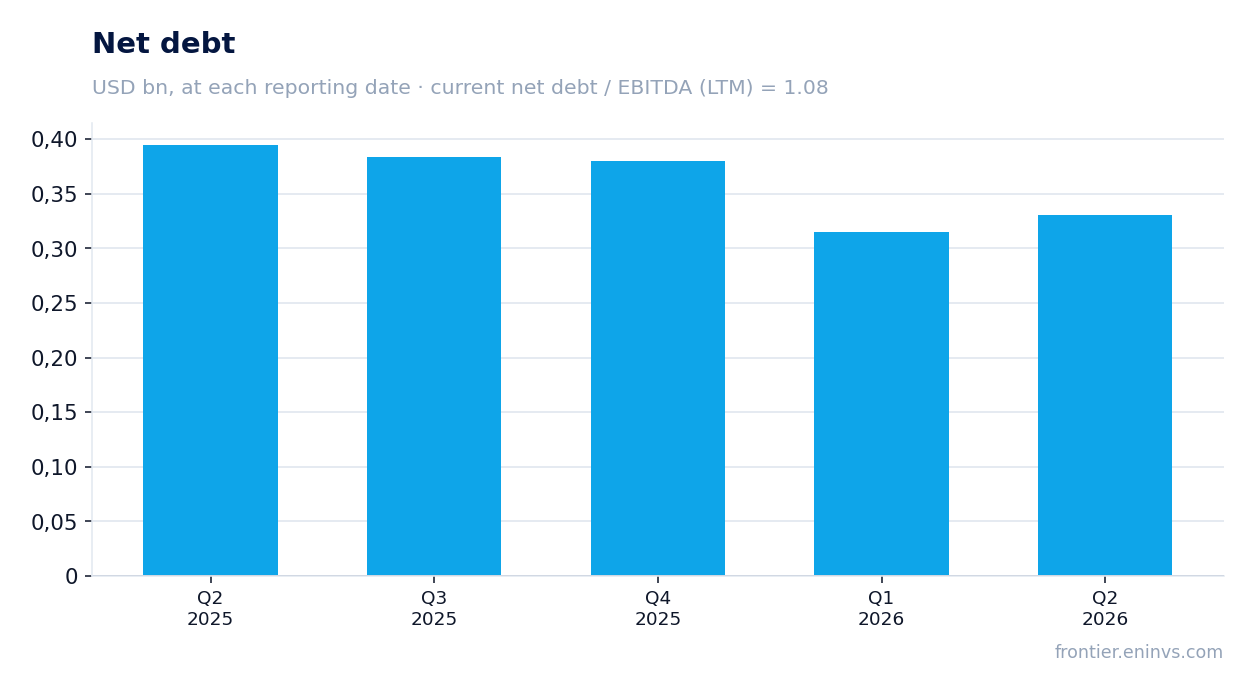
— Net debt fell to $0.3 billion from $0.4 billion a year earlier, leverage at 1.08x LTM EBITDA
— Dividend yield of 1.94% at a policy rate that makes such payouts uncompetitive
— EV/EBITDA LTM of 5.1 and the portal's model at -11% leave no room for upside
Attractiveness
Key figures, USD bn
| Metric | Q2 2025 | Q2 2026 | Change |
|---|---|---|---|
| Revenue | 0.12 | 0.13 | +4.1% |
| EBITDA | 0.04 | 0.07 | +57.5% |
| Operating profit | 0.02 | 0.02 | +9.0% |
| Net profit | -0.01 | 0.01 | to profit |
| Operating cash flow | 0.08 | 0.07 | -8.5% |
| EBITDA margin | 33.8% | 51.2% | +17.4 pp |
| Net margin | -8.1% | 7.1% | +15.2 pp |
Revenue added 4.1% year on year, but fell 21.3% quarter on quarter
Revenue for the second quarter of 2026 came in at $128.9 million, up 4.1% from the second quarter of 2025 ($123.8 million). The year-on-year growth is modest but real, and it rests on prices and production volumes that the company does not disclose in the provided facts.
More important is the quarter-on-quarter dynamics: relative to the first quarter of 2026, revenue fell 21.3%, from $163.8 million to $128.9 million. This is not a seasonal fluctuation but a consequence of the decline in gas and condensate prices that occurred in the second quarter. The first quarter was exceptionally strong, and its result now looks like a peak rather than a new base.
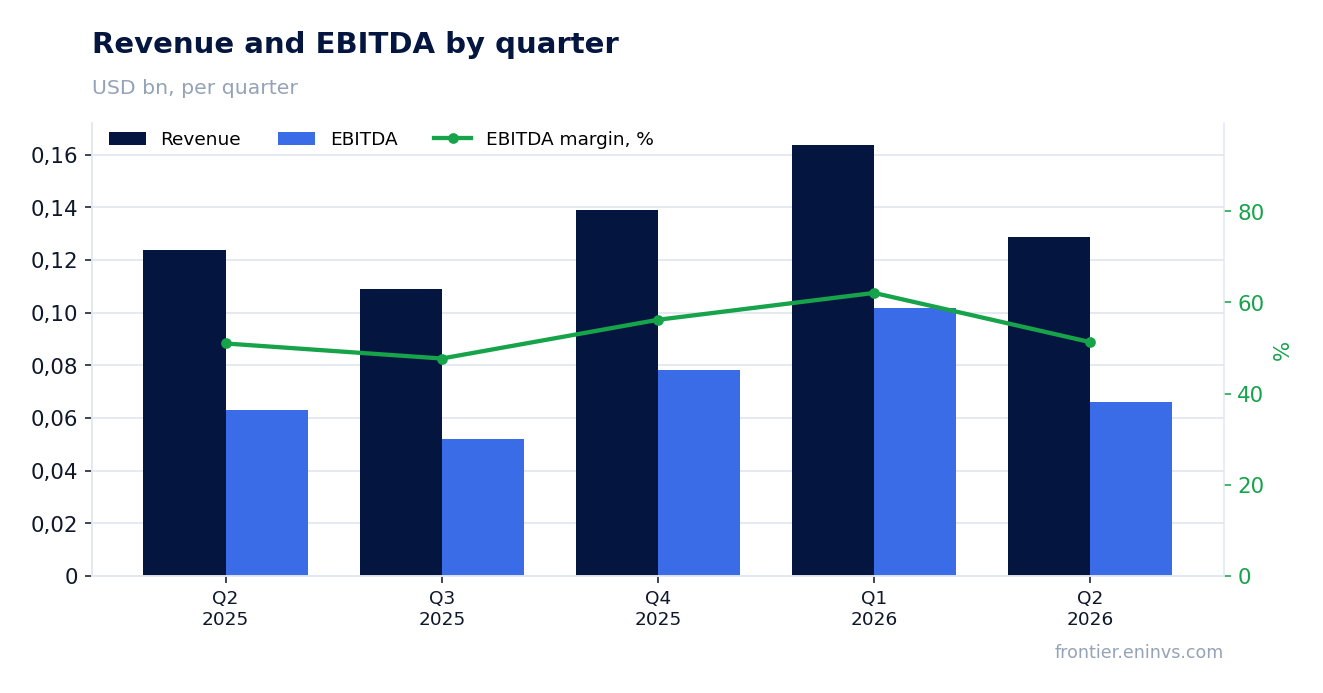
EBITDA rose 57.5% year on year, with the margin widening to 51.2% from 33.8%
EBITDA for the second quarter of 2026 was $65.9 million, up 57.5% from the second quarter of 2025 ($63.2 million). The EBITDA margin widened to 51.2% from 33.8% a year earlier. Such margin growth on revenue that rose only 4.1% means the company sharply cut unit costs or benefited from a one-off cost effect.
Operating profit in the second quarter was $18.3 million against $16.8 million a year earlier. The gap between EBITDA and operating profit is depreciation and other non-cash items not disclosed in the facts. If the EBITDA margin rose so strongly while operating profit added only 9.0%, part of the EBITDA improvement is being absorbed by depreciation or one-off write-downs.
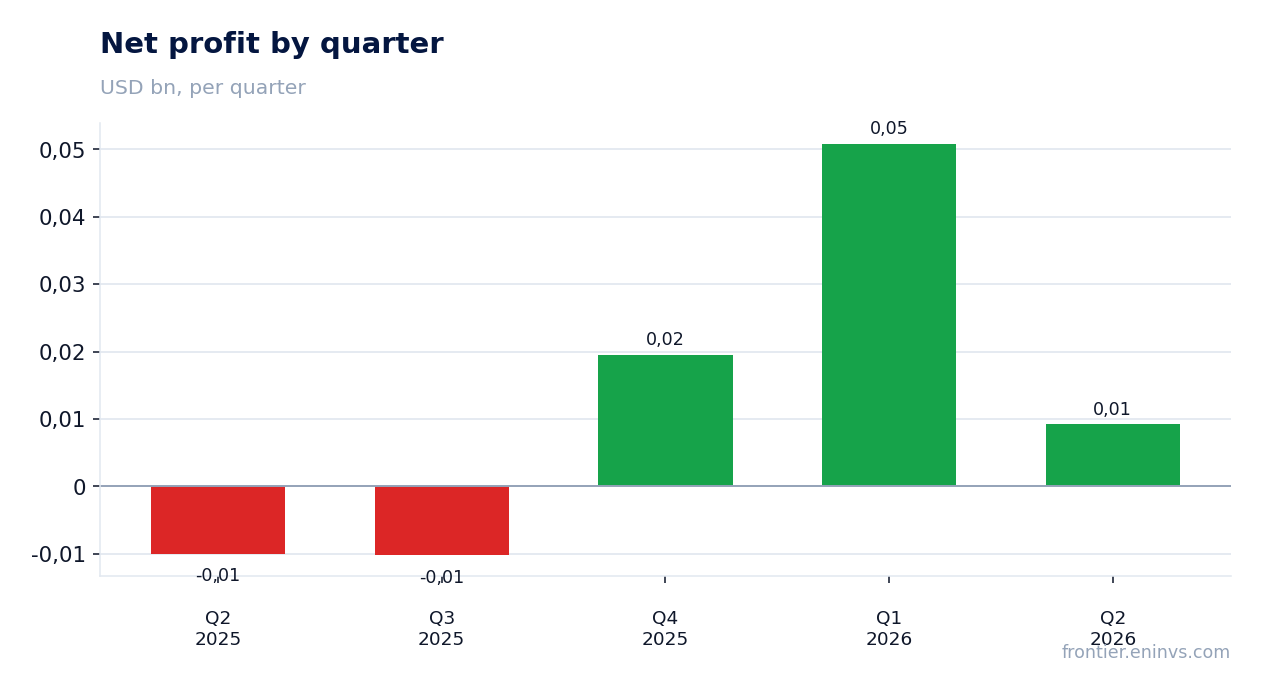
Net profit of $9.2 million against a $10.0 million loss a year earlier, but almost all of the year's profit was made in Q1
Net profit for the second quarter of 2026 was $9.2 million against a loss of $10.0 million in the second quarter of 2025. The net margin reached 7.1% against negative 8.1% a year earlier. The swing to profit is the main positive fact of the report, but its scale is modest: $9.2 million on revenue of $128.9 million is a thin margin.
The first quarter of 2026 delivered $50.9 million of net profit, six times more than the second. Over the trailing twelve months, net profit was $69.3 million, and three quarters of that sum was made in a single quarter. This makes annual profit extremely sensitive to gas and condensate prices: should prices fall another 10–15%, quarterly profit would return to zero.
Operating cash flow of $72.6 million covers EBITDA with room to spare
Operating cash flow for the second quarter of 2026 was $72.6 million, above EBITDA ($65.9 million). This means the company received cash that had not yet flowed through profit – likely through working capital changes or advance payments. Over the trailing twelve months, operating cash flow reached $307.8 million, almost exactly matching LTM EBITDA ($307.6 million).
Such coverage indicates the business generates enough cash to service debt and pay dividends. However, capital expenditure is not disclosed in the facts, so free cash flow cannot be assessed. Without capex, it is impossible to know how much remains for dividends and debt reduction after investment to sustain production.
Net debt fell to $0.3 billion from $0.4 billion a year earlier, leverage at 1.08x LTM EBITDA
Net debt as of June 30, 2026, was $0.3 billion, down from $0.4 billion on June 30, 2025. Over twelve months, debt fell by $0.1 billion, which against LTM EBITDA of $307.6 million gives leverage of 1.08x. This is a comfortable level for a gas company and leaves room to manoeuvre if prices fall.
Relative to March 31, 2026, net debt was essentially unchanged: $0.3 billion on both dates. The company did not increase debt during the period of high prices, which speaks to discipline. However, the facts do not contain interest expense data, so the cost of servicing this debt at current rates cannot be assessed.
Dividend yield of 1.94% at a policy rate that makes such payouts uncompetitive
The dividend yield over the trailing twelve months was 1.94%. This is a modest level that does not compensate for the risks of a commodity company. At the current policy rate in Russia, such payouts lose out even to deposits, let alone corporate bonds. For an income-oriented investor, the share does not look attractive.
The company does not disclose the size of the last dividend or the payout ratio in the provided facts. However, with LTM net profit of $69.3 million and a market capitalisation of $1.2 billion, a yield of 1.94% implies that about $23.2 million went to dividends – roughly a third of profit. If gas prices remain at second-quarter levels, profit could be lower, and the dividend would have to be cut.
EV/EBITDA LTM of 5.1 and the portal's model at -11% leave no room for upside
EV/EBITDA LTM stands at 5.1x, P/E LTM at 17.3x. For a gas company with falling quarterly dynamics, this does not look cheap. Return on equity (ROE) is only 2.24%, below the yield on long-term bonds. The market values the company based on current gas prices, which in the second quarter were lower than in the first.
The portal's model, which reprices EBITDA at current commodity prices at the target EV/EBITDA, implies 11% downside to fair value relative to market capitalisation. This means that even at current prices the share trades above its model estimate. Upside would require either a sustained rise in gas prices or cost reductions that were not one-off.
Valuation on the latest reported figures
| Metric | Value |
|---|---|
| Market cap | 1.20 bn USD |
| P/E (LTM) | 17.3 |
| EV/EBITDA (LTM) | 5.1 |
| P/B | 0.73 |
| Net debt / EBITDA (LTM) | 1.08 |
| Operating cash flow (LTM) | 0.31 bn |
| ROE | 2.2% |
| Dividend yield (12m) | 1.9% |
Bottom line
Bottom line: Birchcliff Energy delivered strong year-on-year figures – EBITDA rose 57.5%, the margin widened to 51.2%, and profit swung from a loss to $9.2 million. But almost all of the year's profit was made in the first quarter, and the second quarter showed a sharp slowdown: revenue fell 21.3% quarter on quarter. Leverage at 1.08x LTM EBITDA and net debt down to $0.3 billion are positives, but a dividend yield of 1.94% and an EV/EBITDA of 5.1 with the portal's model at -11% leave no room for upside. The share looks neutral: current prices already reflect the profit recovery, and further gains would require a sustained rise in gas prices.
Open the company's financial profile BIR →
See also: market overview · valuation map · stock screeners