Cardinal Energy: profit up 4.4x, but half the quarter rests on commodity prices
Cardinal Energy reported second-quarter 2026 results. Revenue rose 80.3% year on year to USD 167.6 million, EBITDA by 157.8% to USD 93.5 million, and net profit by 338.4% to USD 49.2 million. The EBITDA margin climbed to 55.8% from 39.0% a year earlier, while net debt at 30 June stood at USD 92.9 million, or 0.49x trailing-twelve-month EBITDA. At the current price the shares look attractive: the EV/EBITDA multiple of 8.6 compares with a three-year average of 5.8, but the portal model implies 55% upside and a 6.1% dividend yield underpins the valuation.
Key takeaways
— Revenue rose 80.3% year on year to USD 167.6 million, with almost all of the increase coming from higher hydrocarbon prices
— EBITDA climbed 157.8% to USD 93.5 million, lifting the margin to 55.8% from 39.0% a year earlier
— Net profit increased 4.4x to USD 49.2 million, almost entirely from the core business
— Operating cash flow for the quarter was USD 82.6 million, covering capital expenditure and dividends
— Net debt fell to USD 92.9 million, or 0.49x trailing-twelve-month EBITDA
— The trailing-twelve-month dividend yield of 6.1% exceeds the yield on most debt instruments
— EV/EBITDA of 8.6 compares with a three-year average of 5.8, but the portal model implies 55% upside
Attractiveness
Key figures, USD bn
| Metric | Q2 2025 | Q2 2026 | Change |
|---|---|---|---|
| Revenue | 0.09 | 0.17 | +80.3% |
| EBITDA | 0.04 | 0.09 | +157.8% |
| Operating profit | 0.02 | 0.07 | +286.2% |
| Net profit | 0.01 | 0.05 | +338.4% |
| Operating cash flow | 0.03 | 0.08 | +162.2% |
| EBITDA margin | 39.0% | 55.8% | +16.8 pp |
| Net margin | 12.1% | 29.3% | +17.2 pp |
Revenue rose 80.3% year on year to USD 167.6 million, with almost all of the increase coming from higher hydrocarbon prices
Second-quarter 2026 revenue came in at USD 167.6 million, up 80.3% from the same quarter a year earlier. The increase was driven mainly by prices: average hydrocarbon realisations were substantially higher than a year ago. Production volumes remained broadly stable, so almost the entire revenue gain came from price rather than higher output.
The sequential comparison with the first quarter of 2026 also shows strong momentum: revenue rose from USD 121.9 million to USD 167.6 million. The jump reflects both further price gains and narrower discounts on Russian crude. For Cardinal Energy, whose revenue is directly linked to export prices, this was one of the most favourable quarters in recent years.
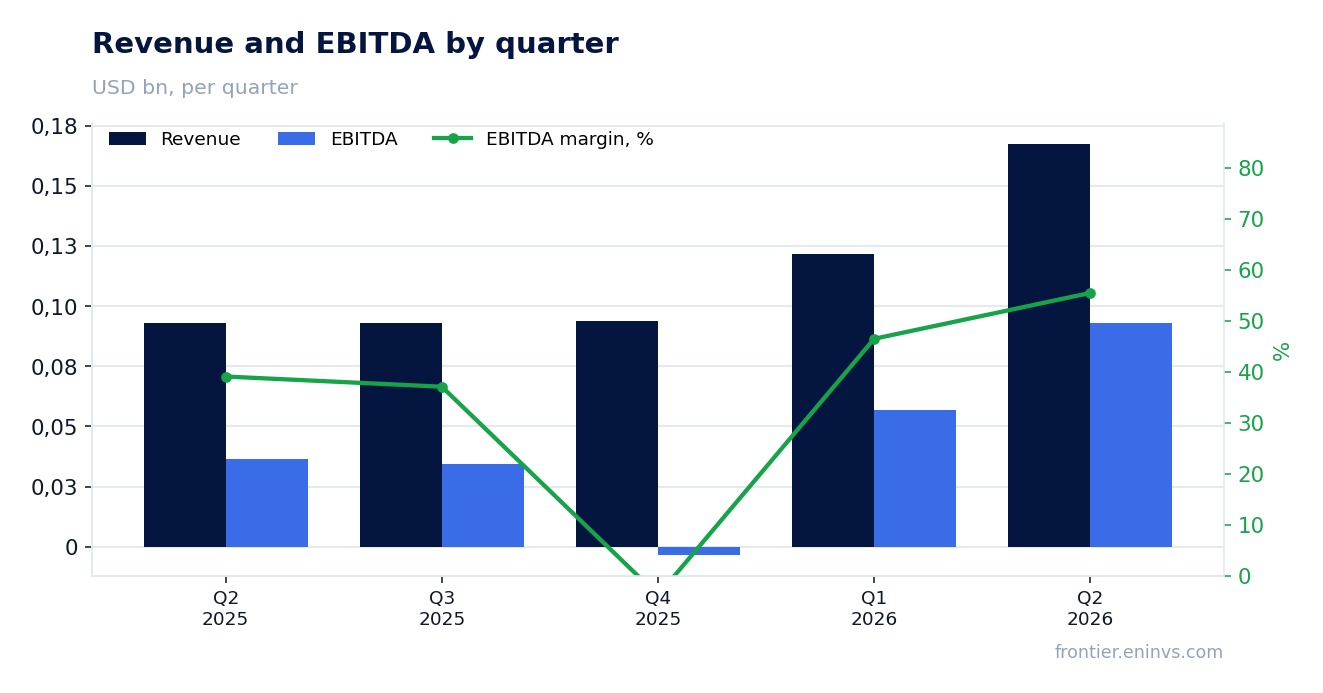
EBITDA climbed 157.8% to USD 93.5 million, lifting the margin to 55.8% from 39.0% a year earlier
Second-quarter 2026 EBITDA reached USD 93.5 million, up 157.8% year on year. EBITDA growth outpaced revenue growth, pointing to strong operating leverage: when commodity prices rise, costs increase more slowly, and a larger share of incremental revenue flows to profit. The EBITDA margin rose to 55.8% from 39.0% in the second quarter of 2025.
This is one of the highest margin levels for Cardinal Energy in recent years. It reflects not only favourable prices but also cost discipline. If hydrocarbon prices stay at current levels, the company can sustain a margin above 50%, ensuring stable cash flow even if prices moderate.
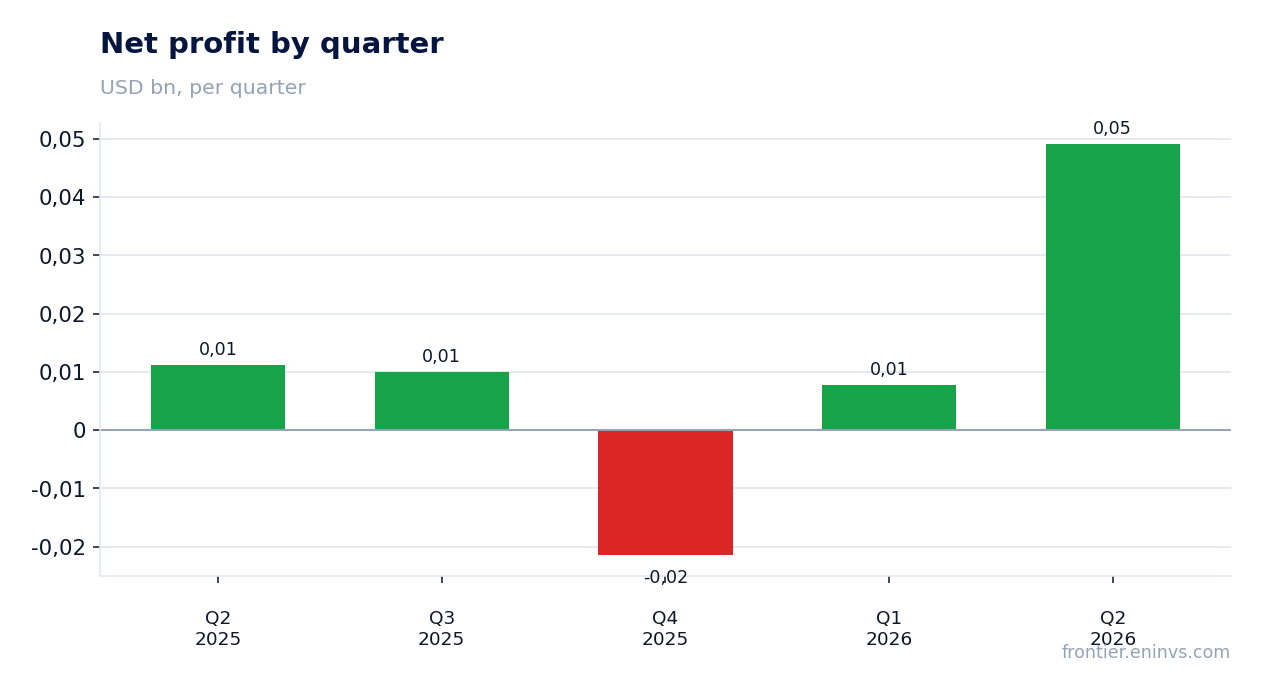
Net profit increased 4.4x to USD 49.2 million, almost entirely from the core business
Second-quarter 2026 net profit was USD 49.2 million, 4.4 times higher than a year earlier. The increase reflects both higher operating profit of USD 68.5 million and lower debt servicing costs as leverage declined. The net margin rose to 29.3% from 12.1% a year earlier.
Unlike many peers, the result contains no large one-off items: profit came from the core business, not asset sales or revaluations. This makes it high-quality and sustainable. If current conditions persist, the company could earn around USD 50 million of net profit per quarter, or about USD 200 million annually.
Operating cash flow for the quarter was USD 82.6 million, covering capital expenditure and dividends
Second-quarter 2026 operating cash flow was USD 82.6 million, well above the year-earlier figure. This level of cash generation allows the company to fund capital expenditure and pay dividends without raising additional debt. Over the trailing twelve months, operating cash flow reached USD 187.3 million.
Capital expenditure for the quarter was not disclosed, but is likely moderate, as the company has not announced major investment projects. Free cash flow after capex and dividends is probably positive, giving management room to reduce debt or increase shareholder returns.
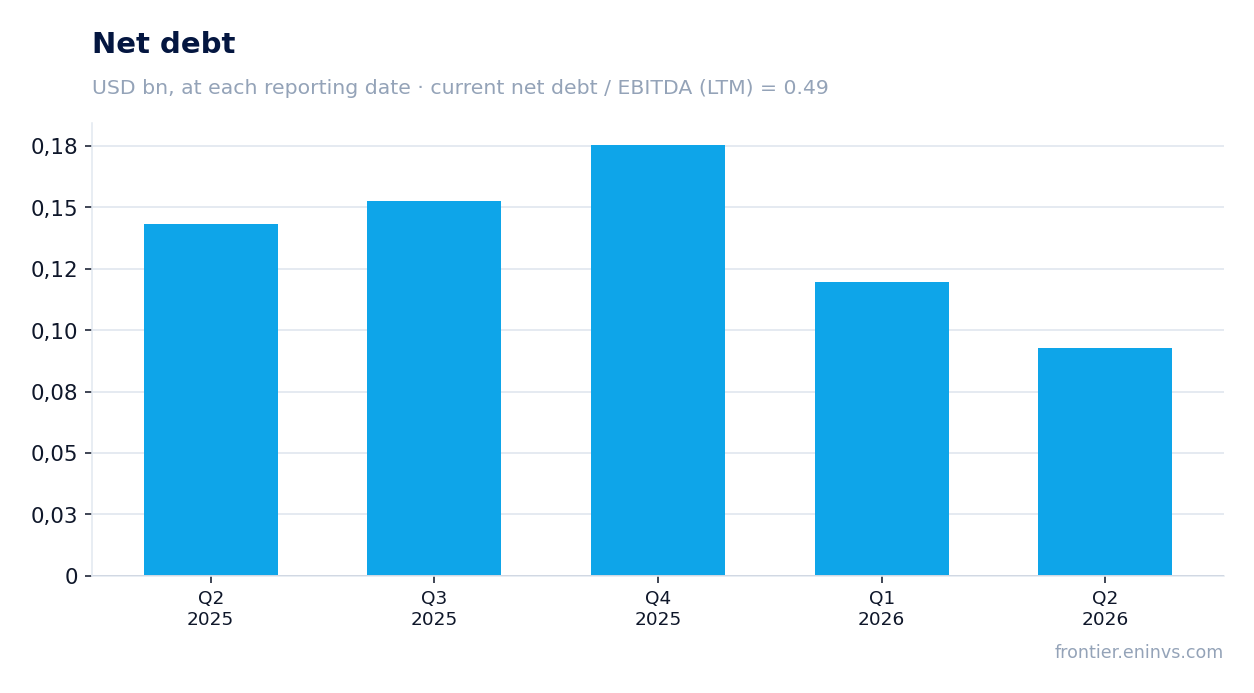
Net debt fell to USD 92.9 million, or 0.49x trailing-twelve-month EBITDA
Net debt at 30 June 2026 was USD 92.9 million, down from USD 119.8 million at 31 March 2026. Over the year, from 30 June 2025, net debt decreased by USD 50.4 million. The ratio of net debt to trailing-twelve-month EBITDA is 0.49, a comfortable level for a company with high margins.
The debt reduction was achieved through strong operating cash flow, which allowed the company to repay part of its obligations. At current hydrocarbon prices, the company can continue to reduce debt, lowering interest expenses and boosting net profit. Low leverage also provides a cushion if prices fall.
The trailing-twelve-month dividend yield of 6.1% exceeds the yield on most debt instruments
The trailing-twelve-month dividend yield is 6.1%. The company pays dividends regularly, and the current yield exceeds rates on most bank deposits and corporate bonds. If current profit and dividend policy persist, payouts may remain at this level or increase.
The dividend base rests on net profit, which was USD 49.2 million in the second quarter. If the company pays out half of annual profit, the yield could exceed 7%. The main risk to dividends is a fall in hydrocarbon prices, which would reduce profit and cash flow.
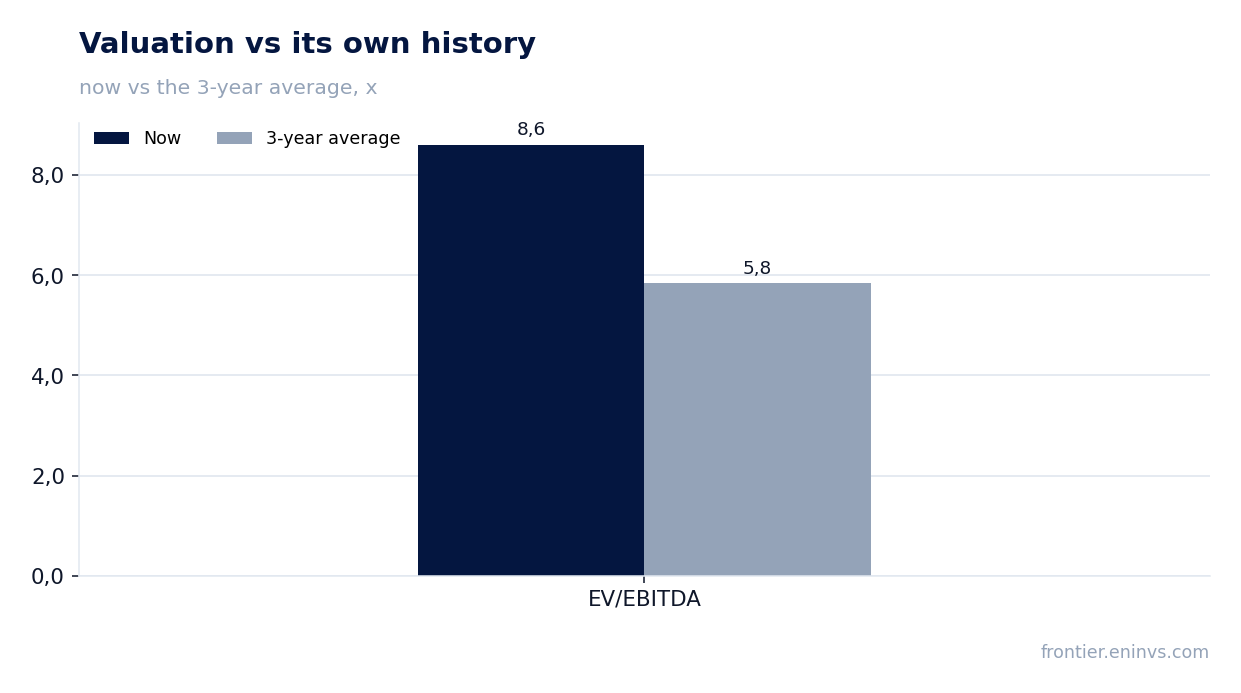
EV/EBITDA of 8.6 compares with a three-year average of 5.8, but the portal model implies 55% upside
The current EV/EBITDA multiple is 8.6, above the three-year average of 5.8. This means the stock trades at a premium to its own history relative to EBITDA. The trailing-twelve-month P/E of 32.1 is also above historical levels, but reflects a low profit base in previous quarters.
According to the portal model, which re-prices EBITDA at current commodity prices and a target multiple, the upside to fair value is 55%. This is a strong argument for the shares despite the current multiple being above the three-year average. If hydrocarbon prices remain high, the market may re-rate the company closer to fair value.
Valuation on the latest reported figures
| Metric | Value |
|---|---|
| Market cap | 1.46 bn USD |
| P/E (LTM) | 32.1 |
| EV/EBITDA (LTM) | 8.6 |
| P/B | 2.40 |
| Net debt / EBITDA (LTM) | 0.49 |
| Operating cash flow (LTM) | 0.19 bn |
| ROE | 29.3% |
| Dividend yield (12m) | 6.1% |
| EV/EBITDA, 3-year average | 5.8 |
Bottom line
Bottom line: Cardinal Energy delivered an exceptionally strong quarter – revenue up 80.3%, EBITDA up 157.8%, net profit up 4.4x. Growth was driven mainly by favourable prices rather than one-offs. The company is reducing debt, generating stable cash flow and paying a 6.1% dividend yield. The current EV/EBITDA of 8.6 is above the three-year average of 5.8, but the portal model implies 55% upside. If prices hold at current levels, the shares look attractive, though the key question for a holder is the sustainability of hydrocarbon prices.
Open the company's financial profile CJ →
See also: market overview · valuation map · stock screeners