CMOC Group: H1 2026 profit doubled, yet the market values the company below its own revenue

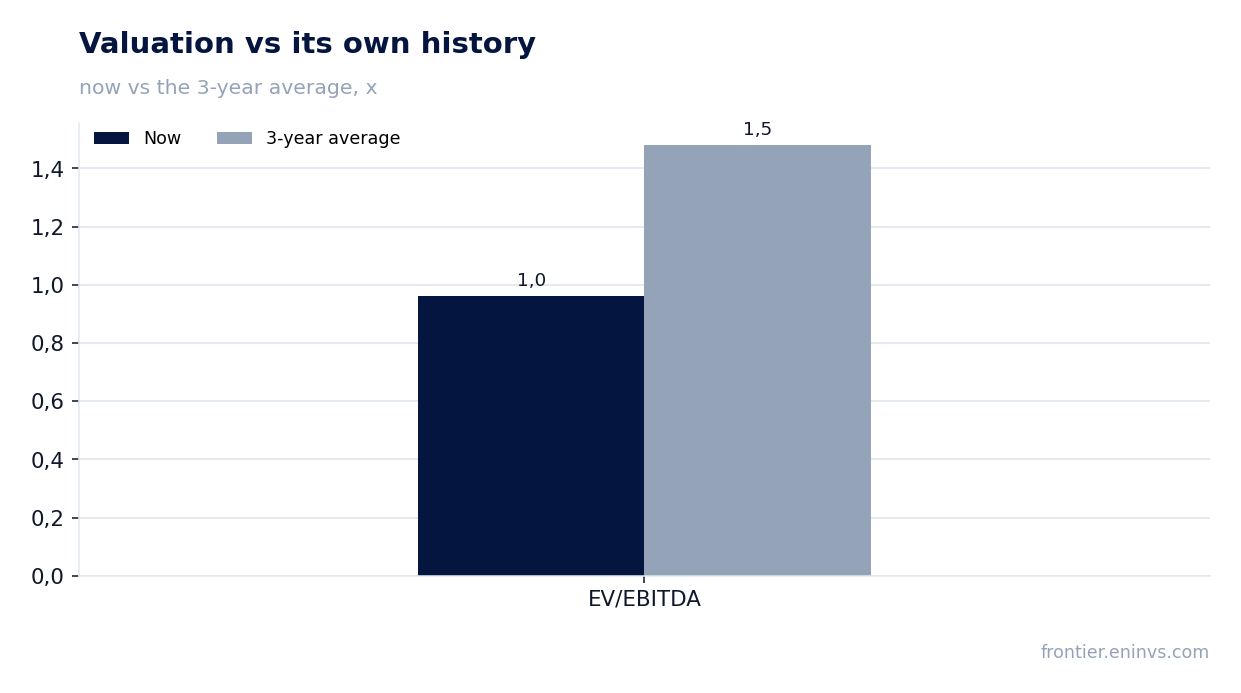
On 25 August CMOC Group released its results for the first half of 2026. Revenue reached USD 19,730.8 million, up 50.6% year on year, net profit rose 96.5% to USD 2,355.1 million, and the net margin improved to 11.9% from 9.1% a year earlier. The company remains in a net cash position: net debt at 30 June 2026 stood at minus USD 893.7 million, with net debt/EBITDA for the trailing twelve months at minus 0.11. Yet the stock trades at a P/E LTM of 1.9 and EV/EBITDA LTM of 0.96 – below its own three-year average EV/EBITDA of 1.48 – while the portal's model puts the upside to fair value at 47%. We find the share attractive at the current level: profit growth is backed by cash flow, leverage is absent, and multiples remain below historical benchmarks.
Key takeaways
— H1 2026 revenue rose 50.6% year on year to USD 19,730.8 million, driven by high copper and cobalt prices and higher sales volumes.
— Net profit increased 96.5% year on year to USD 2,355.1 million, with the net margin rising to 11.9% from 9.1% – margin expansion came from operating leverage and lower unit costs.
— Operating cash flow for H1 2026 was USD 2,381.6 million, covering net profit and confirming the quality of earnings.
— Net debt at 30 June 2026 was minus USD 893.7 million, meaning the company holds a net cash position, with net debt/EBITDA LTM at minus 0.11.
— Trailing twelve-month dividend yield is 2.88%, below the key rate, but the payout may rise for the full year on the back of doubled profit.
— The stock trades at EV/EBITDA LTM of 0.96 against its own three-year average of 1.48, and P/E LTM of 1.9 – the market values the company below its revenue.
— The portal's model puts the upside to fair value at 47% – our own estimate, not a market consensus.
Attractiveness
Key figures, USD bn
| Metric | H1 2025 | H1 2026 | Change |
|---|---|---|---|
| Revenue | 13.1 | 19.7 | +50.6% |
| Operating profit | 2.07 | 3.75 | +81.5% |
| Net profit | 1.20 | 2.36 | +96.5% |
| Operating cash flow | 1.66 | 2.38 | +43.5% |
| Net margin | 9.1% | 11.9% | +2.8 pp |
H1 2026 revenue rose 50.6% year on year to USD 19,730.8 million, driven by high copper and cobalt prices and higher sales volumes.
CMOC Group's revenue for the first half of 2026 reached USD 19,730.8 million, up 50.6% from the same period a year earlier. This growth is primarily explained by favourable pricing for copper and cobalt – the company's key metals – as well as higher production and sales volumes.
For comparison, trailing twelve-month revenue stood at USD 35,400.0 million, confirming the scale of the business and resilient demand for its products. Revenue growth in the first half was significantly higher than in previous periods on average, driven by a low base last year and a recovery in commodity prices.
Net profit increased 96.5% year on year to USD 2,355.1 million, with the net margin rising to 11.9% from 9.1% – margin expansion came from operating leverage and lower unit costs.
Net profit for the first half of 2026 was USD 2,355.1 million, up 96.5% from the same period last year. Operating profit reached USD 3,751.8 million, resulting in a net margin of 11.9% versus 9.1% a year earlier.
The margin improvement is explained by operating leverage: revenue grew faster than costs, and unit production costs declined on the back of higher volumes. This allowed the company to significantly improve profitability even amid commodity price volatility.
Operating cash flow for H1 2026 was USD 2,381.6 million, covering net profit and confirming the quality of earnings.
Operating cash flow for the first half of 2026 was USD 2,381.6 million, exceeding net profit of USD 2,355.1 million. This indicates high earnings quality and the company's ability to generate real cash rather than just accounting profit.
Cash flow is supported by strong operating results and efficient working capital management. The company does not disclose details of capital expenditures for the reporting period, but a stable operating cash flow provides a margin of safety for funding investments and dividends.
Net debt at 30 June 2026 was minus USD 893.7 million, meaning the company holds a net cash position, with net debt/EBITDA LTM at minus 0.11.
As of 30 June 2026, CMOC Group's net debt was minus USD 893.7 million, meaning cash and equivalents exceed debt obligations. A year earlier, at 31 December 2025, net debt was minus USD 0.0 billion, so the company increased its net cash position by USD 0.9 billion over six months.
The net debt/EBITDA ratio for the trailing twelve months is minus 0.11, confirming the absence of debt burden. This gives the company significant financial flexibility and reduces risks in case of deteriorating market conditions.
Trailing twelve-month dividend yield is 2.88%, below the key rate, but the payout may rise for the full year on the back of doubled profit.
CMOC Group's trailing twelve-month dividend yield is 2.88%. The company does not disclose the size of the last dividend or the period for which it was paid, but the current yield is below the key rate, making the stock less appealing to income-oriented investors.
Our estimate: for the full year 2026, the dividend may be increased due to the 96.5% rise in net profit in the first half. However, this depends on the company's dividend policy and its decision on profit distribution. If the payout ratio remains unchanged, the yield could rise in proportion to profit.
The stock trades at EV/EBITDA LTM of 0.96 against its own three-year average of 1.48, and P/E LTM of 1.9 – the market values the company below its revenue.
Currently, CMOC Group's EV/EBITDA LTM stands at 0.96, below its own three-year average of 1.48. This indicates that the market values the company cheaper than its average over the past three years, despite significant growth in financial performance.
P/E LTM is 1.9, which also appears low for a company with growing profit. Market capitalisation is USD 7,589.9 million, less than trailing twelve-month revenue of USD 35,400.0 million. Such a valuation may reflect market concerns about the sustainability of commodity prices or the cyclical nature of the business.
The portal's model puts the upside to fair value at 47% – our own estimate, not a market consensus.
According to our own model, which re-prices EBITDA at current commodity prices and applies a target EV/EBITDA multiple, the fair value of CMOC Group shares implies an upside of 47% to the current market price. This is not a consensus forecast but the result of our model calculation.
The model takes into account current copper and cobalt prices, as well as the current capital structure. If commodity prices remain at current levels or continue to rise, the upside may materialise. However, if metal prices decline, the valuation may be revised downwards.
Valuation on the latest reported figures
| Metric | Value |
|---|---|
| Market cap | 7.59 bn USD |
| P/E (LTM) | 1.9 |
| EV/EBITDA (LTM) | 1.0 |
| P/B | 0.64 |
| Net debt / EBITDA (LTM) | -0.11 |
| ROE | 33.8% |
| Dividend yield (12m) | 2.9% |
| EV/EBITDA, 3-year average | 1.5 |
Bottom line
Bottom line: CMOC Group delivered strong results for the first half of 2026 – revenue rose 50.6%, net profit nearly doubled, and the net margin reached 11.9%. The company maintains a net cash position and generates operating cash flow exceeding net profit. However, the dividend yield of 2.88% is below the key rate, and the market values the company at a P/E of 1.9 and EV/EBITDA of 0.96 – below its own three-year average. Our model suggests a 47% upside. We find the share attractive at the current level, but to confirm the trend it is important to see stability in copper and cobalt prices, as well as the company's decision on dividends for the year.
Open the company's financial profile CMCLF →
See also: market overview · valuation map · stock screeners