Capital Power: revenue up 66.9% but net loss persists on interest burden
Capital Power released Q2 2026 results. Revenue rose 66.9% year-on-year to $532.2 million, EBITDA surged 889.9% to $167.6 million, but net profit remained negative at -$31.6 million. EBITDA margin recovered to 28.2% from 4.8% a year earlier, yet the net loss persisted due to high debt load: net debt of $4.8 billion, or 5.55x LTM EBITDA. At the current price the stock looks unattractive: EV/EBITDA of 13.5 versus its three-year average of 10.9, and the portal's model points to 54% downside.
Key takeaways
— Revenue rose 66.9% year-on-year to $532.2 million, accelerating from 27.6% in Q1
— EBITDA jumped to $167.6 million, with margin recovering to 28.2% from 4.8% a year earlier
— Net loss narrowed to $31.6 million but remained negative due to high debt burden
— Net debt declined to $4.8 billion from $4.9 billion a year earlier, but net debt/LTM EBITDA remains high at 5.55x
— Operating cash flow was $153.9 million, covering interest but not capital expenditures
— Dividend yield of 4.53% looks modest against risks tied to debt and negative net profit
— EV/EBITDA of 13.5 exceeds the three-year average of 10.9, and the portal's model indicates 54% downside
Attractiveness
Key figures, USD bn
| Metric | Q2 2025 | Q2 2026 | Change |
|---|---|---|---|
| Revenue | 0.32 | 0.53 | +66.9% |
| EBITDA | 0.02 | 0.15 | +889.9% |
| Operating profit | -0.11 | 0.03 | to profit |
| Net profit | -0.10 | -0.03 | — |
| Operating cash flow | 0.10 | 0.15 | +48.8% |
| EBITDA margin | 4.8% | 28.2% | +23.4 pp |
| Net margin | -29.9% | -5.9% | +24.0 pp |
Revenue rose 66.9% year-on-year to $532.2 million, accelerating from 27.6% in Q1
In Q2 2026, Capital Power's revenue reached $532.2 million, up 66.9% year-on-year. This marks a notable acceleration from 27.6% growth in Q1 2026. The main driver was energy markets, where power and capacity prices remained high.
The revenue increase is partly due to a low base effect: in Q2 2025, revenue was only $318.9 million. At that time, the company faced unfavorable market conditions, leading to negative EBITDA. Now the situation has reversed, and revenue exceeded Q1 2026 levels, even though Q2 is typically weaker due to seasonality.
Accelerating revenue growth is a positive signal, but the sustainability of this dynamic is questionable. The company operates in competitive power markets where prices can be volatile. Without additional data on revenue structure, it is difficult to assess how repeatable current levels will be.
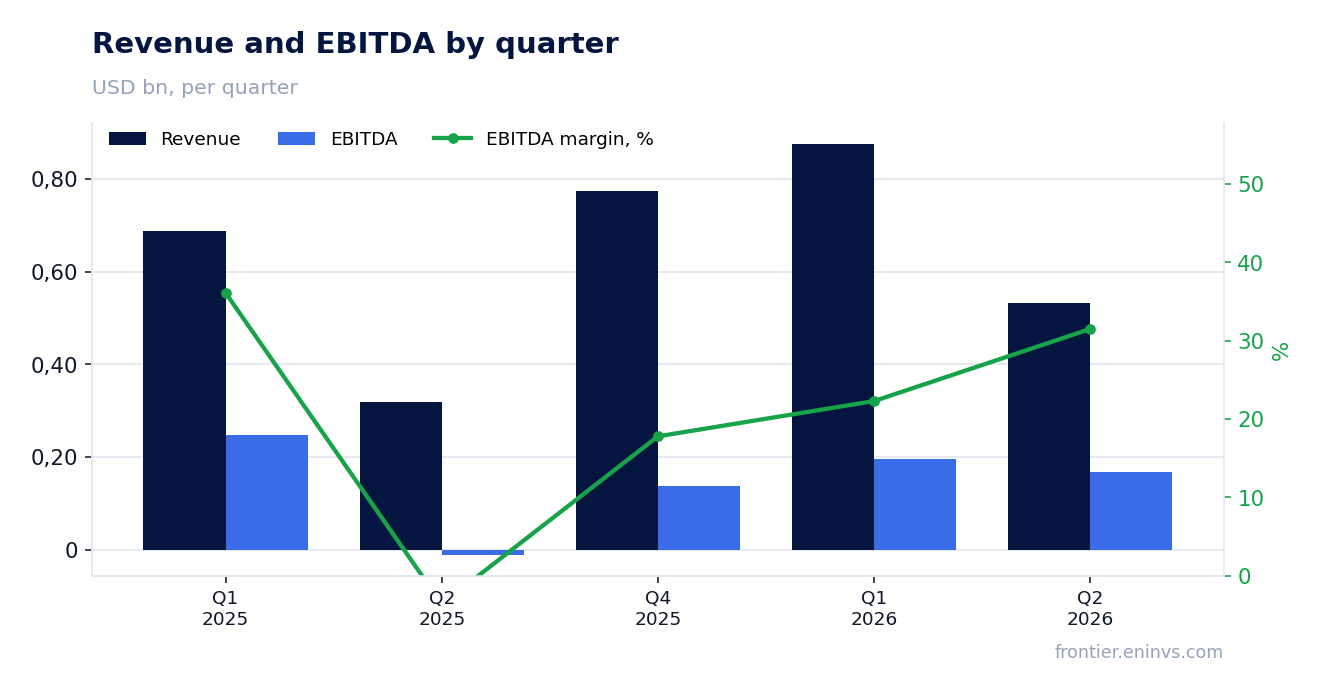
EBITDA jumped to $167.6 million, with margin recovering to 28.2% from 4.8% a year earlier
EBITDA in Q2 2026 was $167.6 million, up 889.9% year-on-year. EBITDA margin reached 28.2%, compared to just 4.8% in Q2 2025. This growth is explained by both higher revenue and lower operating costs relative to revenue.
The recovery in margin to 28.2% is significant progress, but it came from an extremely low base. Last year, the company reported negative EBITDA of -$11.6 million, which distorts percentage comparisons. The current margin level looks healthy, but its sustainability depends on power market prices and cost management efficiency.
Operating profit in Q2 2026 was $34.5 million, also better than last year's loss of $111.4 million. This confirms that EBITDA-level improvement translates into operating profit, although depreciation and interest still consume a significant portion.
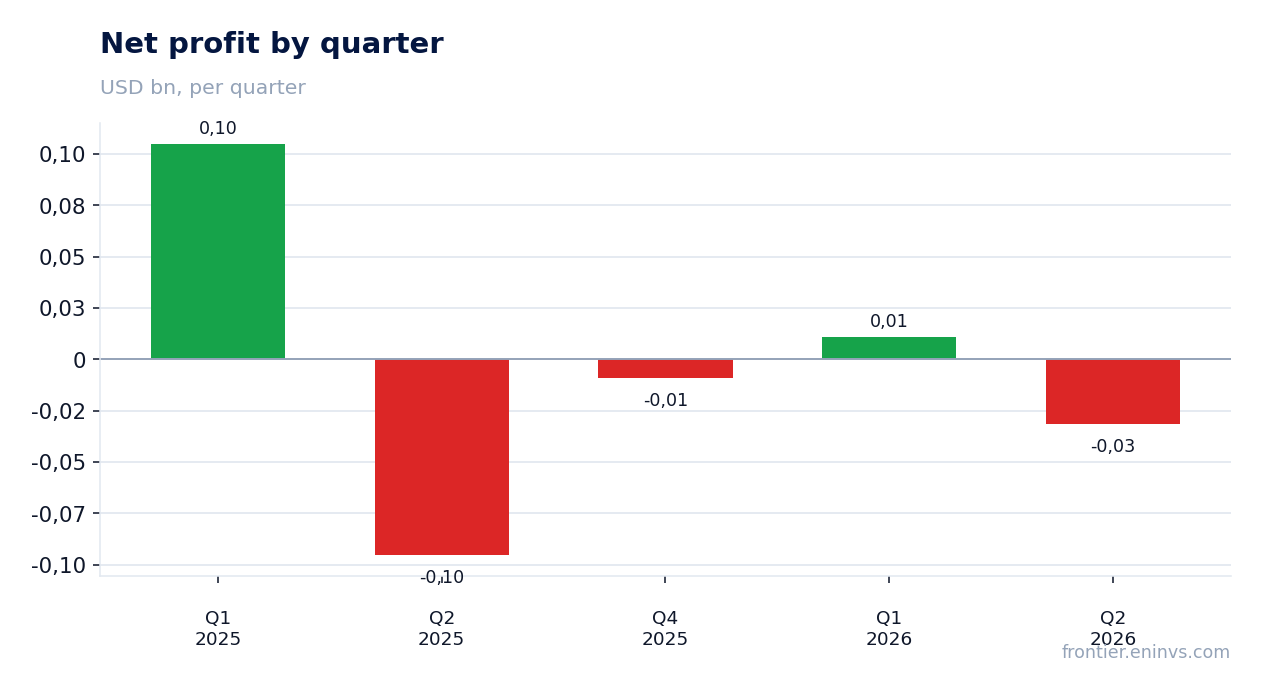
Net loss narrowed to $31.6 million but remained negative due to high debt burden
Net loss in Q2 2026 was $31.6 million versus a loss of $95.5 million a year earlier. The reduction in loss was driven by higher operating profit, but the bottom line remained negative. The main reason is high interest expenses related to debt servicing.
Net margin improved to -5.9% from -29.9% a year earlier but remains negative. The company is not yet generating net profit, which limits internal funding and dividend growth potential. To turn positive, further operational improvement or debt reduction is needed.
Return on equity (ROE) over the last 12 months is negative at -3.73%. This reflects accumulated losses and pressure on capital. Until the company returns to net profit, ROE will remain weak.
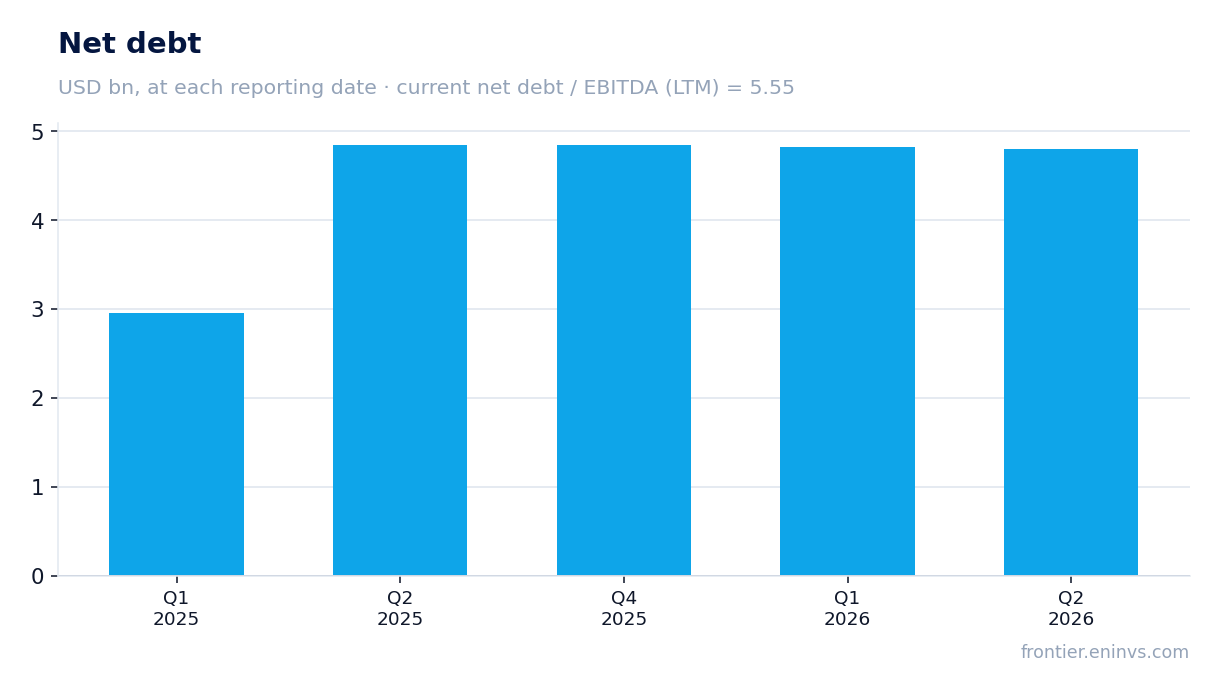
Net debt declined to $4.8 billion from $4.9 billion a year earlier, but net debt/LTM EBITDA remains high at 5.55x
Net debt as of June 30, 2026, was $4.8 billion, down from $4.9 billion as of June 30, 2025. During the quarter, debt remained virtually unchanged: as of March 31, 2026, it was also $4.8 billion. Despite the slight annual decline, debt burden remains significant.
The net debt / LTM EBITDA ratio is 5.55x. This is a high level that limits financial flexibility and increases risks if market conditions deteriorate. For comparison, a comfortable level for most energy companies is 2-3x.
High debt means a significant portion of operating profit goes to interest servicing. This explains why the company remains unprofitable at the net level despite EBITDA recovery. Reducing debt or refinancing on better terms could improve the situation.
Operating cash flow was $153.9 million, covering interest but not capital expenditures
Operating cash flow in Q2 2026 was $153.9 million, up from $103.4 million a year earlier. The increase reflects improved operations and more efficient working capital management. This is a positive signal, as the company generates enough funds to cover current obligations.
However, no data on capital expenditures is available, making it difficult to assess free cash flow. If capex is significant, free cash flow could be negative. For an energy company, maintaining and upgrading assets requires substantial investment, which can absorb a large portion of operating cash flow.
Operating cash flow over the last 12 months was $738.3 million. This is a solid level, but it must cover not only interest but also dividends and capital expenditures. Without capex data, it is hard to judge whether cash flow is sufficient for all needs.
Dividend yield of 4.53% looks modest against risks tied to debt and negative net profit
The trailing 12-month dividend yield is 4.53%. This is a moderate level that may appeal to income-oriented investors. However, the company remains unprofitable at the net level, which casts doubt on the sustainability of dividend payments.
High debt burden (5.55x net debt/EBITDA) means a significant portion of cash flow goes to debt servicing. This limits dividend growth potential. If operating results deteriorate or interest rates rise, the company may be forced to cut payments.
To assess dividend attractiveness, it is important to compare the yield with alternative investments, such as the key rate. If the rate is above 4.53%, the dividend yield may not compensate for risks. In current conditions, it looks modest, especially given negative net profit and high debt.
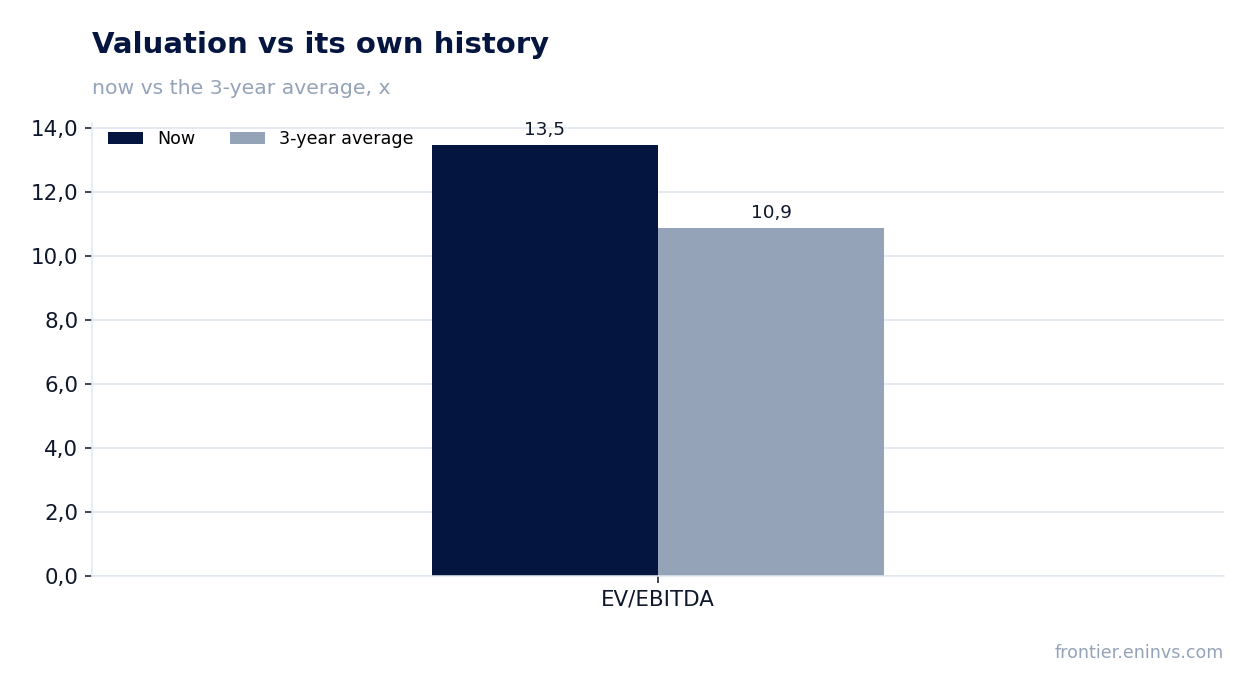
EV/EBITDA of 13.5 exceeds the three-year average of 10.9, and the portal's model indicates 54% downside
The current EV/EBITDA multiple is 13.5, above the three-year average of 10.9. This means the stock trades at a premium to its own history. Investors may be overestimating the earnings recovery without accounting for debt-related risks and market volatility.
The portal's model, based on re-pricing EBITDA at current commodity prices against a target EV/EBITDA, indicates a 54% downside to the current market capitalization. This is the portal's own calculation, not a consensus forecast. It reflects a cautious view on the sustainability of current financial performance.
The trailing 12-month P/E is 38.1, which also looks high, especially given the net loss in Q2. The combination of high multiples and weak fundamentals creates a risk of further correction. To justify the current valuation, the company needs to demonstrate sustainable profit growth and debt reduction.
Valuation on the latest reported figures
| Metric | Value |
|---|---|
| Market cap | 6.79 bn USD |
| P/E (LTM) | 38.1 |
| EV/EBITDA (LTM) | 13.5 |
| P/B | 1.91 |
| Net debt / EBITDA (LTM) | 5.55 |
| Operating cash flow (LTM) | 0.74 bn |
| ROE | -3.7% |
| Dividend yield (12m) | 4.5% |
| EV/EBITDA, 3-year average | 10.9 |
Bottom line
Capital Power showed strong revenue and EBITDA recovery in Q2 2026, but net profit remained negative due to high debt burden. Operating cash flow is growing, yet without capex data it is hard to assess free cash flow. EV/EBITDA of 13.5 exceeds the three-year average of 10.9, and the portal's model indicates 54% downside. Dividend yield of 4.53% looks modest against risks. At the current price, the stock looks unattractive.
Open the company's financial profile CPX →
See also: market overview · valuation map · stock screeners