Cenovus Energy: profit tripled, but one revenue jump made half the quarter

Cenovus Energy reported second-quarter 2026 results. Revenue rose 50.1% year on year to USD 13,903.4 million, EBITDA by 143.3% to USD 4,199.9 million, and net profit by 243.3% to USD 2,090.5 million. The EBITDA margin climbed to 29.5% from 18.2% a year earlier, while net debt fell from USD 5.9 billion to USD 3.9 billion over the quarter. At an EV/EBITDA of 5.6 and a dividend yield of 1.5%, the share looks rather attractive, but the sustainability of this profit level still needs confirmation.
Key takeaways
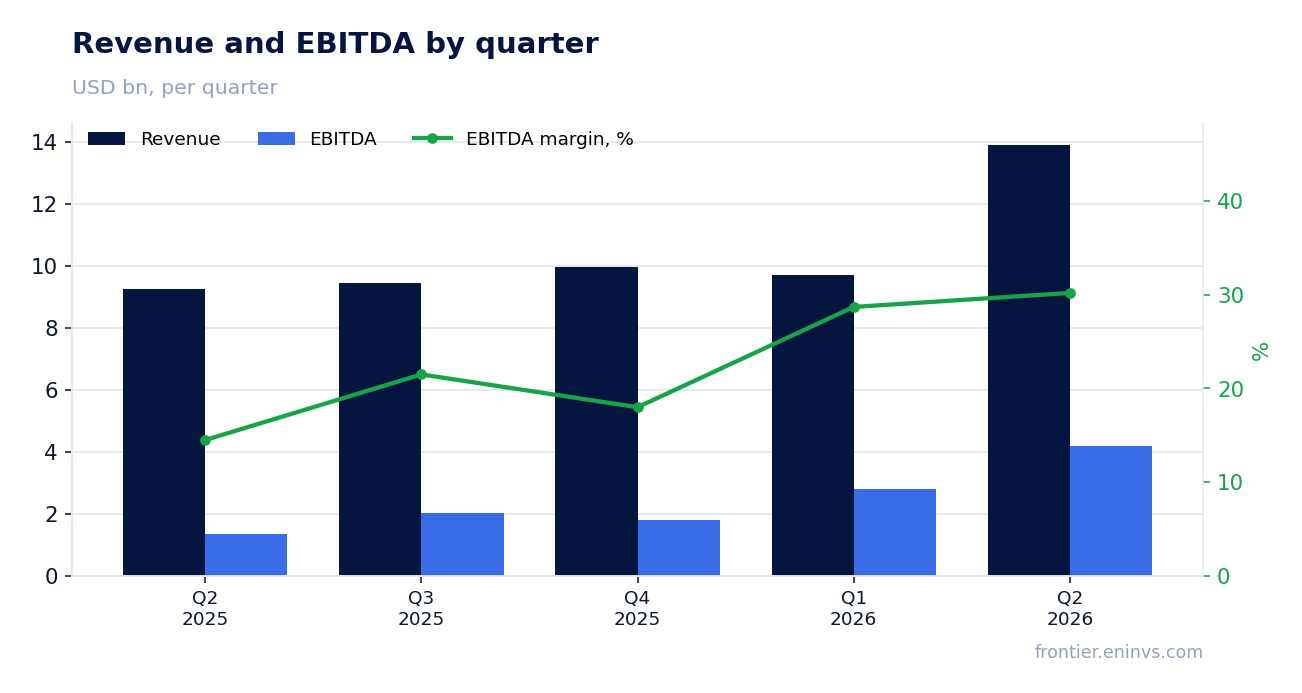
— Revenue added 50.1% year on year, the best quarterly result in the last five reporting periods
— EBITDA rose 143.3% and the margin climbed to 29.5% from 18.2% – profit growth far outpaces revenue growth
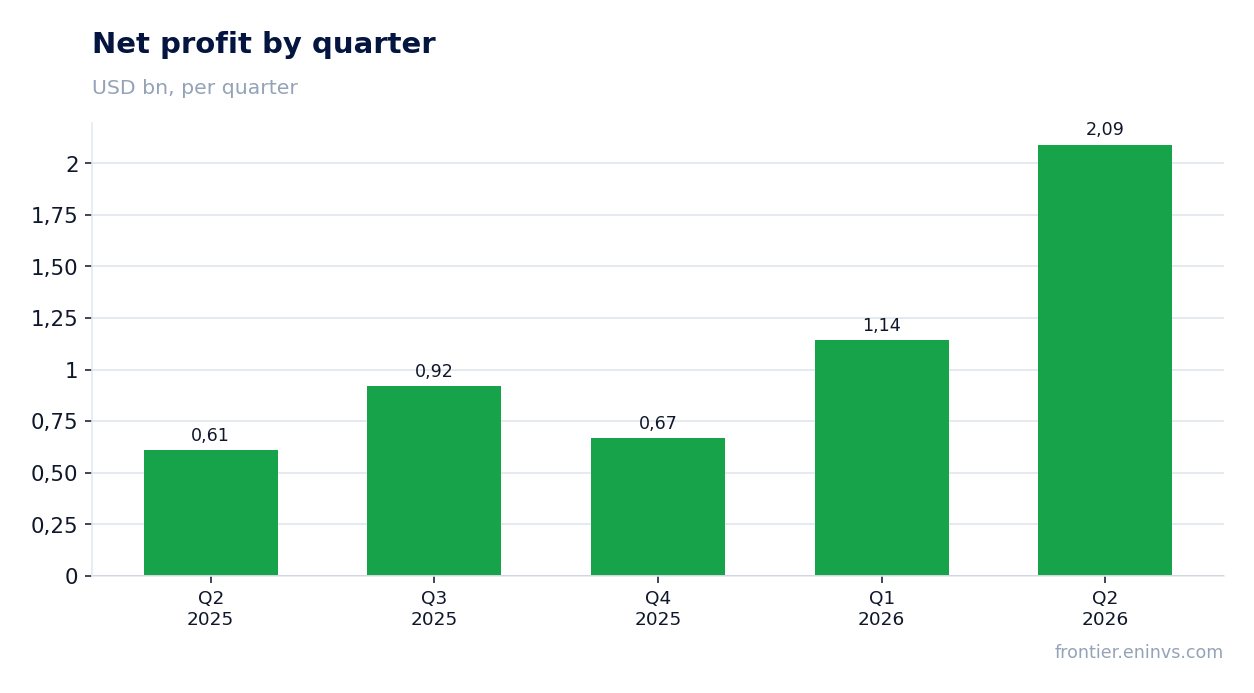
— Net profit of USD 2,090.5 million tripled, with a margin of 15.0% versus 6.6% a year earlier
— Operating cash flow of USD 4,105.2 million covers quarterly profit almost twice over
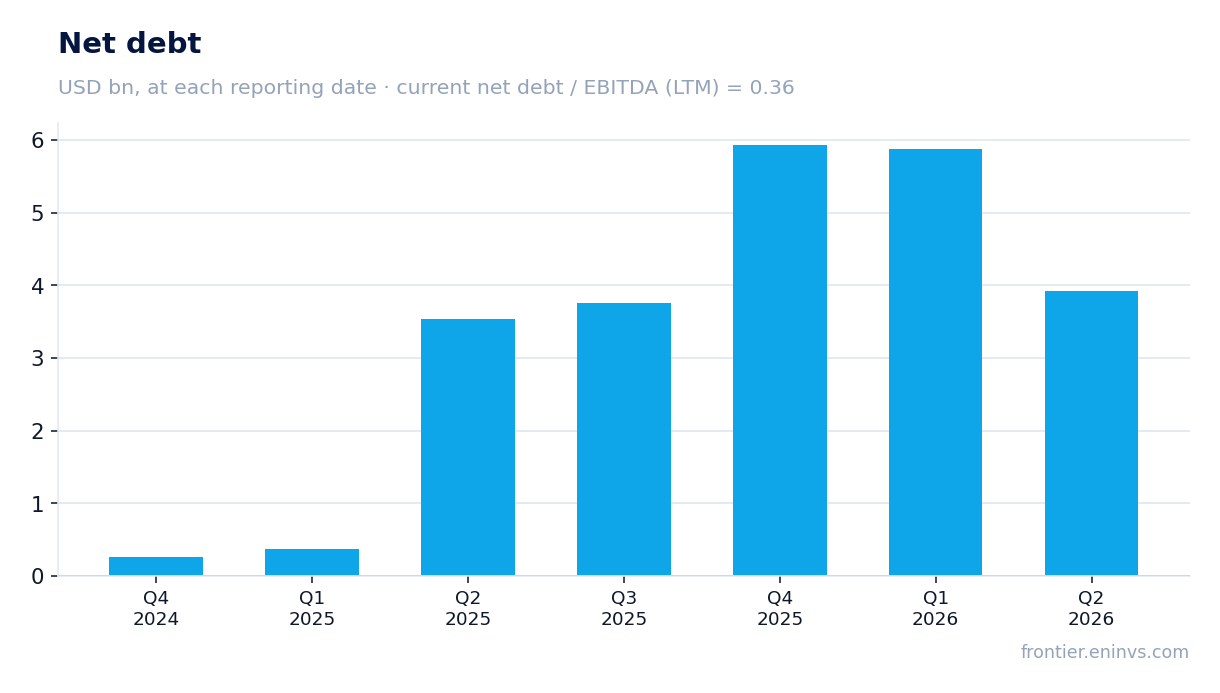
— Net debt fell from USD 5.9 billion to USD 3.9 billion over the quarter, but rose from USD 3.5 billion to USD 3.9 billion over the year
— A dividend yield of 1.5% at a P/E of 11.7 and EV/EBITDA of 5.6 leaves room for higher payouts
— Return on equity of 34.4% is rare for a commodity company at a cycle peak
Attractiveness
Key figures, USD bn
| Metric | Q2 2025 | Q2 2026 | Change |
|---|---|---|---|
| Revenue | 9.26 | 13.9 | +50.1% |
| EBITDA | 1.68 | 4.10 | +143.3% |
| Operating profit | 0.49 | 3.12 | +531.5% |
| Net profit | 0.61 | 2.09 | +243.3% |
| Operating cash flow | 1.70 | 4.11 | +141.6% |
| EBITDA margin | 18.2% | 29.5% | +11.3 pp |
| Net margin | 6.6% | 15.0% | +8.4 pp |
Revenue added 50.1% year on year, the best quarterly result in the last five reporting periods
In the second quarter of 2026, Cenovus Energy's revenue reached USD 13,903.4 million, up 50.1% from a year earlier. This is the highest quarterly figure in the last five reporting periods: in the first quarter of 2026 revenue was USD 9,715.9 million, in the fourth quarter of 2025 – USD 9,974.7 million, in the third – USD 9,442.9 million, and in the second quarter of 2025 – USD 9,260.4 million.
Revenue growth accelerated relative to previous quarters: in the first quarter of 2026 it added only about 5% to the fourth quarter of 2025, whereas in the second quarter the jump was over 40% from the first. Such a surge cannot be explained by seasonality alone – it points to a sharp improvement in selling prices or higher volumes.
For a commodity company, such revenue growth usually signals favourable pricing. However, without data on production volumes and average realised prices in the report, the contribution of price and volume cannot be precisely separated. What can be stated: revenue grew faster than in previous periods, and this became the foundation for the multiple increase in profit.
EBITDA rose 143.3% and the margin climbed to 29.5% from 18.2% – profit growth far outpaces revenue growth
EBITDA in the second quarter of 2026 was USD 4,199.9 million, up 143.3% from the second quarter of 2025. EBITDA growth was more than double revenue growth, which expanded the margin from 18.2% a year earlier to 29.5% in the reporting quarter.
Outpacing EBITDA growth means costs rose slower than revenue. In a commodity business, this is usually due to the fixed component of expenses: when product prices rise, variable costs do not increase proportionally. However, without a breakdown of cost items in the report, the exact cause of the margin expansion is not disclosed.
An EBITDA margin of 29.5% is a high level for an oil and gas company. For comparison: in the first quarter of 2026 it was 28.7%, in the fourth quarter of 2025 – 18.0%, in the third – 21.5%, and in the second quarter of 2025 – 14.5%. The current value is the best in the last five quarters, confirming operating leverage.
Net profit of USD 2,090.5 million tripled, with a margin of 15.0% versus 6.6% a year earlier
Net profit in the second quarter of 2026 was USD 2,090.5 million, up 243.3% year on year. The net margin rose to 15.0% from 6.6% in the second quarter of 2025. This is the highest quarterly profit figure in the last five reporting periods.
Net profit growth outpaced EBITDA growth, which may indicate a lower effective tax rate, reduced interest expenses, or the absence of large one-off write-offs that occurred a year earlier. The report does not detail these factors, so the exact cause of the faster net profit growth remains undisclosed.
For an investor, not only the absolute profit level matters but also its sustainability. A profit of USD 2,090.5 million is the result of a quarter in which revenue was abnormally high. If commodity prices return to the levels of previous quarters, profit could decline proportionally.
Operating cash flow of USD 4,105.2 million covers quarterly profit almost twice over
Operating cash flow in the second quarter of 2026 was USD 4,105.2 million, almost double the net profit for the same period. This means the company not only earns but also converts profit into real cash, which is important for funding capital expenditure and dividends.
For comparison: in the first quarter of 2026 operating cash flow was USD 1,588.6 million, in the fourth quarter of 2025 – USD 1,723.3 million, in the third – USD 1,525.0 million, and in the second quarter of 2025 – USD 1,698.9 million. The current quarter was the best on this metric in the last five periods.
Such cash flow allows the company to reduce debt and return capital to shareholders. However, the sustainability of the flow depends on commodity prices: if they fall, cash flow will decline faster than accounting profit due to the working capital effect.
Net debt fell from USD 5.9 billion to USD 3.9 billion over the quarter, but rose from USD 3.5 billion to USD 3.9 billion over the year
Net debt as of 30 June 2026 was USD 3,924.5 million. Over the quarter it fell from USD 5,869.3 million on 31 March 2026 to USD 3,924.5 million on 30 June 2026, a decrease of USD 1,944.8 million. This reduction was made possible by record operating cash flow in the quarter.
However, over the last 12 months net debt increased: from USD 3,531.0 million on 30 June 2025 to USD 3,924.5 million on 30 June 2026, a rise of USD 393.5 million. This means that despite the quarterly improvement, the annual trend remains negative.
The net debt to EBITDA ratio for the last 12 months is 0.36. This is a low level, giving the company room for further debt reduction or increased shareholder returns. However, comparing the current value with previous periods is impossible, as the facts do not contain historical data for this ratio.
A dividend yield of 1.5% at a P/E of 11.7 and EV/EBITDA of 5.6 leaves room for higher payouts
The dividend yield over the last 12 months is 1.5%. At a market capitalisation of USD 56,251.8 million, this corresponds to annual payments of about USD 835 million. The company pays dividends, but their share of profit is small: with net profit of USD 4,822.8 million over the last 12 months, the payout ratio is about 17%.
Our estimate for the current year's dividend assumes the payout ratio remains at 17% and profit stays at the last 12 months' level. Under these assumptions, the annual dividend could be about USD 0.9 per share, giving a yield of about 1.5% at the current price. However, this estimate is sensitive to profit: if the quarterly profit of USD 2,090.5 million proves one-off, annual profit could decline and the dividend would be smaller.
A yield of 1.5% is below the key rate, making the share less attractive for income investors. However, the low payout ratio means the company has significant potential to increase dividends if high commodity prices persist. At a 30% payout ratio, the yield could be about 2.6%.
Return on equity of 34.4% is rare for a commodity company at a cycle peak
Return on equity (ROE) over the last 12 months is 34.4%. This is a high figure, reflecting both strong profit and a possible reduction in equity due to share buybacks or write-offs. For a commodity company, such a ROE level is typically achieved only at the cycle peak.
The P/E multiple over the last 12 months is 11.7, below the company's historical average. EV/EBITDA for the same period is 5.6. Both multiples indicate that the market values the company moderately, despite record profit. This may be due to expectations of lower commodity prices in the future.
Comparing current multiples with three-year averages is impossible, as the facts do not contain historical data. However, a P/E of 11.7 and EV/EBITDA of 5.6 look attractive for a company with a 34.4% ROE and low debt. If profit is sustainable, the share may be undervalued.
Valuation on the latest reported figures
| Metric | Value |
|---|---|
| Market cap | 56.3 bn USD |
| P/E (LTM) | 11.7 |
| EV/EBITDA (LTM) | 5.6 |
| P/B | 2.49 |
| Net debt / EBITDA (LTM) | 0.36 |
| Operating cash flow (LTM) | 8.94 bn |
| ROE | 34.4% |
| Dividend yield (12m) | 1.5% |
Bottom line
The quarter was exceptionally strong for Cenovus Energy: revenue rose 50.1%, EBITDA by 143.3%, net profit by 243.3%, and the EBITDA margin reached 29.5%. Operating cash flow of USD 4,105.2 million allowed net debt to fall from USD 5.9 billion to USD 3.9 billion over the quarter. However, the annual debt trend remains negative, and the sustainability of record profit depends on commodity prices. At a P/E of 11.7, EV/EBITDA of 5.6, and a dividend yield of 1.5%, the share looks rather attractive, but only for those willing to accept the commodity cycle.
Open the company's financial profile CVE →
See also: market overview · valuation map · stock screeners