Chevron: Q2 profit up nearly fivefold, but the portal's model sees a third downside
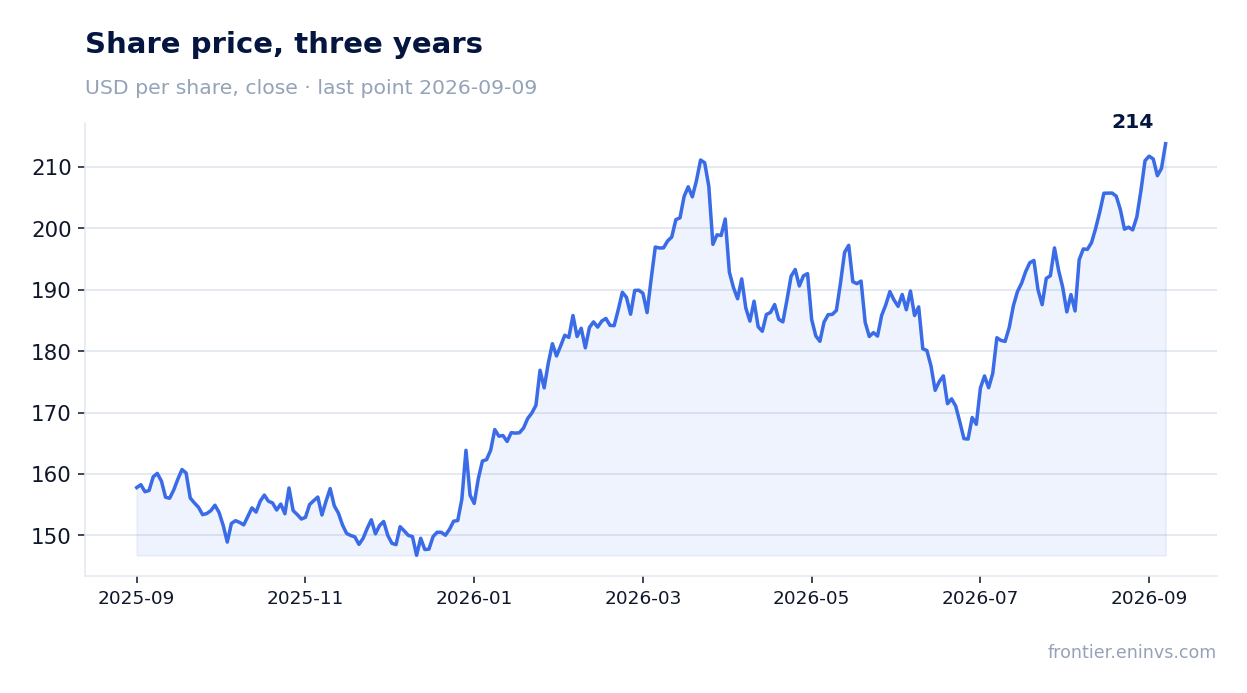
On July 31, Chevron reported Q2 2026 results: revenue rose 49.9% YoY to $67.2 billion, net profit jumped 384.8% to $12.1 billion. Growth was driven by higher oil prices, record US production, and the Hess acquisition. The stock gained 2.4% on the day and 11.2% from the release to September 9, but the portal's model implies a fair value 33% below the current market cap, making the share rather unattractive.
Key takeaways
— Q2 revenue rose 49.9% on record production and oil prices
— EBITDA margin doubled to 30.3% on higher oil prices and strong downstream
— Net profit nearly quintupled, but part is one-off
— Operating cash flow hit $22.6 billion, debt cut by $8.4 billion
— Dividend raised to $1.78 per share, but yield below its own history
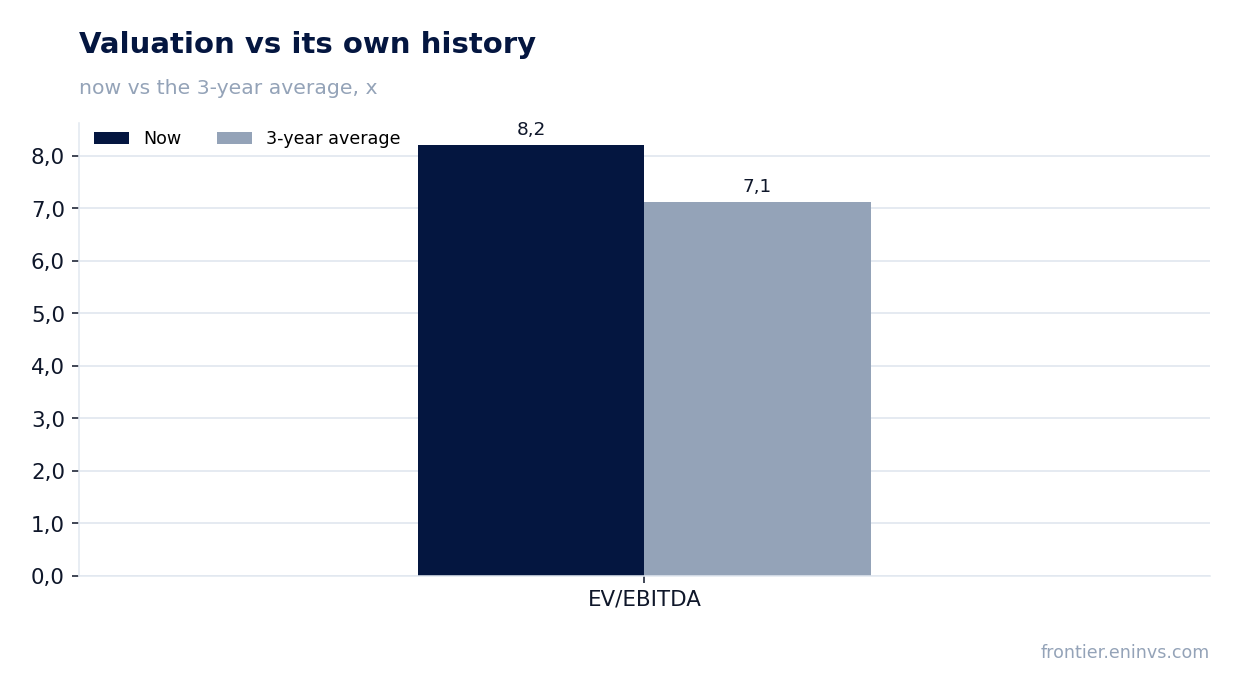
— EV/EBITDA multiple above its own three-year average
— Portal's model sees the share 33% below current price
Attractiveness
Key figures, USD bn
| Metric | Q2 2025 | Q2 2026 | Change |
|---|---|---|---|
| Revenue | 44.8 | 67.2 | +49.9% |
| EBITDA | 8.49 | 20.4 | +139.8% |
| Operating profit | 4.15 | 14.3 | +244.2% |
| Net profit | 2.49 | 12.1 | +384.8% |
| Operating cash flow | 8.58 | 22.6 | +163.9% |
| Capex | 3.71 | 4.54 | +22.3% |
| EBITDA margin | 18.9% | 30.3% | +11.4 pp |
| Net margin | 5.6% | 18.0% | +12.4 pp |
Q2 revenue rose 49.9% on record production and oil prices
In Q2 2026, Chevron's revenue reached $67.2 billion, up 49.9% YoY. The company attributes the growth primarily to a 20% increase in production to 4,070 thousand barrels of oil equivalent per day, a record for the US, driven by the Hess assets and growth in the Permian Basin and the Gulf of America.
Average Brent price rose to $104 per barrel in Q2 from $68 a year earlier, directly boosting revenue and cash flow. International production grew by 292 thousand barrels per day but was partly curtailed in the Partitioned Zone due to the Middle East conflict.
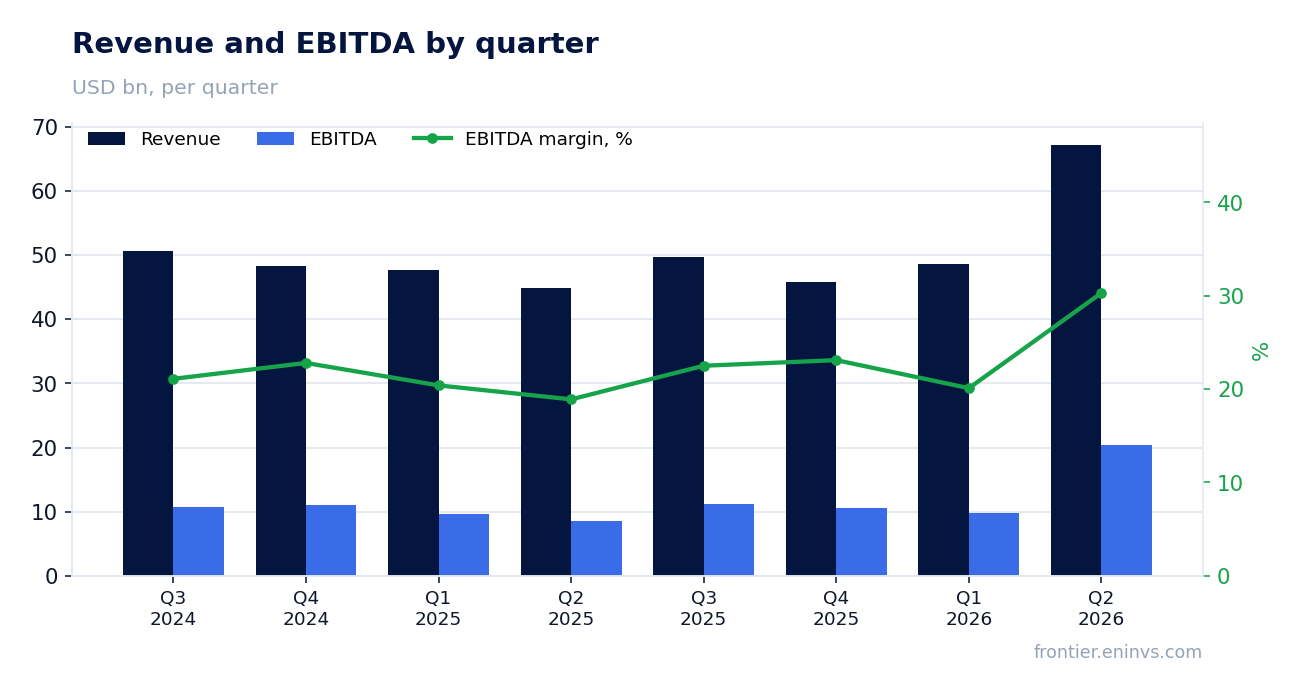
EBITDA margin doubled to 30.3% on higher oil prices and strong downstream
EBITDA in Q2 rose 139.8% YoY to $20.4 billion, with EBITDA margin expanding from 18.9% to 30.3%, driven by higher oil prices and record US refinery utilization at 97%.
International downstream earnings increased to $2.5 billion from $0.3 billion a year earlier, helped by favorable timing effects and the sale of Hong Kong businesses. US downstream earned $2.4 billion – six times more than last year – on strong margins and Chevron Phillips Chemical's contribution.
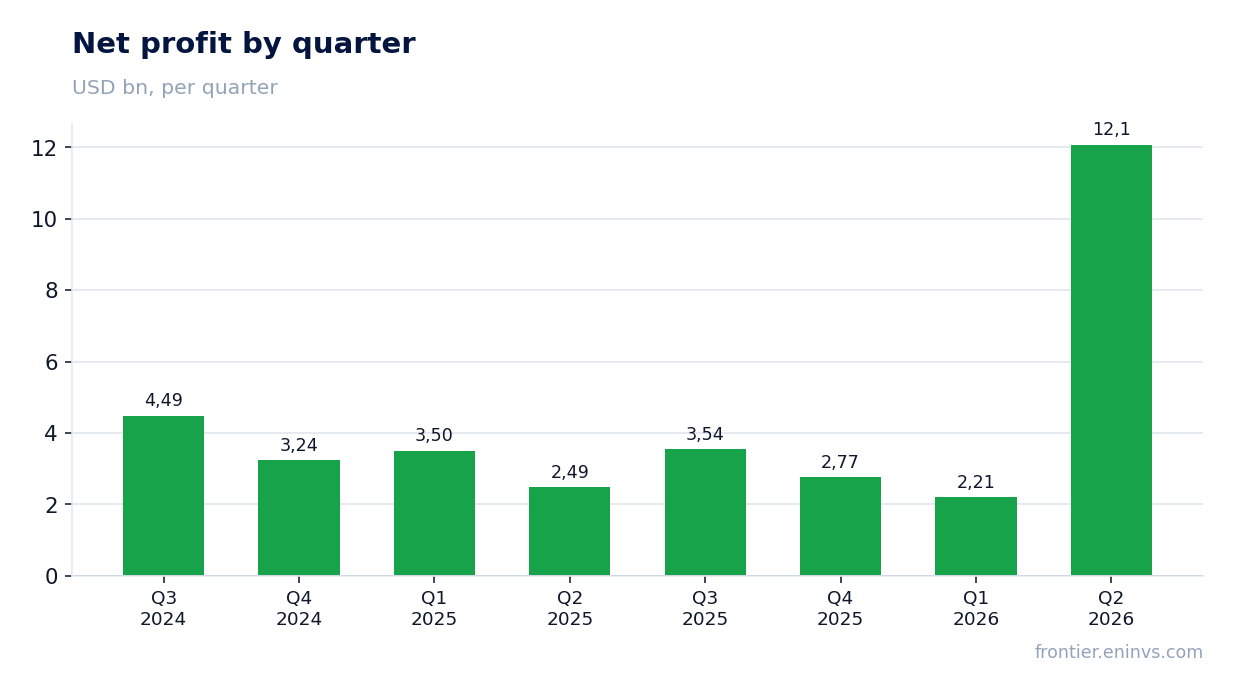
Net profit nearly quintupled, but part is one-off
Net profit in Q2 reached $12.1 billion, up 384.8% YoY. The quarter included one-off items: an asset sale gain of $230 million and pension settlement costs of $86 million. Adjusted earnings were $12.0 billion, so one-offs had little impact.
The main drivers were higher production and oil prices, plus strong refining margins. Net margin expanded from 5.6% to 18.0% – the best in recent years, but reflecting commodity prices rather than operational efficiency alone.
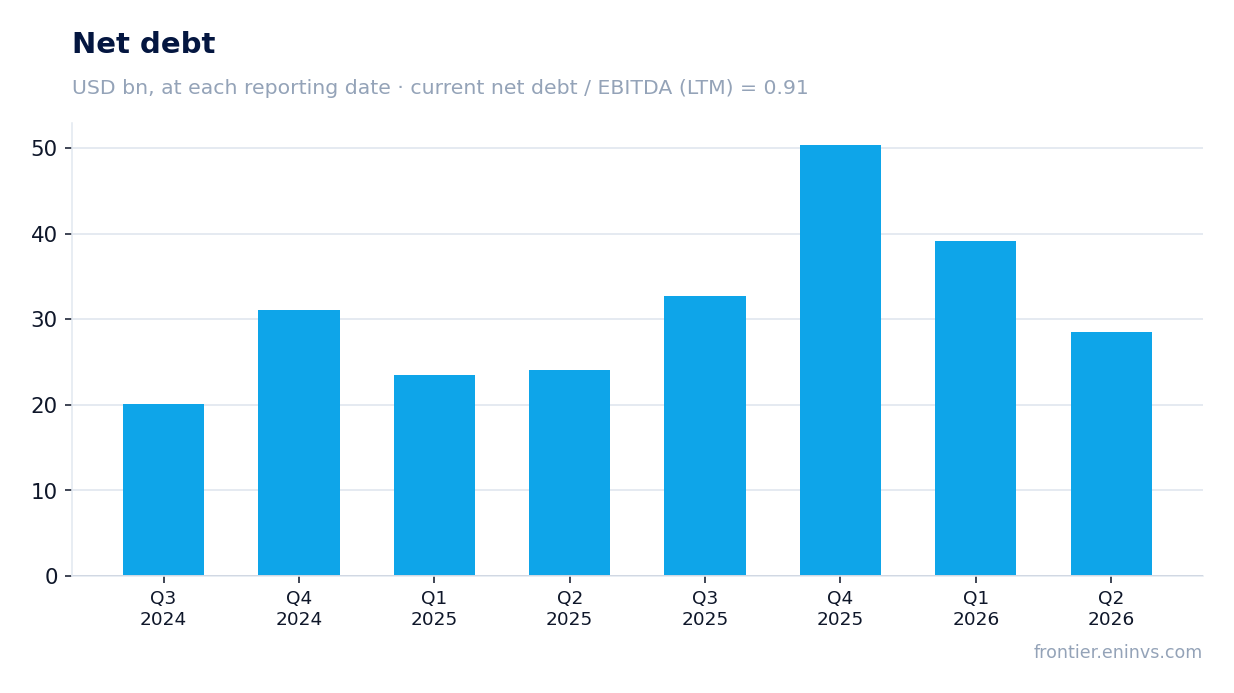
Operating cash flow hit $22.6 billion, debt cut by $8.4 billion
Operating cash flow in Q2 was $22.6 billion, nearly triple the year-ago figure, driven by record production, higher prices, increased Tengizchevroil distributions, and favorable working capital. Free cash flow reached $18.1 billion versus $4.9 billion a year earlier.
Chevron reduced total debt by a record $8.4 billion in the quarter. Net debt stood at $28.5 billion at end-June, down $10.6 billion from the prior reporting date. Net debt/EBITDA for the trailing twelve months is 0.91, which looks comfortable, though its historical trend is not disclosed.
Dividend raised to $1.78 per share, but yield below its own history
The Board declared a quarterly dividend of $1.78 per share, payable September 10, 2026. Annualized, that is about $7.12 per share, yielding 3.3% at the current price – below its own historical average when the stock traded lower.
The payout looks sustainable: quarterly free cash flow of $18.1 billion comfortably covers dividend payments of $7.0 billion in H1. The company also repurchased $3.1 billion of shares in the quarter. The main risk is a drop in oil prices, but the current debt level provides room to maneuver.
EV/EBITDA multiple above its own three-year average
Current EV/EBITDA is 8.21 versus the three-year average of 7.12. This means the market values Chevron above its own historical average, even though profit growth is largely driven by the oil price cycle.
Trailing P/E is 19.27, also not cheap for an oil major. ROE is 25.9%, high but reflecting the current upcycle. If oil prices correct, both earnings and multiples could quickly revert to average levels.
Portal's model sees the share 33% below current price
According to the portal's model, which re-prices EBITDA at current commodity prices and applies a target EV/EBITDA, the fair value of the share is 33% below the current market cap. This suggests the market has already priced in sustained high oil prices and strong results.
Since the release, the stock has risen 11.2% to September 9, adding to the overvaluation. New investors should note that much of the positive news is already reflected in the price.
Valuation on the latest reported figures
| Metric | Value |
|---|---|
| Market cap | 397 bn USD |
| P/E (LTM) | 19.3 |
| EV/EBITDA (LTM) | 8.2 |
| P/B | 2.13 |
| Net debt / EBITDA (LTM) | 0.91 |
| Operating cash flow (LTM) | 33.9 bn |
| ROE | 25.9% |
| Dividend yield (12m) | 3.3% |
| EV/EBITDA, 3-year average | 7.1 |
Bottom line
Chevron's Q2 2026 report is strong: record production, high oil prices, and refining margins drove a nearly fivefold profit increase and robust cash flow, allowing debt reduction and a dividend hike. However, much of the growth is cyclical, tied to Brent at $104, and unlikely to be sustainable. The stock has already risen 11.2% since the report, and the portal's model sees it 33% above fair value. At the current price, the share is not attractive for new entries; better to wait for an oil price correction or a pullback in the stock.
Open the company's financial profile CVX →
See also: market overview · valuation map · stock screeners