Eni: revenue up 15.3%, but profit barely moved and net debt rose by $3.3bn in the quarter
On 29 April Eni reported results for the first quarter of 2026. Revenue came in at $22,971.3m, up 15.3% year on year, while net profit was $1,246.2m, just 0.7% higher than a year earlier. The net margin slipped to 5.4% from 6.2% a year ago, and net debt at 31 March 2026 reached $26.0bn, up from $22.7bn at the end of 2025. At the current price the stock trades at 28.2 times LTM earnings and 10.1 times LTM EBITDA, which offers no clear edge – the verdict is neutral.
Key takeaways
— Revenue rose 15.3% year on year to $22,971.3m, but net profit added only 0.7%
— The net margin fell to 5.4% from 6.2% a year earlier, even though the EBITDA margin held at 20.7%
— Net debt increased to $26.0bn at 31 March 2026 from $22.7bn at the end of 2025
— The net debt / LTM EBITDA ratio stands at 2.43 – a moderate level for a company of this scale
— Operating cash flow for the quarter was $1,660.4m, well below $2,518.9m a year earlier
— The trailing 12-month dividend yield is 3.45%, close to current money-market rates
— Valuation at 28.2 times LTM earnings and 10.1 times LTM EBITDA offers no clear discount to historical levels
Attractiveness
Key figures, USD bn
| Metric | Q1 2025 | Q1 2026 | Change |
|---|---|---|---|
| Revenue | 19.9 | 23.0 | +15.3% |
| EBITDA | — | 4.76 | — |
| Operating profit | — | 0.73 | — |
| Net profit | 1.24 | 1.25 | +0.7% |
| Operating cash flow | 2.52 | 1.66 | -34.1% |
| EBITDA margin | — | 20.7% | — |
| Net margin | 6.2% | 5.4% | -0.8 pp |
Revenue rose 15.3% year on year to $22,971.3m, but net profit added only 0.7%
Revenue for the first quarter of 2026 was $22,971.3m, up 15.3% from $19,916.4m a year earlier. This is a solid increase. However, net profit rose only to $1,246.2m from $1,237.8m, a gain of just 0.7%.
The gap between revenue and profit growth reflects faster growth in costs. With revenue up 15.3%, operating profit was $731.9m and EBITDA was $2,615.7m. This means most of the revenue increase was absorbed by expenses, preventing profit from growing proportionally.
The net margin fell to 5.4% from 6.2% a year earlier. The EBITDA margin held at 20.7%, indicating that pressure on profit arose below the operating line – likely from financial expenses or taxes.
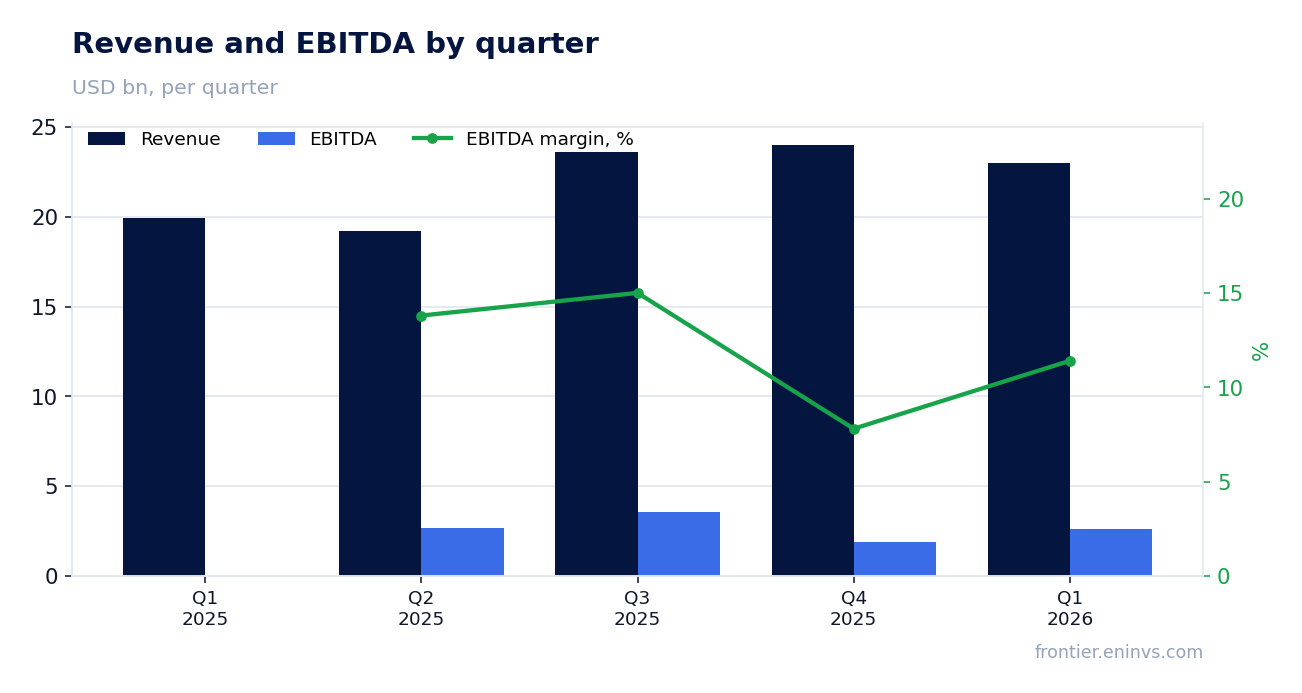
The net margin fell to 5.4% from 6.2% a year earlier, even though the EBITDA margin held at 20.7%
The EBITDA margin in Q1 2026 was 20.7%, in line with the level the company has shown before. This indicates stability in operating efficiency at the EBITDA level. However, the net margin fell to 5.4% from 6.2% a year earlier.
This divergence means that pressure on net profit arose below the operating line. Operating profit was $731.9m on revenue of $22,971.3m, implying a fairly low operating margin. This could be due to higher depreciation, interest, or taxes.
For investors, the key point is that the EBITDA margin remains stable, but net profit is not growing. If pressure on profit persists, it could limit the company's ability to increase dividends or reduce debt.
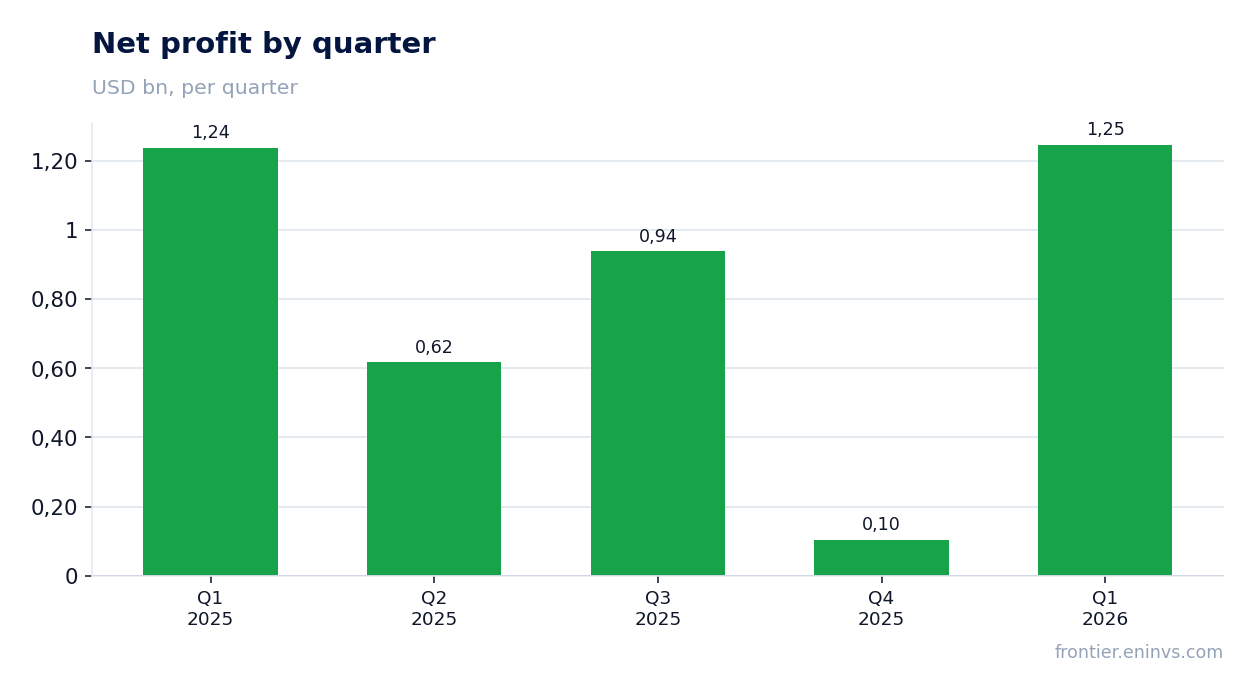
Net debt increased to $26.0bn at 31 March 2026 from $22.7bn at the end of 2025
Net debt at 31 March 2026 was $26.0bn, up from $22.7bn at 31 December 2025. The increase over the quarter was $3.3bn. A year earlier, at 31 March 2025, net debt was $11.9bn, meaning it rose by $14.1bn over 12 months.
Such debt growth against relatively flat profit raises questions. Operating cash flow for the quarter was $1,660.4m, well below $2,518.9m a year earlier. This means the company generated less cash than needed to cover investments or dividends, forcing it to increase debt.
The net debt / LTM EBITDA ratio stands at 2.43. This is a moderate level, but it warrants monitoring, especially if operating cash flow remains weak.
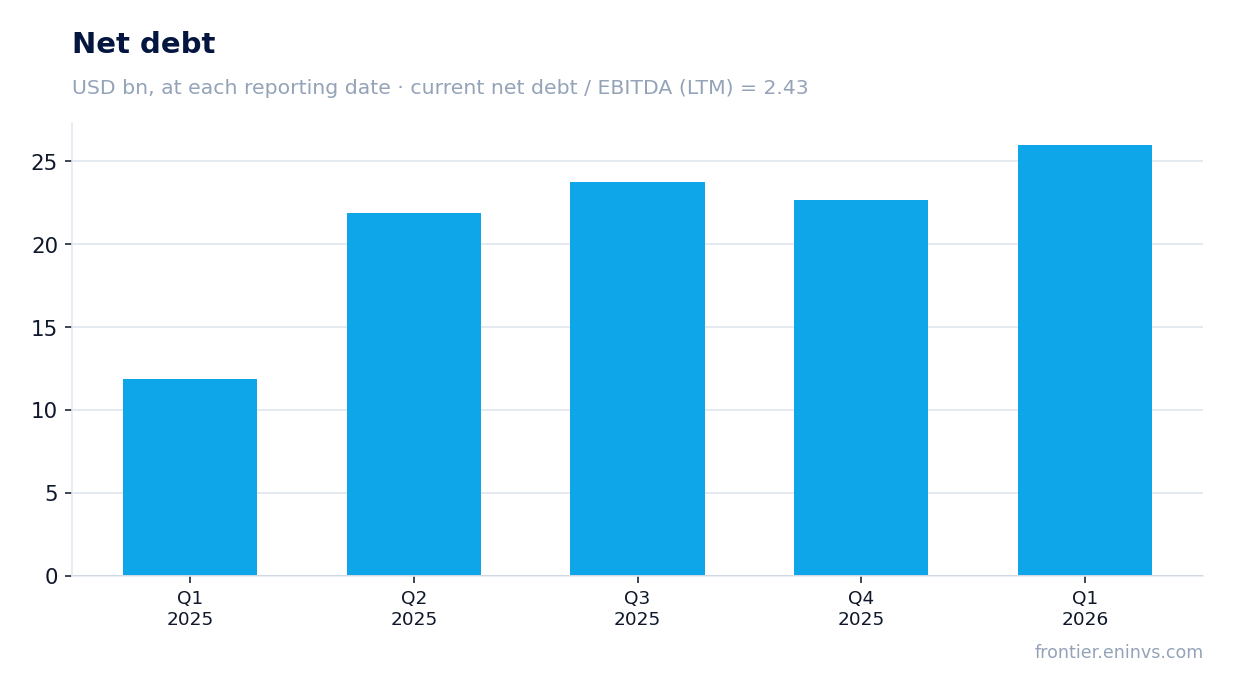
The net debt / LTM EBITDA ratio stands at 2.43 – a moderate level for a company of this scale
The ratio of net debt to LTM EBITDA is 2.43. This is a moderate figure that does not signal critical leverage. For comparison, many large oil and gas companies consider a level up to 2.5–3.0 comfortable.
However, it is important to note that LTM EBITDA is $10,691.6m, while net debt is $26.0bn. At the current level of cash generation, debt servicing does not appear problematic, but further debt growth without EBITDA growth could worsen the ratio.
Investors should monitor the dynamics of this ratio in the coming quarters. If it exceeds 3.0, it could limit the company's financial flexibility.
Operating cash flow for the quarter was $1,660.4m, well below $2,518.9m a year earlier
Operating cash flow in Q1 2026 was $1,660.4m, down 34% from $2,518.9m in Q1 2025. This is a significant decline that explains the rise in debt: the company generated less cash than needed to fund operations and payments.
Over the trailing 12 months, operating cash flow was $14,329.3m. This is a substantial sum, but the quarterly dynamics show deterioration. If this trend persists, the company will have to either cut investments or increase borrowing.
The decline in cash flow could be due to working capital growth or lower operating efficiency. Without additional data from the report, the exact cause is unclear, but the fact remains: less cash was generated.
The trailing 12-month dividend yield is 3.45%, close to current money-market rates
The trailing 12-month dividend yield is 3.45%. This is a moderate level that does not stand out against current money-market rates. For income-oriented investors, such a yield may be insufficient, especially given the risks associated with oil price volatility.
The company did not disclose the dividend amount for Q1 2026 in the provided data. However, based on the yield, it can be assumed that payments remain stable but are not growing. With LTM net profit of $2,907.9m and a market capitalisation of $82,123.3m, the dividend burden appears moderate.
If operating cash flow remains weak, it could limit the company's ability to maintain or increase dividends. In that case, the yield could decline, negatively affecting the stock's appeal.
Valuation at 28.2 times LTM earnings and 10.1 times LTM EBITDA offers no clear discount to historical levels
Eni trades at 28.2 times LTM earnings and 10.1 times LTM EBITDA. These levels do not look low for an oil and gas company. For comparison, historically Eni's EV/EBITDA has often been in the 5–8 range, although the current data does not include a historical average.
Market capitalisation is $82,123.3m, and net debt is $26.0bn. An EV/EBITDA of 10.1 means investors are paying a fairly high price for current EBITDA. At the same time, ROE is 8.83%, which is below the cost of capital for many investors.
According to the portal's model, which re-prices EBITDA at current commodity prices at the target EV/EBITDA, the upside to fair value is estimated at +7%. This is a moderate potential that does not create a strong incentive to buy.
Valuation on the latest reported figures
| Metric | Value |
|---|---|
| Market cap | 82.1 bn USD |
| P/E (LTM) | 28.2 |
| EV/EBITDA (LTM) | 10.1 |
| P/B | 1.52 |
| Net debt / EBITDA (LTM) | 2.43 |
| Operating cash flow (LTM) | 14.3 bn |
| ROE | 8.8% |
| Dividend yield (12m) | 3.4% |
Bottom line
Eni reported Q1 2026 results: revenue rose 15.3%, but net profit was almost unchanged, and net debt increased to $26.0bn. The stable EBITDA margin at 20.7% remains a strength, but weak operating cash flow and rising debt raise questions. Valuation at 28.2 times earnings and 10.1 times EBITDA offers no clear discount, and the portal model's upside is only +7%. At the current price, the stock appears fairly valued, with no clear advantages for a buyer.
Open the company's financial profile E →
See also: market overview · valuation map · stock screeners