Evolution Petroleum: net income rose 35.7%, but the gain came from hedge revaluation, not the business
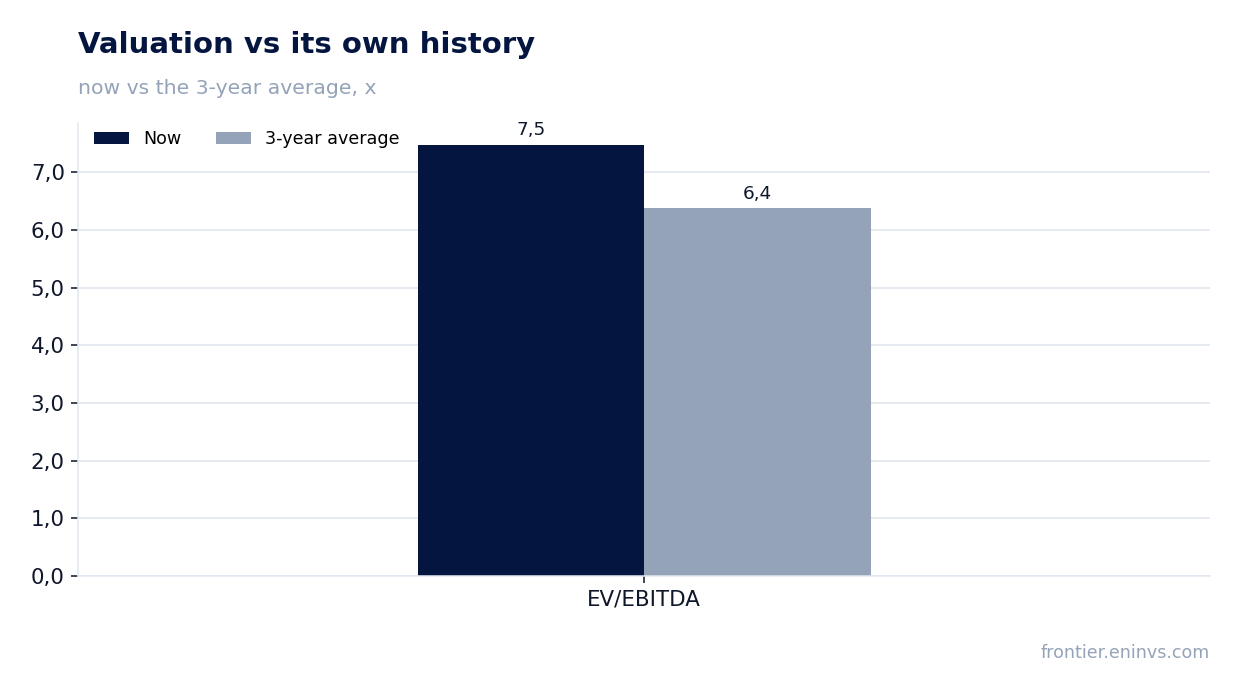
On 15 September Evolution Petroleum reported results for the fourth quarter of fiscal 2026. Revenue rose 17.1% year on year to $24.2 million and net income 35.7% to $4.6 million, but adjusted EBITDA fell 8.9% to $6.5 million, and excluding a one-off hedge revaluation the company posted a $0.6 million loss. At $3.71 the stock trades at 7.5x EV/EBITDA against its own three-year average of 6.4, while the 13% dividend yield remains the main argument for holding; on that balance the assessment is neutral.
Key takeaways
— Revenue rose 17.1% year on year, but prices drove it, not volumes: production fell 4%
— Adjusted EBITDA fell 8.9%, and the gap with net income is explained by a one-off hedge revaluation
— Excluding that one-off, the company posted a $0.6 million loss – the real picture of the quarter
— Debt at 1.66x LTM EBITDA is moderate, but liquidity is only $13.9 million, with another $3.2 million borrowed on 20 August
— The $0.12 quarterly dividend yields 13%, but $4.3 million of payouts exceeded adjusted profit
— At 7.5x EV/EBITDA the stock is above its own three-year average of 6.4 – the market already prices in success from the Permian deal
— The $16 million Permian acquisition added 3,420 net royalty acres and over 1,000 drilling locations
Attractiveness
Key figures, USD bn
| Metric | Q4 2025 | Q4 2026 | Change |
|---|---|---|---|
| Revenue | 0.02 | 0.02 | +14.7% |
| EBITDA | 0.01 | 0.01 | -8.9% |
| Operating profit | 0.00 | 0.00 | +71.9% |
| Net profit | 0.00 | 0.00 | +35.7% |
| Operating cash flow | 0.01 | 0.01 | -35.0% |
| Capex | 0.01 | — | — |
| EBITDA margin | 33.9% | 26.9% | -7.0 pp |
| Net margin | 16.1% | 19.1% | +3.0 pp |
Revenue rose 17.1% year on year, but prices drove it, not volumes: production fell 4%
Revenue for the fourth quarter of fiscal 2026 was $24.2 million, up 17.1% from a year earlier. The growth came entirely from prices: the average realised price rose 20% to $38.55 per barrel of oil equivalent, while production fell 4% to 6,901 barrels of oil equivalent per day.
The production decline is a base effect: last year's quarter included flush production from new wells that then followed their expected declines. The release states directly that the year-on-year change largely reflects these wells following their expected declines over fiscal 2026.
Sequentially the picture is better: revenue rose 20% from the third quarter and production added 3%. That points to a recovery from the issues earlier in the year, but the year-on-year volume trend remains negative.
Adjusted EBITDA fell 8.9%, and the gap with net income is explained by a one-off hedge revaluation
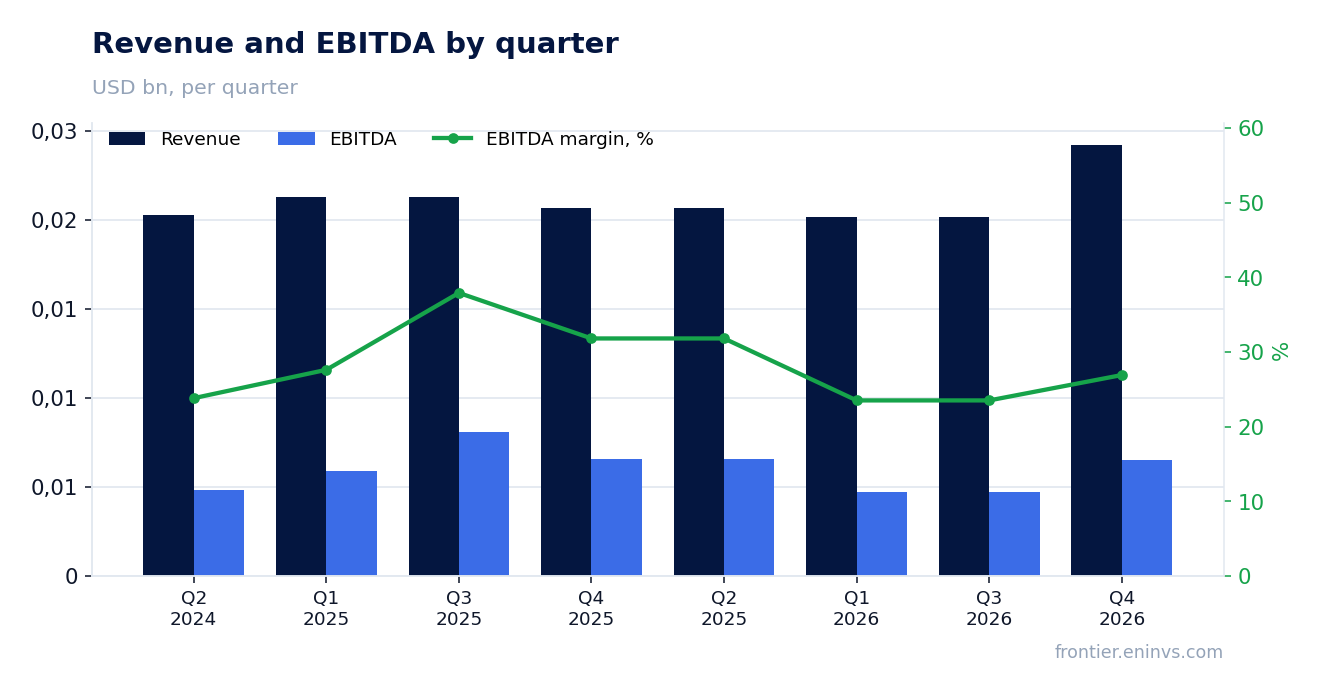
Adjusted EBITDA fell 8.9% year on year to $6.5 million, and its margin dropped to 26.9% from 33.9% a year earlier. The reason is realised losses on derivative contracts in the current period versus realised gains a year earlier, as stated in the release.
The gap between EBITDA and net income came from a non-operating item: hedge revaluation contributed $2.6 million of gains this quarter versus $3.7 million a year earlier. That is what allowed net income to rise 35.7% to $4.6 million despite falling operating profitability.
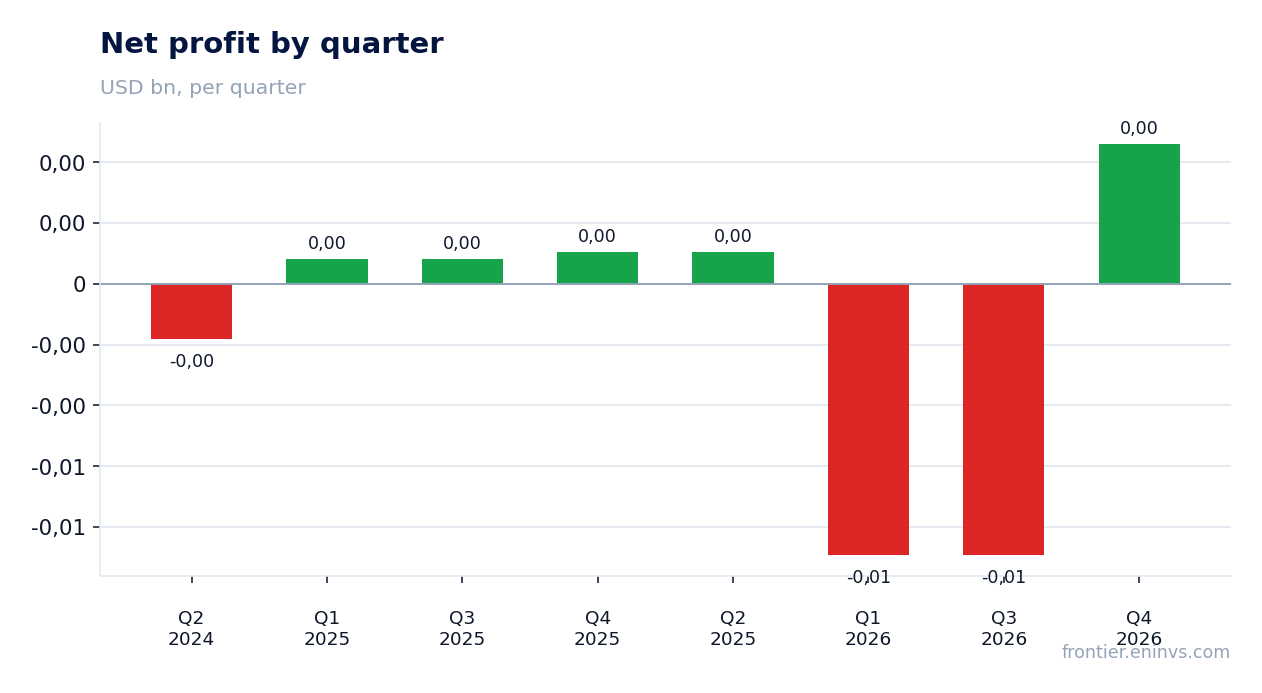
Excluding that item the picture changes: adjusted net loss was $0.6 million versus a profit of $1.1 million a year earlier. The business earned less this quarter than a year ago, and the net income growth is a consequence of accounting revaluation, not operational improvement.
Excluding that one-off, the company posted a $0.6 million loss – the real picture of the quarter
The adjusted loss of $0.6 million versus a profit of $1.1 million a year earlier is the key fact of the report. It shows that the operating economics deteriorated: revenue grew on prices, but costs and realised hedges ate that effect.
Cost pressure is visible in lease operating costs: they rose to $12.8 million from $11.4 million a year earlier. However, last year's quarter included a one-off $1.9 million credit from the operator of a Barnett Shale property, without which unit costs would be comparable – $20.35 per barrel versus $20.25.
So the rise in unit costs is not a warning sign: excluding last year's credit they were essentially unchanged. The main pressure on profit came from realised hedge losses, not from deteriorating cost control.
Debt at 1.66x LTM EBITDA is moderate, but liquidity is only $13.9 million, with another $3.2 million borrowed on 20 August
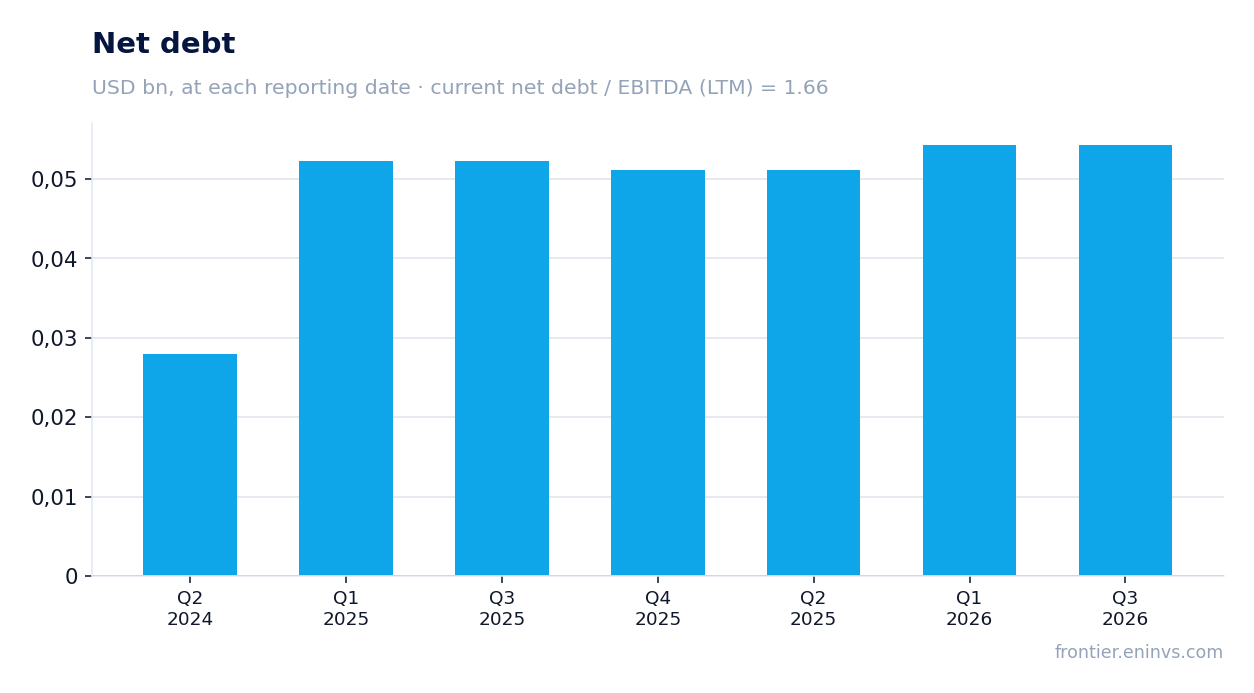
Net debt at the end of June was $35.1 million, equal to 1.66x EBITDA for the trailing twelve months. That is a moderate level, not creating acute pressure, but also not leaving much room for manoeuvre.
Liquidity looks constrained: $6.1 million of cash, $7.7 million available under the credit facility, $13.9 million in total. That is not much for a company that simultaneously pays dividends and funds acquisitions.
After the reporting date, on 20 August, the company closed the $16 million Permian acquisition, funding it with $12.8 million from a share offering and $3.2 million from additional borrowings. With that, debt has risen and pro-forma liquidity is estimated at around $19 million.
The $0.12 quarterly dividend yields 13%, but $4.3 million of payouts exceeded adjusted profit
On 10 September the board declared another quarterly dividend of $0.12 per share – the 52nd consecutive since December 2013. Payment is due on 30 September, and total dividends for the quarter amounted to $4.3 million.
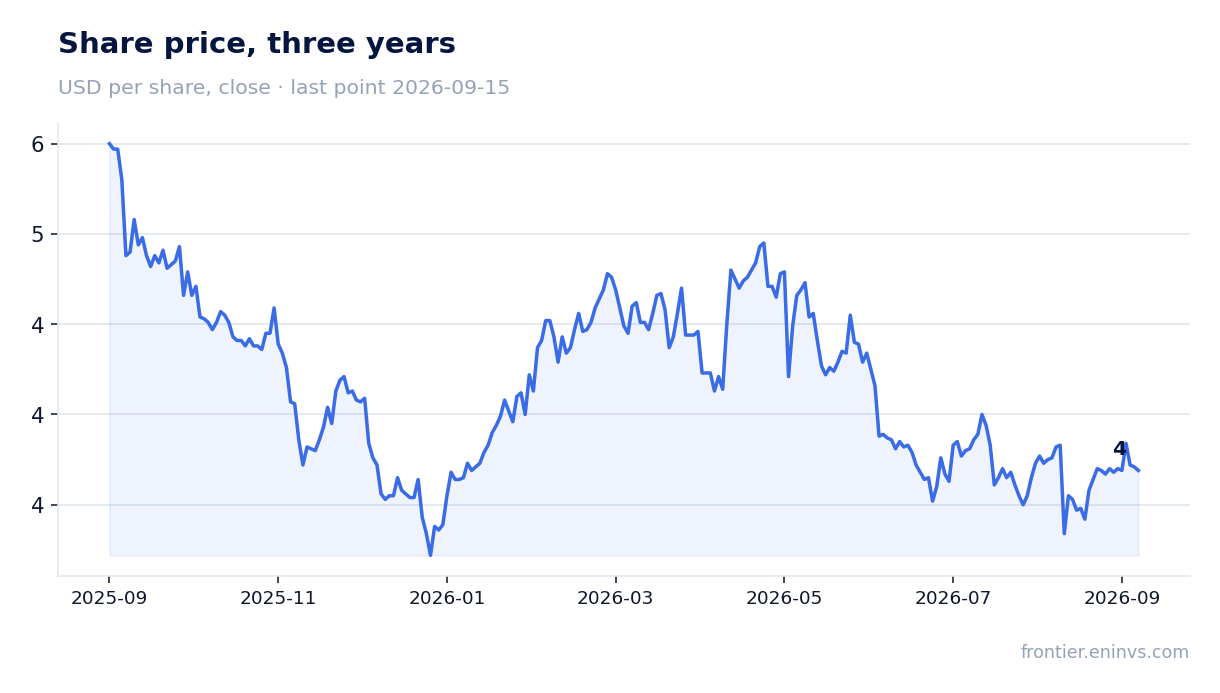
At $3.71 the annual yield reaches 13%, well above current deposit rates, making the stock attractive for income investors. However, the sustainability of the payout is questionable: the company returned $4.3 million to shareholders in the quarter while adjusted net income was negative.
Dividend coverage by operating cash flow remains sufficient: OCF for the quarter was $6.8 million, covering the payout. But including capital expenditure and acquisitions, free cash flow may be close to zero or negative, meaning the payout is partly funded by borrowings.
Our estimate: the company is likely to maintain the dividend at the current $0.48 annual rate, as management emphasises its commitment to returning capital. However, if oil prices remain weak or production continues to decline, the payout could become unsustainable, and a policy revision is possible.
At 7.5x EV/EBITDA the stock is above its own three-year average of 6.4 – the market already prices in success from the Permian deal
The current EV/EBITDA LTM multiple is 7.5, above its own three-year average of 6.4. This means the market values the company more expensively than on average over the past three years, despite the fall in adjusted EBITDA.
The P/E LTM multiple is 83.5, reflecting a low profit base over the trailing twelve months. ROE is negative at -20.4%, due to a loss in one of the quarters.
On the portal's model, which reprices EBITDA at current commodity prices and a target EV/EBITDA, the fair value of the share is 10% below the current market price. This is not a consensus but our own estimate, and it points to limited upside.
The $16 million Permian acquisition added 3,420 net royalty acres and over 1,000 drilling locations
On 20 August Evolution closed the acquisition of mineral and royalty interests in the Permian Basin for $16 million. The deal added 3,420 net royalty acres, 832 producing wells, 34 drilled but uncompleted wells, and over 1,000 future drilling locations.
This acquisition requires no capital expenditure from Evolution, as development is operated by third parties. It expands presence in one of the most active US basins and creates an additional source of cash flow without operational risk.
However, the deal increased debt: $3.2 million was added to the credit facility, with the rest funded by a share offering. This diluted existing shareholders but kept the balance sheet within acceptable limits.
Valuation on the latest reported figures
| Metric | Value |
|---|---|
| Market cap | 0.12 bn USD |
| P/E (LTM) | 83.5 |
| EV/EBITDA (LTM) | 7.5 |
| P/B | 1.71 |
| Net debt / EBITDA (LTM) | 1.66 |
| Operating cash flow (LTM) | 0.02 bn |
| ROE | -20.4% |
| Dividend yield (12m) | 13.0% |
| EV/EBITDA, 3-year average | 6.4 |
Bottom line
The report showed that revenue and net income growth was driven by prices and a one-off hedge revaluation, not by operational improvement. Adjusted EBITDA fell 8.9%, and excluding the non-operating item the company posted a loss. The 13% dividend remains the main support for an investor, but its coverage is questionable given current capex and acquisitions. The 7.5x EV/EBITDA multiple is above its own three-year average, and the portal's model points to 10% downside. Overall the stock looks neutral: the dividend yield is attractive, but operational and valuation risks balance it out.
Open the company's financial profile EPM →
See also: market overview · valuation map · stock screeners