Equinor: profit tripled, and not only oil did the work
Equinor reported second-quarter 2026 results. Revenue rose 37.4% year on year to USD 34,523m, EBITDA by 76.9% to USD 15,583m, and net profit by 269.2% to USD 4,848m. The EBITDA margin reached 46.9% against 36.4% a year earlier, while net debt over twelve months fell from USD 24.9bn to USD 20.3bn. The share looks attractive: EV/EBITDA of 3.0 against its own three-year average of 2.17, a 3.6% dividend yield and 15% upside on the portal's model outweigh the risk of a commodity-price pullback.
Key takeaways
— Revenue added 37.4% year on year, an acceleration after a 5.3% decline a quarter earlier
— EBITDA rose 76.9%, and its margin climbed to 46.9% from 36.4%
— Net profit grew 3.7-fold, to USD 4,848m
— Operating cash flow of USD 9,470m covered capital expenditure of USD 2,872m more than threefold
— Net debt over the year fell from USD 24.9bn to USD 20.3bn
— The 3.6% dividend yield rests on a payout backed by profit and cash flow
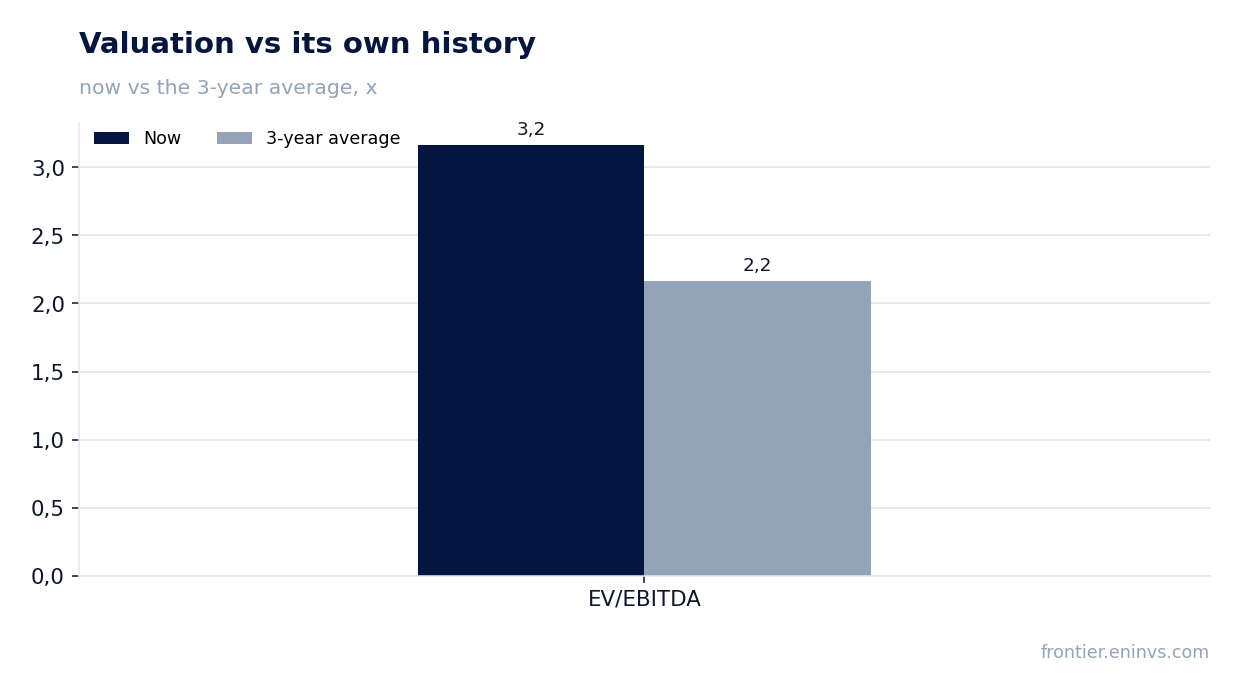
— EV/EBITDA of 3.0 against its own three-year average of 2.17 – the share is above its history
Attractiveness
Key figures, USD bn
| Metric | Q2 2025 | Q2 2026 | Change |
|---|---|---|---|
| Revenue | 25.1 | 34.5 | +37.4% |
| EBITDA | 9.15 | 16.2 | +76.9% |
| Operating profit | 5.72 | 12.9 | +124.8% |
| Net profit | 1.31 | 4.85 | +269.2% |
| Operating cash flow | 2.55 | 9.47 | +270.7% |
| Capex | 3.44 | 2.87 | -16.6% |
| EBITDA margin | 36.4% | 46.9% | +10.5 pp |
| Net margin | 5.2% | 14.0% | +8.8 pp |
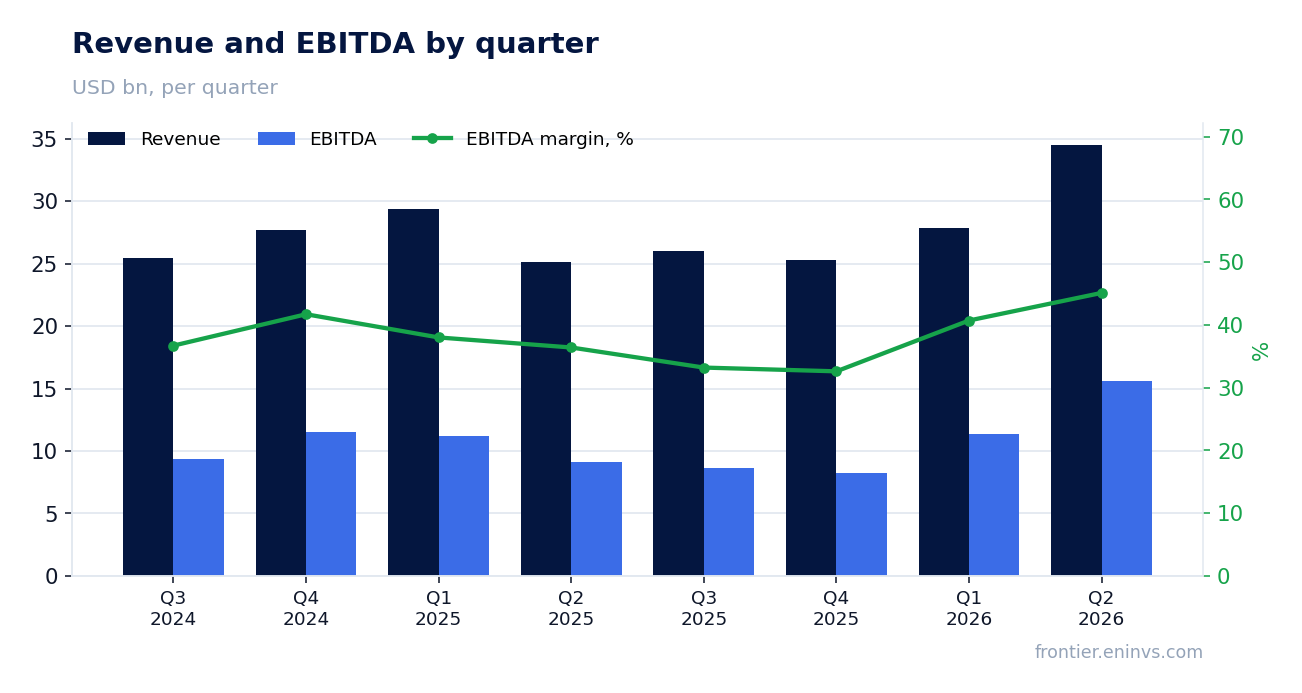
Revenue added 37.4% year on year, an acceleration after a 5.3% decline a quarter earlier
In the second quarter of 2026 Equinor's revenue reached USD 34,523m, up 37.4% year on year. This is a clear acceleration: in the first quarter of 2026 revenue was declining 5.3% year on year. Growth accelerated after a decline – the turn happened within a single quarter.
The quarterly sequence confirms the reversal: revenue was USD 27,815m in the first quarter of 2026 and USD 34,523m in the second. Such a jump in one quarter is unusual for a company of this scale and points to a strong price factor. The prior-year level of USD 25,130m was a low base, which amplified the percentage gain.
For an investor the percentage matters less than the fact that revenue returned to growth after two consecutive quarters of decline. The next report will show whether this level held or was a one-off spike.
EBITDA rose 76.9%, and its margin climbed to 46.9% from 36.4%
EBITDA in the second quarter of 2026 was USD 15,583m, up 76.9% year on year. The EBITDA margin rose to 46.9% from 36.4% in the second quarter of 2025. Profit growth outpaced revenue growth, and that is the main sign of operating leverage.
The gap between revenue and EBITDA growth is explained by the fact that a large part of the company's costs is not tied to production volume. When oil and gas prices rise, the incremental revenue flows almost entirely into EBITDA. That is exactly what happened: the margin added more than 10 percentage points in a year.
Operating profit in the second quarter of 2026 was USD 12,863m – a level that confirms EBITDA growth was not eaten by depreciation or one-off write-downs. For a shareholder the sustainability of this margin matters: if prices pull back, EBITDA will fall faster than revenue.
Net profit grew 3.7-fold, to USD 4,848m
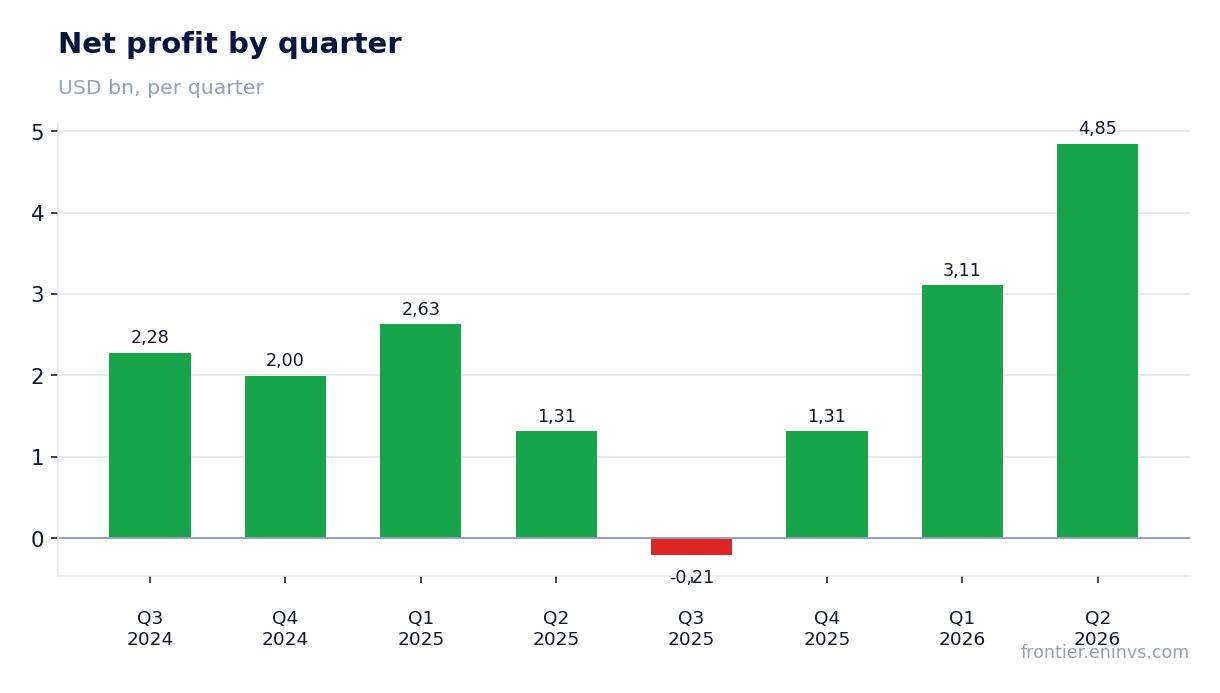
Net profit in the second quarter of 2026 was USD 4,848m, up 269.2% year on year. The net margin rose to 14.0% from 5.2% in the second quarter of 2025. This growth is a consequence not only of operating leverage but also of a low prior-year base.
Last year's profit was depressed by one-off factors that are not repeating this year. Therefore the 269.2% growth rate cannot be extrapolated directly to future quarters. The absolute level matters more: USD 4,848m is a substantial figure that covers both dividends and capital expenditure.
For sustainability, look at LTM: over the last twelve months net profit was USD 8,593.6m. That is below the quarterly figure multiplied by four, which indicates weak earlier quarters. The current quarter is strong, but it alone does not define the year.
Operating cash flow of USD 9,470m covered capital expenditure of USD 2,872m more than threefold
Operating cash flow in the second quarter of 2026 was USD 9,470m, capital expenditure – USD 2,872m. The flow covered investment more than threefold, and this is the key indicator of the company's ability to fund dividends without increasing debt.
Free cash flow, the difference between operating flow and capital expenditure, exceeded USD 6.5bn for the quarter. This is a substantial sum that explains the reduction in net debt. Capital expenditure is moderate – it consumes less than a third of operating flow.
For comparison: a year earlier operating flow was significantly lower and capital expenditure higher. The current ratio is the most favourable in recent quarters. If it persists, the company can both pay dividends and reduce debt.
Net debt over the year fell from USD 24.9bn to USD 20.3bn
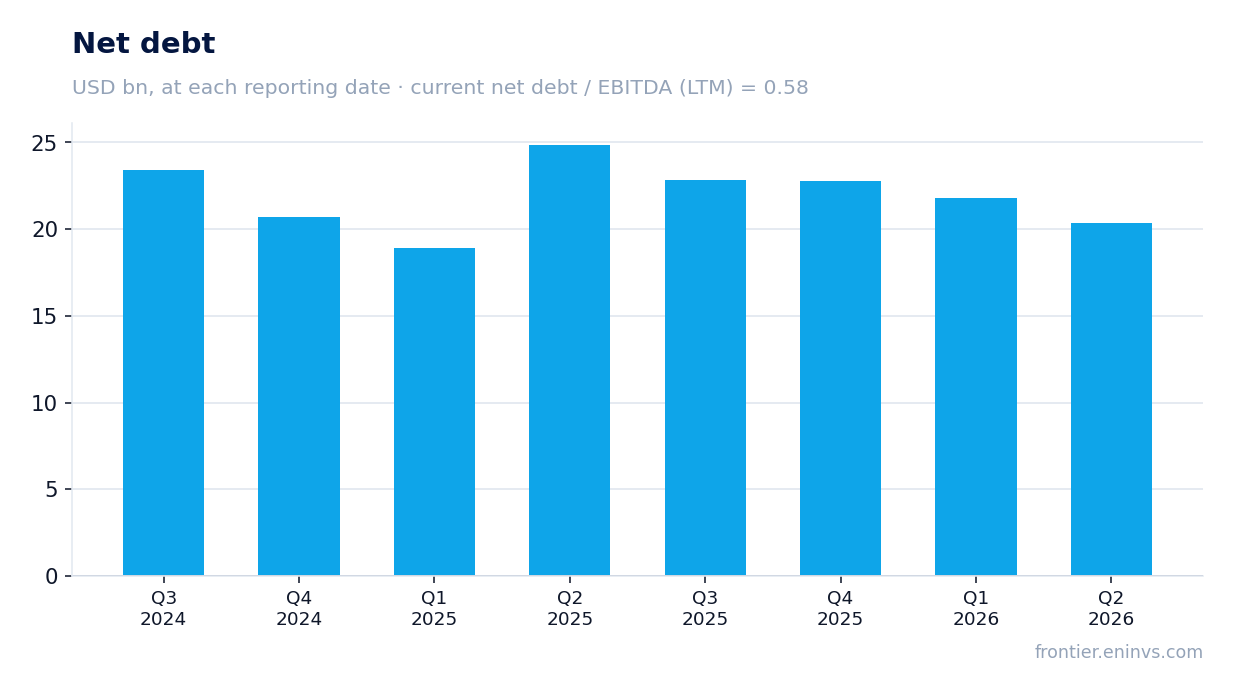
Equinor's net debt as of 30 June 2026 was USD 20.3bn. A year earlier, on 30 June 2025, it stood at USD 24.9bn – a reduction of USD 4.5bn over twelve months. Over the quarter debt fell from USD 21.8bn on 31 March 2026 to USD 20.3bn.
The ratio of net debt to EBITDA over the last twelve months is 0.45. This is a low level, indicating that debt burden is not a constraint on dividends or investment. The company could afford additional borrowing if needed.
The debt reduction occurred alongside EBITDA growth, meaning the improvement was not achieved through asset sales or investment cuts. This is a sustainable balance-sheet improvement that supports credit quality.
The 3.6% dividend yield rests on a payout backed by profit and cash flow
Equinor's dividend yield over the last twelve months is 3.6%. This is a moderate level, below the current yield of many commodity companies but above the broad market. The payout is backed by both net profit and operating cash flow.
Over the last twelve months net profit was USD 8,593.6m and operating cash flow USD 26,948.5m. With a market capitalisation of USD 110.7bn, dividend payments are covered by profit with a margin. The company can sustain the current payout level even if commodity prices decline.
Our estimate for the current year's dividend rests on profit and the payout ratio. If the quarterly profit of USD 4,848m persists, annual profit would exceed USD 19bn, allowing a dividend increase. However, if oil prices fall, profit and the payout could shrink. The key risk is a commodity-price decline.
EV/EBITDA of 3.0 against its own three-year average of 2.17 – the share is above its history
Equinor's EV/EBITDA over the last twelve months is 3.0. This is above its own three-year average of 2.17. The share trades above its three-year average, reflecting market expectations of sustained high commodity prices.
The P/E over the last twelve months is 12.9. This is a moderate level that does not look overheated. The combination of EV/EBITDA and P/E shows that debt burden is low and profit is sufficient to service debt and pay shareholders.
On the portal's model, which re-prices EBITDA at current commodity prices against the target EV/EBITDA, the upside to fair value is +15%. This is our own estimate, not a market consensus. If oil and gas prices remain at current levels, the share could realise this upside.
Valuation on the latest reported figures
| Metric | Value |
|---|---|
| Market cap | 111 bn USD |
| P/E (LTM) | 12.9 |
| EV/EBITDA (LTM) | 3.0 |
| P/B | 2.74 |
| Net debt / EBITDA (LTM) | 0.45 |
| Operating cash flow (LTM) | 26.9 bn |
| ROE | 44.8% |
| Dividend yield (12m) | 3.6% |
| EV/EBITDA, 3-year average | 2.2 |
Bottom line
Bottom line: Equinor delivered a strong quarter – revenue rose 37.4%, EBITDA 76.9%, net profit 3.7-fold. The EBITDA margin climbed to 46.9%, operating cash flow covered capital expenditure more than threefold, and net debt over the year fell from USD 24.9bn to USD 20.3bn. However, a significant part of the profit growth is explained by a low prior-year base and high commodity prices rather than a sustainable operational improvement. The share trades above its three-year average on EV/EBITDA, but the 3.6% dividend yield and 15% upside on the portal's model make it attractive for investors willing to accept commodity risk.
Open the company's financial profile EQNR →
See also: market overview · valuation map · stock screeners