Ero Copper: revenue up 73.9% but profit up only 26.9% as margin compressed
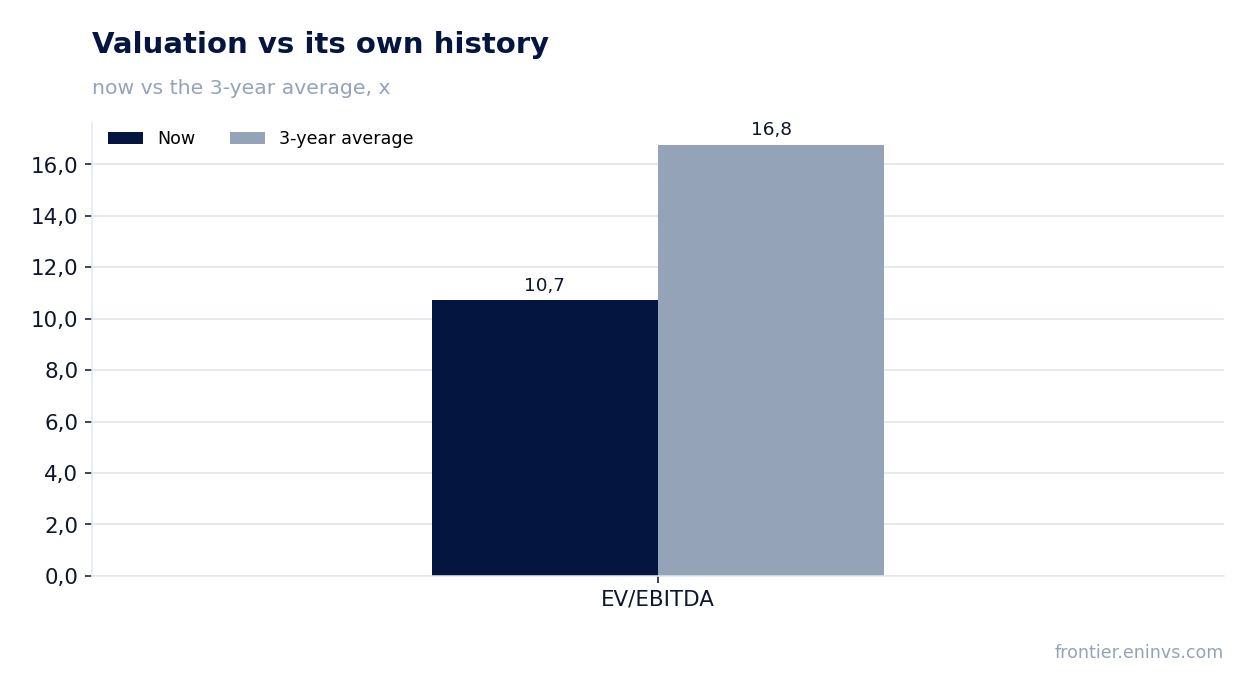
Ero Copper reported second-quarter 2026 results. Revenue rose 73.9% year on year to $284.3m, EBITDA jumped 101.3% to $145.5m, while net profit added only 26.9% to $89.5m. The EBITDA margin improved to 51.2%, but the net margin fell to 31.5% from 43.1% a year earlier. With EV/EBITDA at 10.7 against its own three-year average of 16.8 and the portal model pointing to 6% upside, the share looks rather attractive than not.
Key takeaways
— Revenue rose 73.9% year on year to $284.3m, with growth accelerating for a second straight quarter
— EBITDA jumped 101.3% to $145.5m, lifting its margin to 51.2% from 44.2% a year earlier
— Net profit added only 26.9% to $89.5m, and the net margin fell to 31.5% as cost growth ate into operating success
— Free cash flow remains under pressure: capital expenditure in Q2 was $86.0m against operating cash flow of $137.9m
— Leverage is moderate: net debt of $526.9m, or 1.25x LTM EBITDA
— The stock trades at EV/EBITDA of 10.7, below its own three-year average of 16.8, leaving room for re-rating
— The portal model estimates upside to fair value at +6%
Attractiveness
Key figures, USD bn
| Metric | Q2 2025 | Q2 2026 | Change |
|---|---|---|---|
| Revenue | 0.16 | 0.28 | +73.9% |
| EBITDA | 0.07 | 0.15 | +101.3% |
| Operating profit | 0.05 | 0.11 | +127.2% |
| Net profit | 0.07 | 0.09 | +26.9% |
| Operating cash flow | 0.09 | 0.14 | +52.7% |
| Capex | 0.07 | 0.09 | +20.7% |
| EBITDA margin | 44.2% | 51.2% | +7.0 pp |
| Net margin | 43.1% | 31.5% | -11.6 pp |
Revenue rose 73.9% year on year to $284.3m, with growth accelerating for a second straight quarter
In the second quarter of 2026, Ero Copper's revenue reached $284.3m, up 73.9% from a year earlier. This extends a run of strong quarters: growth was 110.4% in Q1 and 161.3% in Q4 2025. The acceleration reflects both favourable copper prices and higher production volumes after the completion of a capital investment phase.
The sequential improvement is also evident: revenue in Q1 2026 was $263.2m, implying roughly 8% growth over the quarter. The company has returned to a stable growth trajectory after the volatility of 2024, when quarterly revenue fluctuated between $122m and $125m.
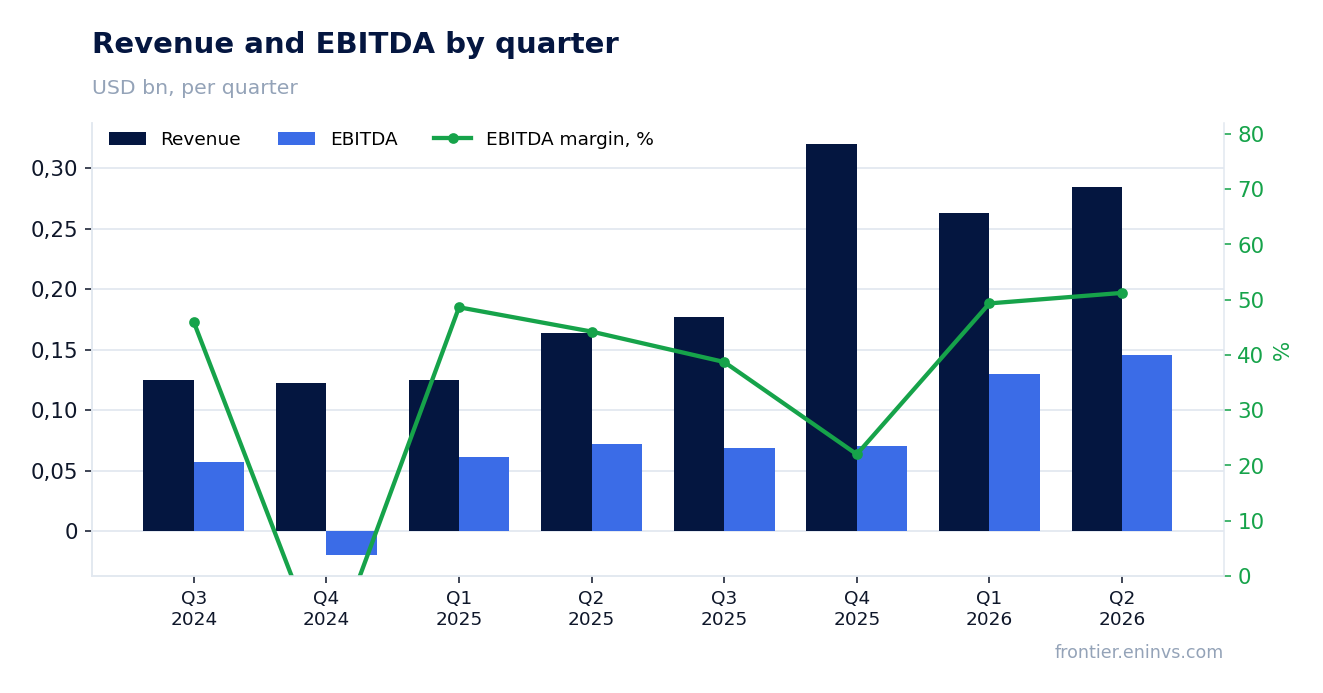
EBITDA jumped 101.3% to $145.5m, lifting its margin to 51.2% from 44.2% a year earlier
EBITDA in Q2 2026 reached $145.5m, more than double the $72.3m a year earlier. The EBITDA margin rose to 51.2% from 44.2%, the highest level in several years. The jump reflects operating leverage: revenue is growing faster than costs, as a significant portion of expenses is fixed.
For comparison, Q1 2026 EBITDA was $129.8m with a margin of about 49%. The sequential improvement indicates that the company is not only benefiting from metal prices but also improving mining efficiency. In 2024, quarterly EBITDA was volatile and even turned negative in Q4 2024 at -$20.1m due to one-off write-downs.
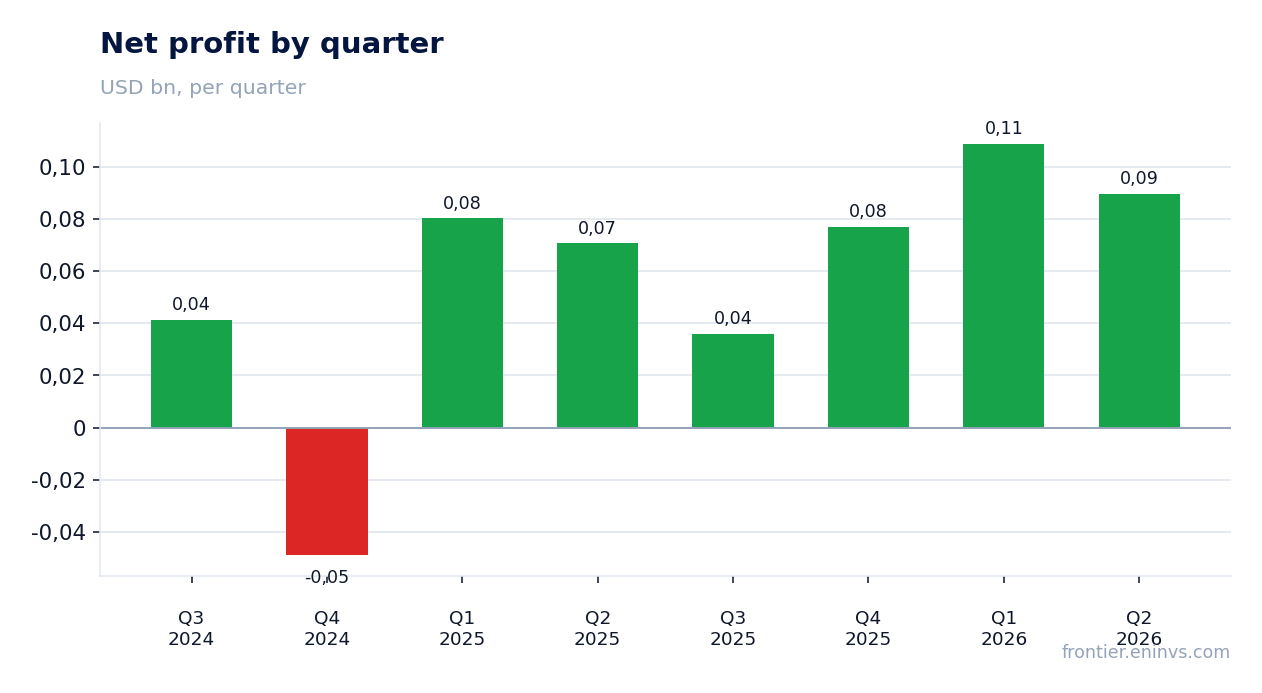
Net profit added only 26.9% to $89.5m, and the net margin fell to 31.5% as cost growth ate into operating success
Net profit in Q2 2026 was $89.5m, up 26.9% year on year. However, the growth was much slower than EBITDA: the net margin fell to 31.5% from 43.1% a year earlier. This divergence suggests additional expenses below the operating line — likely higher interest, taxes, or depreciation.
Notably, Q1 2026 net profit was $108.8m, meaning Q2 saw a 17.7% sequential decline. This contrasts with the growth in EBITDA and revenue. A possible cause is one-off factors or higher financial expenses, but the exact reason is not disclosed in the provided data.
For an investor, this means that operating success is not fully converting into net profit. If the gap persists, it could limit dividend payouts and equity growth.
Free cash flow remains under pressure: capital expenditure in Q2 was $86.0m against operating cash flow of $137.9m
Operating cash flow in Q2 2026 was $137.9m, up 52.8% from $90.3m a year earlier. However, capital expenditure remains high at $86.0m, though lower than last year's $71.3m. As a result, free cash flow (operating cash flow minus capex) was about $51.9m.
Over the trailing twelve months, operating cash flow reached $395.1m, while capital expenditure was around $300m, leaving free cash flow at approximately $95m. The company continues to invest in maintaining and expanding production, which limits the scope for significant dividends or debt reduction.
Nevertheless, operating cash flow is growing faster than capital expenditure, gradually improving the situation. If copper prices remain high, free cash flow could increase, providing a basis for future payouts.
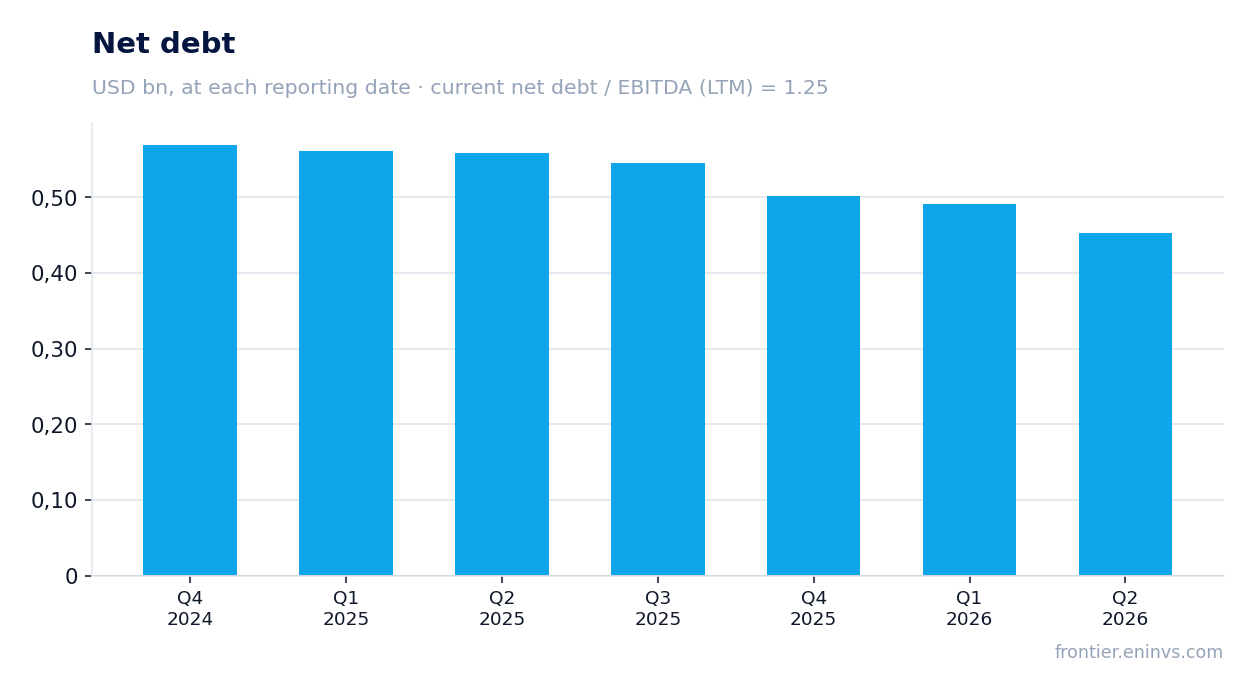
Leverage is moderate: net debt of $526.9m, or 1.25x LTM EBITDA
Net debt at the latest reporting date was $526.9m, equivalent to 1.25x LTM EBITDA. This is a moderate level for a mining company, especially given metal price volatility. Over the past 12 months, net debt decreased by $0.1bn, reflecting a gradual improvement in the financial position.
A net debt/EBITDA ratio of 1.25 gives the company room to manoeuvre: even if copper prices fall, leverage remains manageable. Interest expenses are likely well covered by operating profit, although the exact interest payments are not disclosed.
Importantly, the company is not increasing debt to fund capital expenditure — it is covered by operating cash flow. This reduces the risk of financial instability.
The stock trades at EV/EBITDA of 10.7, below its own three-year average of 16.8, leaving room for re-rating
The current EV/EBITDA multiple is 10.7, well below its own three-year average of 16.8. This means the market values the company cheaper than it has on average over the past three years. Meanwhile, the LTM P/E is 12.7 and ROE is 31.0%, indicating high capital efficiency.
The gap between the current valuation and the historical average may reflect both a general decline in interest in the mining sector and concerns about the sustainability of high copper prices. However, the company's fundamentals are improving: revenue and EBITDA are growing, and leverage is moderate.
If the multiple returns even halfway to its historical average, it would provide significant upside for the market capitalisation. The portal model estimates upside to fair value at +6%.
The portal model estimates upside to fair value at +6%
According to the portal model, which re-prices EBITDA at current commodity prices and a target EV/EBITDA, the fair value implies 6% upside to the current market price. This is a moderate but positive signal, confirming that the share does not look overvalued.
It is important to emphasise that this is our own estimate, not a market consensus. It is based on the assumption that current copper prices and the target multiple will hold, which may be revised depending on market conditions.
For an investor, this means that even without a significant rise in metal prices, the share has some upside from multiple re-rating.
Valuation on the latest reported figures
| Metric | Value |
|---|---|
| Market cap | 3.99 bn USD |
| P/E (LTM) | 12.7 |
| EV/EBITDA (LTM) | 10.7 |
| P/B | 4.26 |
| Net debt / EBITDA (LTM) | 1.25 |
| Operating cash flow (LTM) | 0.40 bn |
| ROE | 31.0% |
| EV/EBITDA, 3-year average | 16.8 |
Bottom line
Ero Copper delivered a strong operating quarter: revenue rose 73.9%, EBITDA doubled, and the EBITDA margin reached 51.2%. However, net profit added only 26.9%, and the net margin fell to 31.5% as cost growth below the operating line ate into the success. Leverage is moderate (1.25x EBITDA), free cash flow is positive but constrained by capital expenditure. The stock trades at EV/EBITDA of 10.7 against a three-year average of 16.8, leaving room for re-rating; the portal model points to 6% upside. Overall, the share looks rather attractive than not, but confirmation of the trend requires seeing how the company handles pressure on the net margin in the next quarter.
Open the company's financial profile ERO →
See also: market overview · valuation map · stock screeners