First Quantum Minerals: profit up 7.6x, but working capital absorbed the entire quarterly cash flow
First Quantum Minerals reported Q2 2026 results. Revenue rose 24.1% year on year to USD 1,522m, EBITDA jumped 56.3% to USD 619m, and net profit increased 7.6x to USD 136m. The EBITDA margin expanded to 40.7% from 32.3% a year earlier, yet operating cash flow was only USD 130m. In our view the stock looks unattractive: EV/EBITDA LTM of 15.7x, P/E LTM near 250, and the portal model implies 34% downside to fair value.
Key takeaways
— Revenue accelerated to +24.1% YoY, but the quarter, not the half, delivered the growth
— EBITDA rose 56.3% on margin expansion, not just volume
— Net profit of USD 136m turned positive after a loss in the prior quarter
— Operating cash flow of USD 130m does not even cover interest expense
— Net debt rose to USD 5.4bn, with net debt / EBITDA LTM at 3.07
— Valuation at 15.7x EV/EBITDA and 250x P/E LTM leaves no room for error
— The portal model implies 34% downside to fair value
Attractiveness
Key figures, USD bn
| Metric | Q2 2025 | Q2 2026 | Change |
|---|---|---|---|
| Revenue | 1.23 | 1.52 | +24.1% |
| EBITDA | 0.40 | 0.62 | +56.3% |
| Operating profit | 0.26 | 0.18 | -29.4% |
| Net profit | 0.02 | 0.14 | +655.6% |
| Operating cash flow | 0.78 | 0.13 | -83.3% |
| EBITDA margin | 32.3% | 40.7% | +8.4 pp |
| Net margin | 1.5% | 8.9% | +7.4 pp |
Revenue accelerated to +24.1% YoY, but the quarter, not the half, delivered the growth
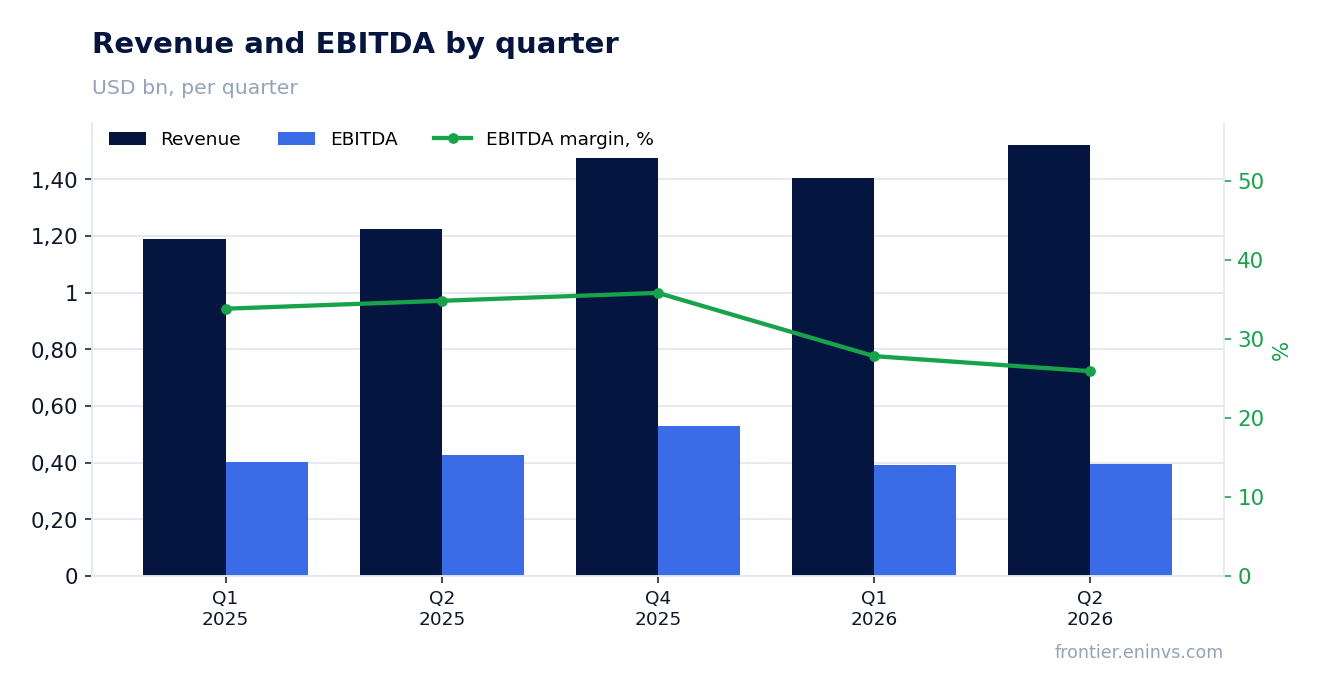
In Q2 2026 revenue reached USD 1,522m, up 24.1% year on year. This is an acceleration from Q1 2026, when growth was 18.0%. The quarterly dynamics are noticeably better than the trailing twelve months, where LTM revenue stands at USD 5,500m.
The growth was driven by quarterly volume rather than the half-year. In H1 2026 revenue comprised USD 1,404m in Q1 and USD 1,522m in Q2, versus USD 1,190m and USD 1,226m a year earlier. This means the Q2 acceleration is not a one-off spike but a continuation of the trend that began in Q1.
Revenue growth of 24.1% is the fastest in at least five quarters. For comparison, Q4 2025 revenue was USD 1,475m, only 3.2% above the Q2 2026 level. This indicates the company is ramping up sales at an accelerating pace.
EBITDA rose 56.3% on margin expansion, not just volume
EBITDA in Q2 2026 was USD 619m, up 56.3% year on year. EBITDA growth is more than double revenue growth, indicating a substantial improvement in profitability. The EBITDA margin rose to 40.7% from 32.3% in Q2 2025.
The 8.4 percentage point margin improvement is the key driver of profit growth. It occurred alongside revenue growth, pointing to positive operating leverage: revenue rose 24.1% while EBITDA rose 56.3%. However, operating profit in Q2 2026 was USD 180m, lower than both Q1 2026 (USD 190m) and Q2 2025 (USD 255m). This discrepancy is explained by the fact that EBITDA excludes depreciation and other non-operating items, which increased.
EBITDA growth alongside falling operating profit suggests the main improvement came at the pre-depreciation level, possibly through lower cash costs. Without additional detail from the report, we cannot state which cost lines moved. Importantly, the 40.7% EBITDA margin is the highest in at least five quarters.
Net profit of USD 136m turned positive after a loss in the prior quarter
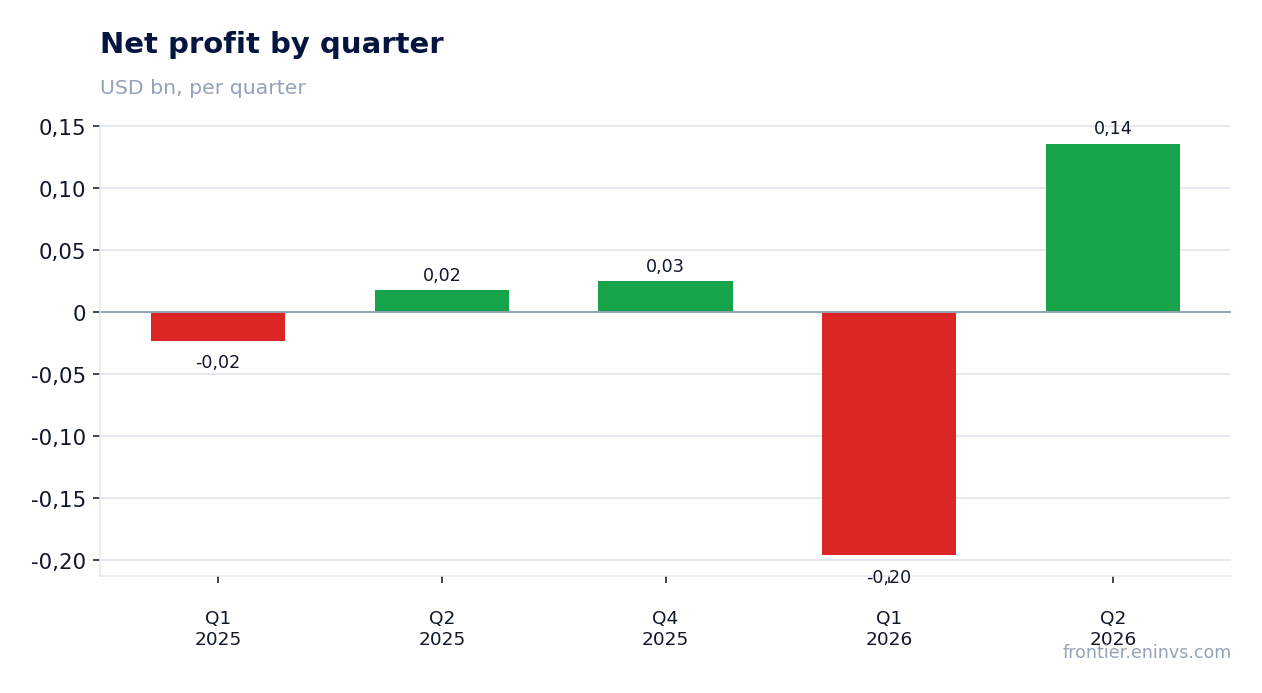
Net profit in Q2 2026 was USD 136m, compared with a loss of USD 196m in Q1 2026. Year on year, profit increased 7.6x from USD 18m in Q2 2025. This is a sharp improvement after the loss-making first quarter.
The net margin rose to 8.9% from 1.5% a year earlier. However, in absolute terms profit remains small relative to revenue of USD 1,522m. The main driver of profit growth was the significant rise in EBITDA, which more than offset higher depreciation and interest expense.
The Q1 2026 loss of USD 196m was a one-off event, and the return to profit in Q2 confirms the company can generate positive earnings. Nevertheless, LTM net profit is only USD 90m, reflecting weak results in previous quarters.
Operating cash flow of USD 130m does not even cover interest expense
Operating cash flow in Q2 2026 was USD 130m, well below EBITDA of USD 619m. This means most of EBITDA was absorbed by working capital changes, interest and taxes. For comparison, operating cash flow was USD 780m in Q2 2025 and USD 420m in Q1 2026.
Such a low cash flow raises questions about earnings quality. With net profit of USD 136m and EBITDA of USD 619m, operating cash flow of USD 130m points to a significant outflow into working capital or one-off payments. Without detail from the report we cannot name the exact cause, but the fact remains: the quarter was weak in cash generation.
Over the trailing twelve months, operating cash flow was USD 1,432m, still well below LTM EBITDA of USD 1,763m. This suggests the company does not fully convert profit into cash. For a mining company this could be due to inventory or receivables build-up, but without further data we refrain from conclusions.
Net debt rose to USD 5.4bn, with net debt / EBITDA LTM at 3.07
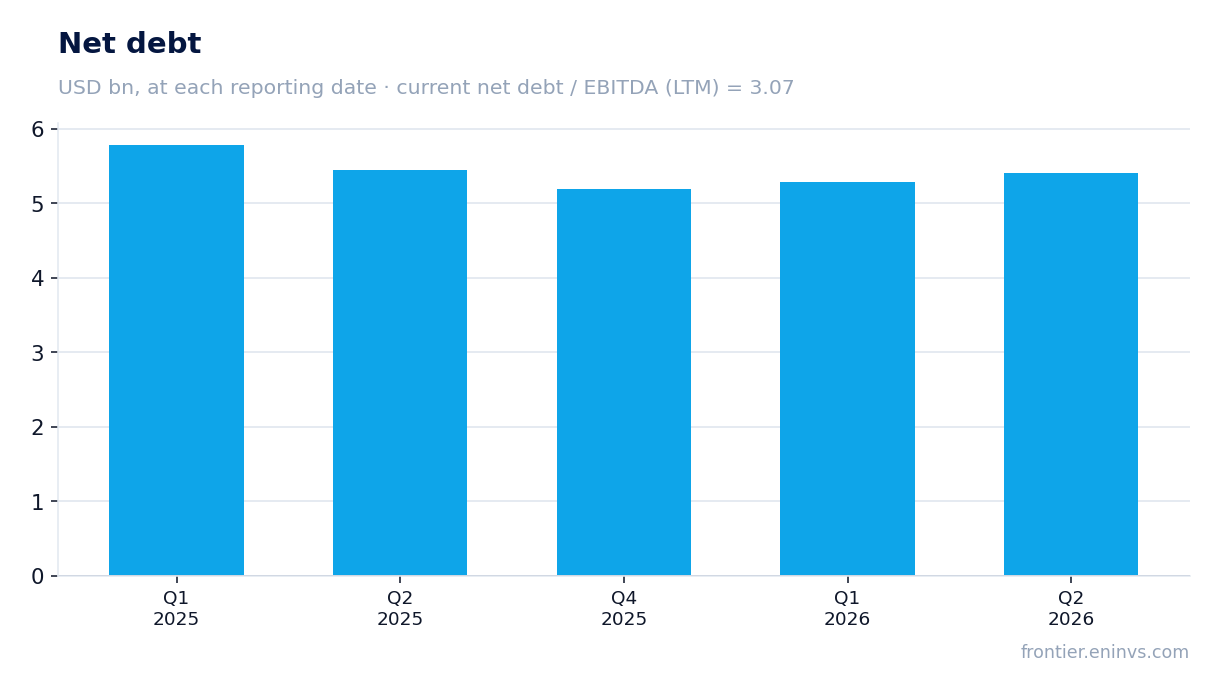
Net debt as of 30 June 2026 was USD 5,407m, up from USD 5,284m on 31 March 2026. Over the year net debt was virtually unchanged: USD 5,453m on 30 June 2025. The net debt / EBITDA LTM ratio is 3.07, a moderate level for a mining company but one that warrants attention.
The USD 123m increase in net debt during the quarter came amid weak operating cash flow. The company likely funded capital expenditure and debt servicing through new borrowings or cash balances. This raises leverage and limits financial flexibility.
A ratio of 3.07 may be acceptable in a period of high commodity prices, but could rise quickly if prices fall. Importantly, we do not have the previous value of this ratio, so we cannot say whether leverage rose or fell. We state the current level only.
Valuation at 15.7x EV/EBITDA and 250x P/E LTM leaves no room for error
EV/EBITDA LTM stands at 15.7x, while P/E LTM is 249.8x. These are very high multiples, especially P/E, which reflects a low earnings base over the trailing twelve months. Market capitalisation is USD 22,486m, far exceeding LTM EBITDA of USD 1,763m.
Such a high P/E is explained by LTM net profit of only USD 90m against a market cap of USD 22.5bn. This means investors are paying a huge premium for current earnings, possibly expecting future growth. However, EV/EBITDA of 15.7x is also above typical levels for mining companies, indicating overvaluation.
We do not have data on the three-year average multiple, so we cannot compare the current level with history. But the absolute values speak for themselves: the market values the company well above its current ability to generate profit and cash flow.
The portal model implies 34% downside to fair value
According to the portal model, which re-prices EBITDA at current commodity prices using a target EV/EBITDA, the fair value of the share is 34% below the current market price. This is our own estimate, not a market consensus. It indicates the stock is overvalued relative to fundamental value based on current commodity prices.
The model incorporates the current capital structure and market capitalisation. With EV/EBITDA LTM at 15.7x and a target multiple that is likely lower, fair value is substantially below the current price. This reinforces the conclusion that the stock is unattractive at current levels.
It is worth emphasising that the portal model is not a forecast or a recommendation, but a valuation estimate. It could change with commodity prices or the cost structure. However, at present it gives a clear signal of overvaluation.
Valuation on the latest reported figures
| Metric | Value |
|---|---|
| Market cap | 22.5 bn USD |
| P/E (LTM) | 249.8 |
| EV/EBITDA (LTM) | 15.7 |
| P/B | 2.01 |
| Net debt / EBITDA (LTM) | 3.07 |
| Operating cash flow (LTM) | 1.43 bn |
| ROE | 4.9% |
Bottom line
In Q2 2026 First Quantum Minerals delivered strong revenue growth of 24.1% and EBITDA growth of 56.3%, with net profit turning positive after a loss in the prior quarter. However, operating cash flow was only USD 130m, failing to cover even interest expense, and net debt rose to USD 5.4bn. Valuation at 15.7x EV/EBITDA and 250x P/E LTM appears stretched, and the portal model implies 34% downside to fair value. In our view, the stock is unattractive at current levels.
Open the company's financial profile FQM →
See also: market overview · valuation map · stock screeners