Hudbay Minerals: Q2 2026 profit up 16.7%, but cash flow runs almost twice ahead of it
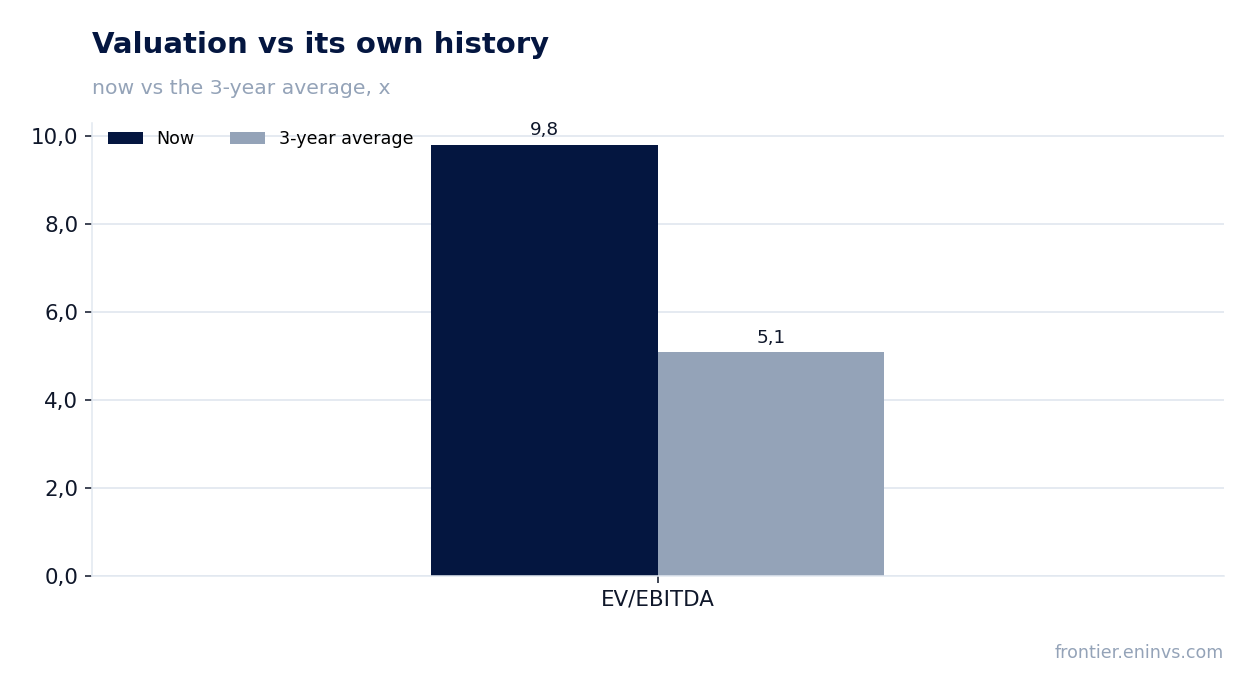
Hudbay Minerals reported second-quarter 2026 results. Revenue rose 17.7% year on year to $631.3 million, EBITDA – by 18.2% to $293.8 million, and net profit – by 16.7% to $137.4 million. The EBITDA margin was almost flat at 46.5% versus 46.3% a year earlier, while operating cash flow reached $297.0 million, more than double the profit. With EV/EBITDA at 9.79 against its own three-year average of 5.08 and the portal model pointing to a 31% downside, the stock looks rather unattractive at current levels.
Key takeaways
— Revenue added 17.7% year on year but fell 16.6% quarter on quarter
— EBITDA margin held at 46.5%, though it was higher a quarter earlier
— Net profit rose 16.7%, but operating cash flow is almost twice as large
— The company moved to a net cash position: net debt of minus $30.7 million
— Capex rose to $153.4 million and left almost no free cash flow
— Trailing 12-month dividend yield is just 0.07%
— EV/EBITDA of 9.79 against its own three-year average of 5.08
Attractiveness
Key figures, USD bn
| Metric | Q2 2025 | Q2 2026 | Change |
|---|---|---|---|
| Revenue | 0.54 | 0.63 | +17.7% |
| EBITDA | 0.25 | 0.29 | +18.2% |
| Operating profit | 0.15 | 0.20 | +34.7% |
| Net profit | 0.12 | 0.14 | +16.7% |
| Operating cash flow | 0.26 | 0.30 | +14.3% |
| Capex | 0.12 | 0.15 | +26.0% |
| EBITDA margin | 46.3% | 46.5% | +0.2 pp |
| Net margin | 21.9% | 21.8% | -0.1 pp |
Revenue added 17.7% year on year but fell 16.6% quarter on quarter
In the second quarter of 2026, revenue came in at $631.3 million, up 17.7% from a year earlier. Year-on-year growth has now been positive for four consecutive quarters, though the pace has slowed: 27.3% in Q1, now 17.7%. This is still solid growth, but noticeably weaker than at the start of the year.
Compared with the first quarter of 2026, revenue fell 16.6% – from $757.3 million to $631.3 million. This sequential decline is primarily due to lower copper and gold prices, and possibly lower sales volumes. The company does not provide details in the available data, but the fact remains: the sequential drop is the first sign of a slowdown after a strong start to the year.
EBITDA margin held at 46.5%, though it was higher a quarter earlier
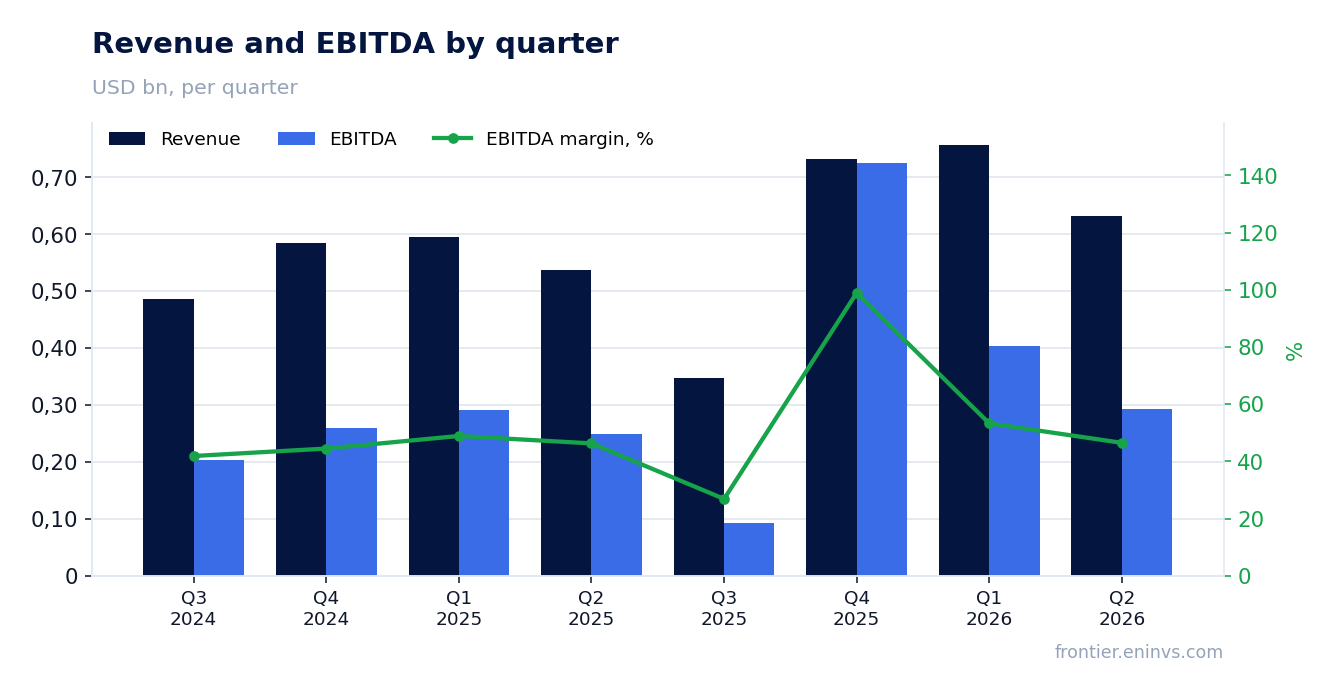
EBITDA in Q2 2026 was $293.8 million, up 18.2% from a year earlier. The EBITDA margin was almost unchanged – 46.5% versus 46.3% a year ago. This is a very high margin level that the company has maintained for several quarters.
However, in Q1 2026 the margin was even higher: with revenue of $757.3 million, EBITDA was $403.4 million, or 53.3%. The sequential margin decline came amid falling revenue, suggesting that costs did not decline proportionally. The report does not disclose the cost structure, so it is impossible to say which expense line exerted pressure. But the fact remains: the margin is still high, but no longer as high as at the start of the year.
Net profit rose 16.7%, but operating cash flow is almost twice as large
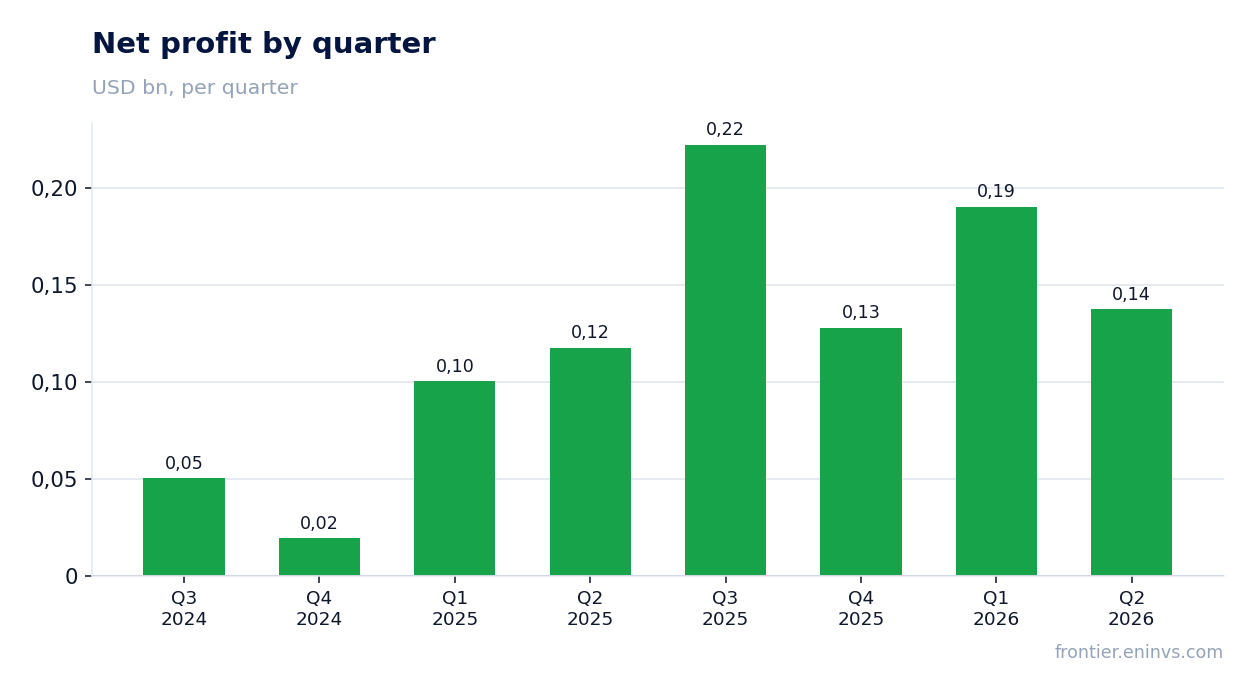
Net profit in Q2 2026 was $137.4 million, up 16.7% from a year earlier. The net margin remained almost flat – 21.8% versus 21.9%. Profit is growing, but the growth rate lags slightly behind revenue and EBITDA.
Operating cash flow was significantly higher than profit – $297.0 million. This is almost twice the net profit. Such a gap may be explained by non-cash items, such as depreciation, or changes in working capital. In any case, the ability to generate cash flow significantly exceeds accounting profit, which is a positive signal for funding investments and dividends.
The company moved to a net cash position: net debt of minus $30.7 million
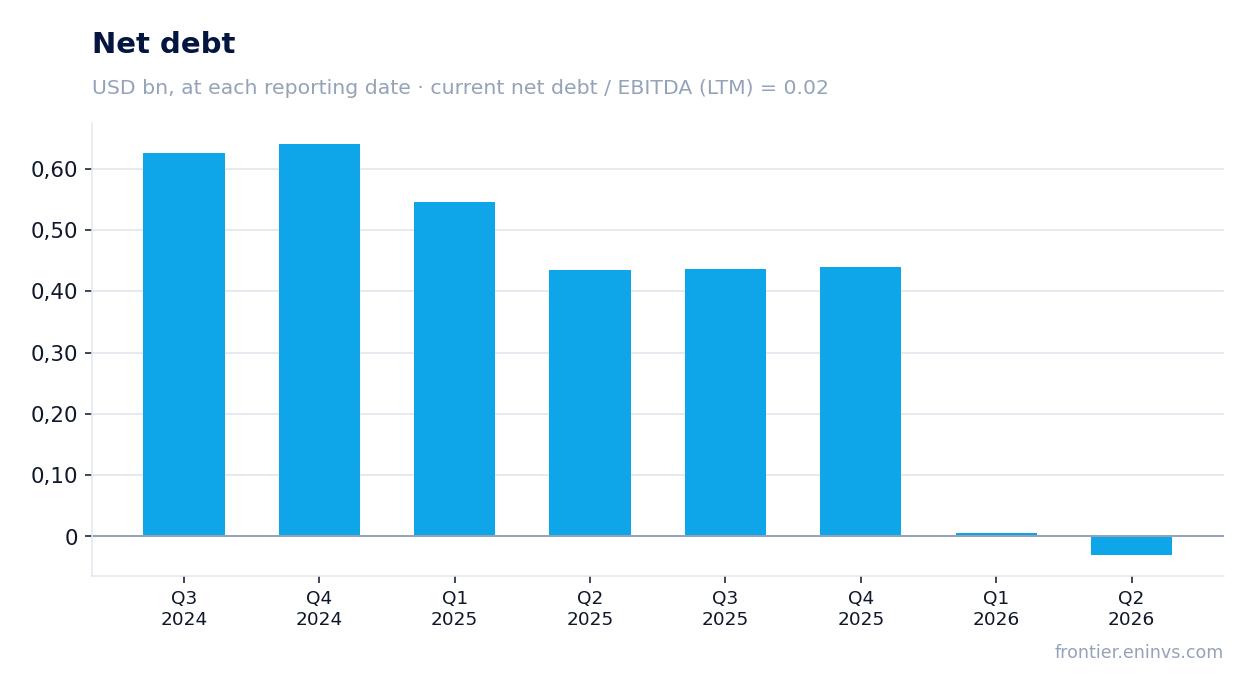
At the end of Q2 2026, the company's net debt was minus $30.7 million, meaning cash exceeds debt obligations. This is a significant improvement from previous periods: in Q1 2026 net debt was $5.6 million, and a year ago it was $434.1 million. The company has almost completely repaid its debt.
The net debt to EBITDA ratio for the trailing twelve months is 0.02, close to zero. This is a very low level of leverage, giving the company financial flexibility. However, the provided data does not include interest expenses, so the cost of servicing debt cannot be assessed. Nevertheless, the move to a net cash position is an important achievement.
Capex rose to $153.4 million and left almost no free cash flow
Capital expenditures in Q2 2026 were $153.4 million, up 26.1% from a year earlier ($121.7 million). Capex has been rising for two consecutive quarters: in Q1 2026 it was $140.2 million. The company continues to invest in development, which may be related to expansion projects or maintaining existing capacity.
With operating cash flow of $297.0 million and capex of $153.4 million, free cash flow was about $143.6 million. This is a positive figure, but significantly lower than it could have been with more moderate investment. Rising capex consumes part of the cash flow that could have been directed to dividends or debt reduction. However, given that the company already has a net cash position, such investments appear justified.
Trailing 12-month dividend yield is just 0.07%
The trailing 12-month dividend yield is 0.07%, which is extremely low. With a market capitalisation of $11.4 billion, this implies total dividend payments for the year of about $8.3 million. The company is not a dividend story: payouts are symbolic and are not the main way of returning capital to shareholders.
For comparison, the key rate in the US is significantly higher, and yields on many other instruments exceed 4-5%. Thus, the dividend factor cannot serve as an argument in favour of investing in Hudbay Minerals shares. The main return on capital for investors can only come through capital appreciation, which makes the stock riskier.
EV/EBITDA of 9.79 against its own three-year average of 5.08
The current EV/EBITDA multiple is 9.79, almost double its own three-year average of 5.08. This means the stock is valued significantly higher than its average over the past three years. At the same time, the trailing P/E is 16.8, which may also be above historical levels, although there is no data for comparison.
According to the portal's model, which re-prices EBITDA at current commodity prices at the target EV/EBITDA, the downside to fair value is 31%. This is our own model's number, not a market consensus. Thus, the current valuation looks inflated relative to both its own history and our model.
Valuation on the latest reported figures
| Metric | Value |
|---|---|
| Market cap | 11.4 bn USD |
| P/E (LTM) | 16.8 |
| EV/EBITDA (LTM) | 9.8 |
| P/B | 3.53 |
| Net debt / EBITDA (LTM) | 0.02 |
| Operating cash flow (LTM) | 0.71 bn |
| ROE | 13.2% |
| Dividend yield (12m) | 0.1% |
| EV/EBITDA, 3-year average | 5.1 |
Bottom line
Bottom line: in Q2 2026 Hudbay Minerals showed year-on-year growth in revenue and profit, maintained a high EBITDA margin, and moved to a net cash position. However, the sequential decline in revenue and margin, as well as operating cash flow nearly double the profit, warrant attention. The key question for a holder is valuation: EV/EBITDA of 9.79 against a three-year average of 5.08 and a 31% downside according to the portal's model make the stock vulnerable. A dividend yield of 0.07% does not compensate for the risks. Verdict – rather unattractive.
Open the company's financial profile HBM →
See also: market overview · valuation map · stock screeners