IAMGOLD: profit nearly tripled, but free cash went into production growth
On August 13, IAMGOLD reported results for the second quarter of 2026. Revenue rose 47.5% year on year to $856.9 million, EBITDA by 75.4% to $488.1 million, and net profit by 192.9% to $230.5 million. The EBITDA margin climbed to 57.0% from 47.9% a year earlier, and net debt turned negative at -$52.1 million as of June 30. With an EV/EBITDA of 4.7 and the portal's model pointing to 49% upside, the stock looks attractive, but margin sustainability hinges on gold prices.
Key takeaways
— Revenue rose 47.5% year on year to $856.9 million, but the quarter was weaker than the previous one
— EBITDA added 75.4% and the margin climbed to 57.0% – a level that hinges on gold prices
— Net profit rose 192.9% to $230.5 million and almost all of it stayed in the business
— Operating cash flow of $445.1 million covers production growth, but free cash is limited
— Net debt turned negative at -$52.1 million on June 30 versus $838.3 million a year earlier
— At EV/EBITDA of 4.7 and P/E of 9.2 the stock trades below its own history, and the portal's model points to 49% upside
— The next report will show whether the 57.0% margin holds at current gold prices
Attractiveness
Key figures, USD bn
| Metric | Q2 2025 | Q2 2026 | Change |
|---|---|---|---|
| Revenue | 0.58 | 0.86 | +47.5% |
| EBITDA | 0.28 | 0.49 | +75.4% |
| Operating profit | 0.18 | 0.39 | +117.4% |
| Net profit | 0.08 | 0.23 | +192.9% |
| Operating cash flow | 0.09 | 0.45 | +418.8% |
| EBITDA margin | 47.9% | 57.0% | +9.1 pp |
| Net margin | 13.5% | 26.9% | +13.4 pp |
Revenue rose 47.5% year on year to $856.9 million, but the quarter was weaker than the previous one
In the second quarter of 2026, revenue came in at $856.9 million, up 47.5% from a year earlier. The growth was driven primarily by gold prices: the average realised price is not disclosed in the report, but the revenue dynamics at comparable sales volumes point to a price factor. The company does not disclose exact sales volumes in the press release, so splitting the growth into price and volume is not possible.
The sequential dynamics are weaker: in the first quarter of 2026 revenue was $1,030.1 million, so quarter on quarter it fell 16.8%. This reflects the fact that the first quarter included higher sales volumes after production recovery. Year-on-year growth remains strong, but the current level is below the peak at the start of the year.
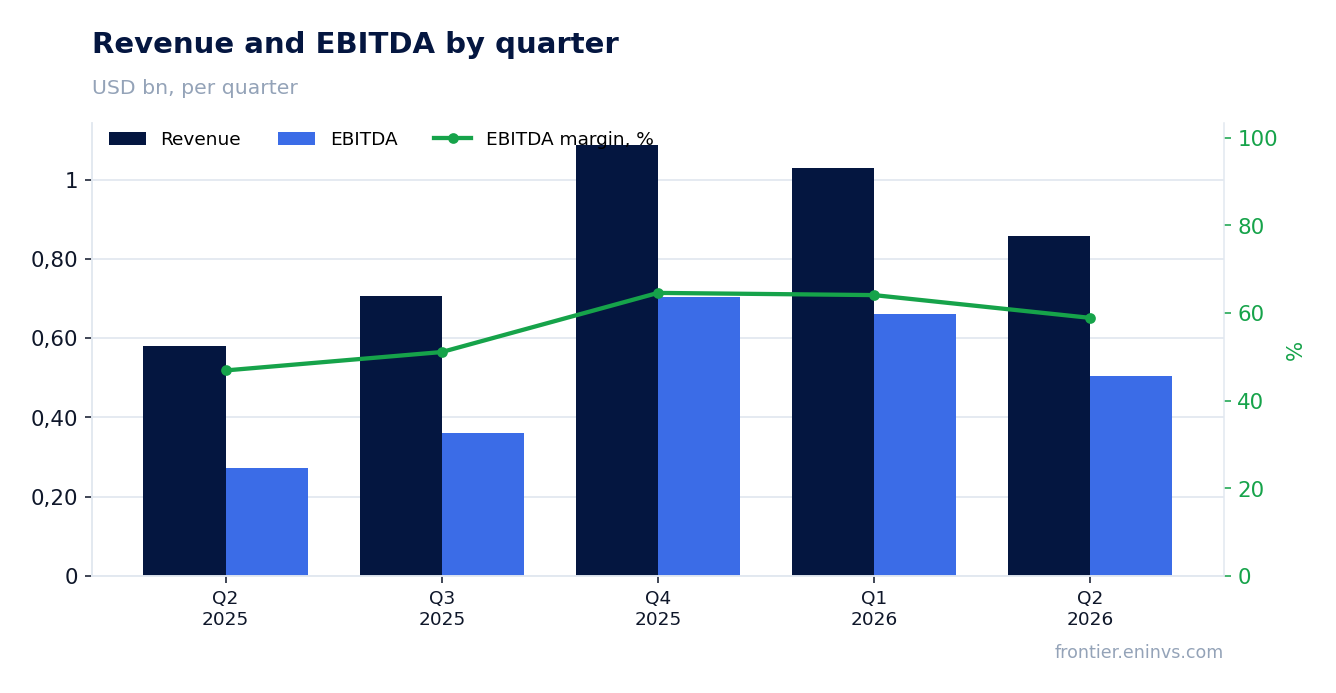
EBITDA added 75.4% and the margin climbed to 57.0% – a level that hinges on gold prices
EBITDA in the second quarter of 2026 was $488.1 million, up 75.4% from a year earlier. The EBITDA margin rose to 57.0% from 47.9% a year earlier. Such margin growth on revenue that rose 47.5% means costs grew slower than revenue – likely due to operating leverage amid high gold prices.
In absolute terms, EBITDA declined relative to the first quarter of 2026, when it was $660.4 million. This matches the seasonal decline in volumes after a strong start to the year. A 57.0% margin is very high for a gold miner, and it is sensitive to prices: a 10% drop in prices could cut the margin by several percentage points.
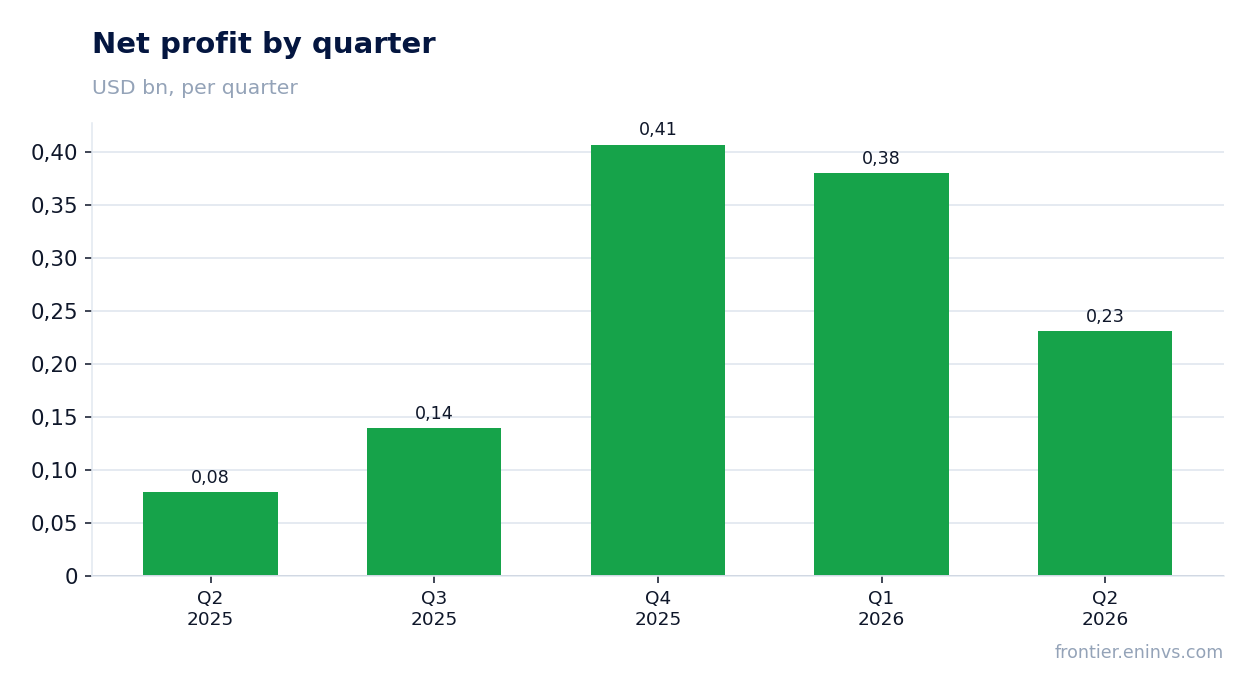
Net profit rose 192.9% to $230.5 million and almost all of it stayed in the business
Net profit in the second quarter of 2026 was $230.5 million, up 192.9% from a year earlier. The net margin rose to 26.9% from 13.5% a year earlier. Such profit growth on revenue that increased 47.5% is explained by faster EBITDA growth and, likely, lower financial expenses amid debt reduction.
Unlike EBITDA, net profit includes non-cash items and taxes. The company does not disclose one-off effects in the press release, so isolating them is not possible. However, profit nearly tripling on revenue growing by half points to strong operating leverage.
Operating cash flow of $445.1 million covers production growth, but free cash is limited
Operating cash flow in the second quarter of 2026 was $445.1 million, up 418.8% from a year earlier, when it was $85.8 million. This growth reflects higher EBITDA and, likely, improved working capital management. The company does not disclose capital expenditure in the press release, so free cash flow cannot be assessed.
Over the trailing twelve months, operating cash flow reached $1,997.5 million. This significantly exceeds debt servicing needs, as confirmed by negative net debt. However, without capex data, it is impossible to claim free cash flow is positive – production growth may require substantial investment.
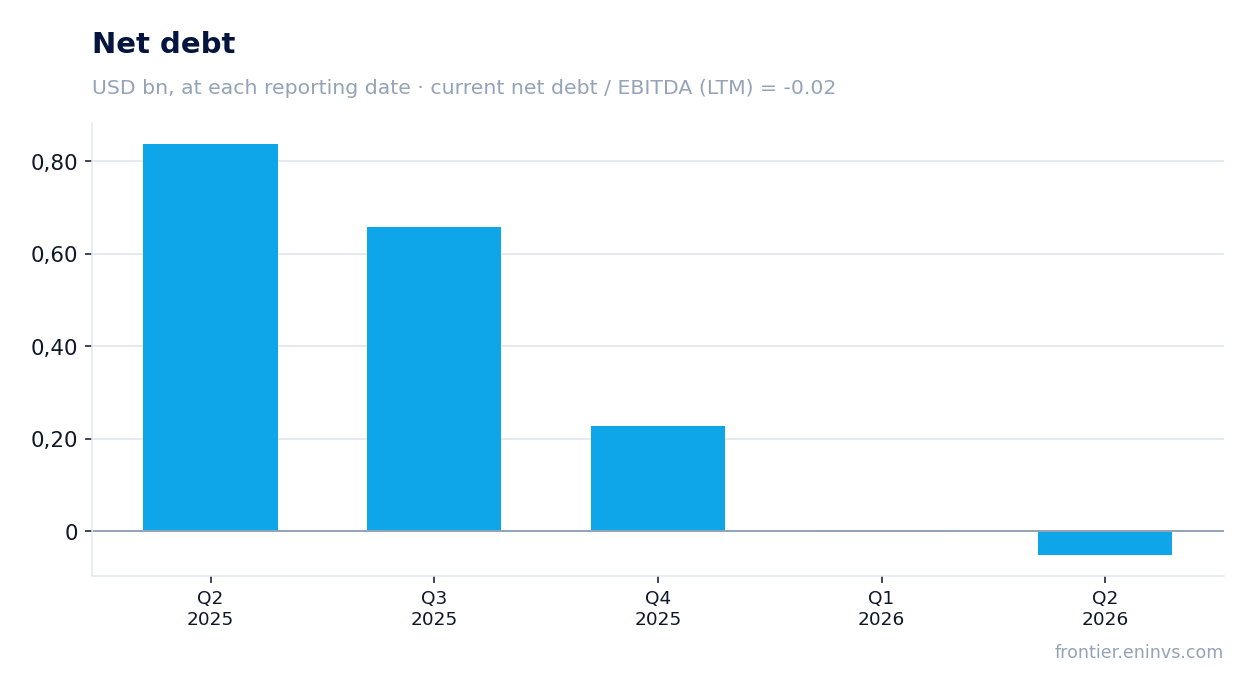
Net debt turned negative at -$52.1 million on June 30 versus $838.3 million a year earlier
As of June 30, 2026, net debt was -$52.1 million, meaning cash exceeds debt obligations. A year earlier, on June 30, 2025, net debt was $838.3 million. The reduction over 12 months was $890.4 million – the company directed a significant portion of operating cash flow to debt repayment.
The net debt to EBITDA ratio over the trailing twelve months is -0.02. This is a level, not a direction: the company has no debt burden and holds a net cash position. This provides financial flexibility but is not a profit driver.
At EV/EBITDA of 4.7 and P/E of 9.2 the stock trades below its own history, and the portal's model points to 49% upside
The trailing twelve-month EV/EBITDA is 4.7, and P/E is 9.2. Return on equity (ROE) is 21.1%. For a gold miner with negative net debt and growing revenue, these multiples look low. A comparison with its own three-year history is absent from the facts, so it cannot be claimed that the stock trades below or above its average.
According to the portal's model, which re-prices EBITDA at current commodity prices at a target EV/EBITDA, the stock's upside to fair value is 49%. This is our own estimate, not a market consensus. It relies on current gold prices persisting and the margin holding.
The next report will show whether the 57.0% margin holds at current gold prices
The key question for a holder is margin sustainability. In the second quarter of 2026, the EBITDA margin was 57.0%, 9.1 percentage points higher than a year earlier. This level was achieved at high gold prices. If prices decline, the margin could compress, and profit would fall faster than revenue.
In the next report, watch production and sales volumes, as well as capital expenditure. The company did not disclose capex in this press release, but production growth requires investment. It is also important whether IAMGOLD maintains negative net debt – a sign of financial health.
Valuation on the latest reported figures
| Metric | Value |
|---|---|
| Market cap | 10.6 bn USD |
| P/E (LTM) | 9.2 |
| EV/EBITDA (LTM) | 4.7 |
| P/B | 2.53 |
| Net debt / EBITDA (LTM) | -0.02 |
| Operating cash flow (LTM) | 2.00 bn |
| ROE | 21.1% |
Bottom line
The strong side of the report is revenue growth of 47.5% and EBITDA growth of 75.4% with a 57.0% margin, as well as negative net debt. However, the quarter is weaker than the previous one, and free cash flow is unknown due to missing capex data. At EV/EBITDA of 4.7 and P/E of 9.2, the stock is inexpensive, and the portal's model points to 49% upside. The key question is whether the 57.0% margin holds at current gold prices. Verdict: the stock looks attractive, but hinges on gold prices.
Open the company's financial profile IAG →
See also: market overview · valuation map · stock screeners