Imperial Oil: profit more than doubled, but the market pays almost 11x EBITDA – above its own history
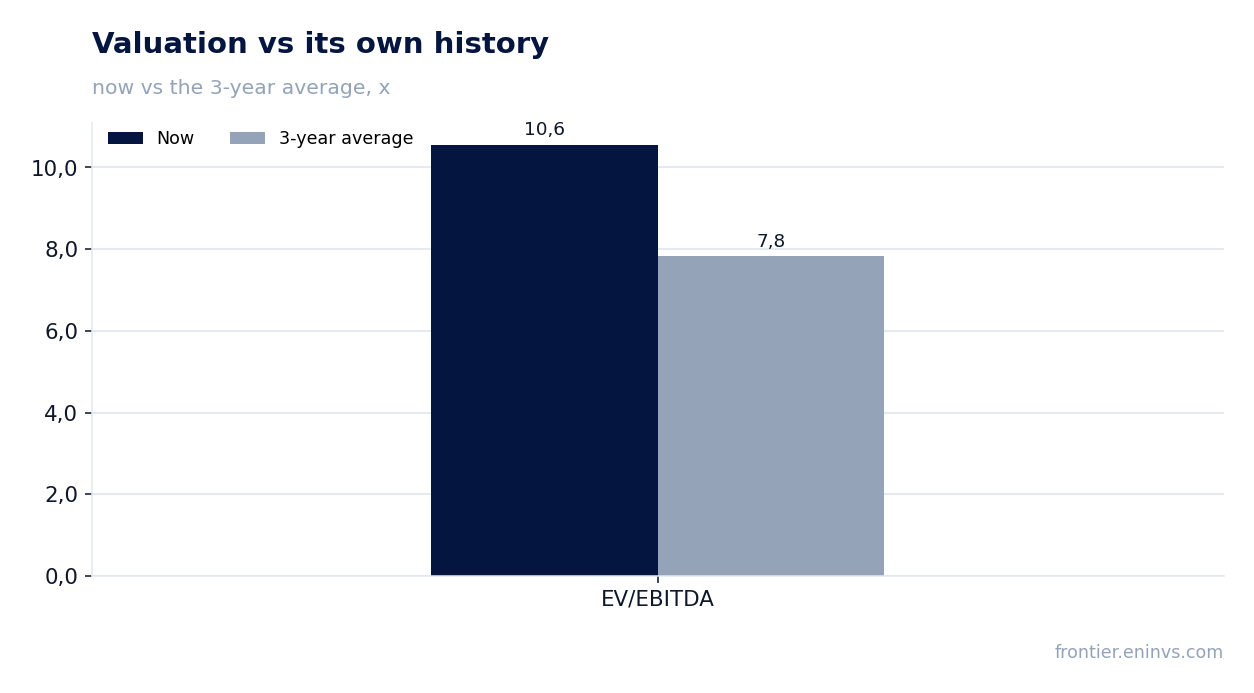
On 25 July Imperial Oil reported results for the second quarter of 2026. Revenue rose 46.0% year on year to USD 11,443.8 million, EBITDA – by 95.3% to USD 2,434.6 million, net profit – by 129.5% to USD 1,575.1 million. The EBITDA margin climbed to 21.3% from 15.9% a year earlier, and net debt at 30 June stood at USD 0.4 billion. Yet the stock trades at 10.6x EV/EBITDA against its own three-year average of 7.8 – a valuation above its history, and that is the main argument against buying at current levels.
Key takeaways
— Revenue rose 46.0% year on year to USD 11,443.8 million, but this is mostly a price effect, not volume growth
— EBITDA climbed 95.3% to USD 2,434.6 million, and the 21.3% margin is the best in recent quarters
— Net profit rose 129.5% to USD 1,575.1 million, but part of this growth may be one-off
— Net debt fell from USD 1.7 billion at 31 March to USD 0.4 billion at 30 June, and from USD 0.8 billion to USD 0.4 billion over the year
— Trailing dividend yield of 2.0% is modest for a company with such profitability and cash flow
— EV/EBITDA of 10.6x against a three-year average of 7.8 – the market already prices in sustained high prices
— The portal model implies +20% upside to fair value, but that is our estimate, not a consensus
Attractiveness
Key figures, USD bn
| Metric | Q2 2025 | Q2 2026 | Change |
|---|---|---|---|
| Revenue | 7.84 | 11.4 | +46.0% |
| EBITDA | 1.25 | 2.43 | +95.3% |
| Operating profit | 0.88 | 2.01 | +127.3% |
| Net profit | 0.69 | 1.58 | +129.5% |
| Operating cash flow | 1.06 | 1.94 | +83.6% |
| EBITDA margin | 15.9% | 21.3% | +5.4 pp |
| Net margin | 8.8% | 13.8% | +5.0 pp |
Revenue rose 46.0% year on year to USD 11,443.8 million, but this is mostly a price effect, not volume growth
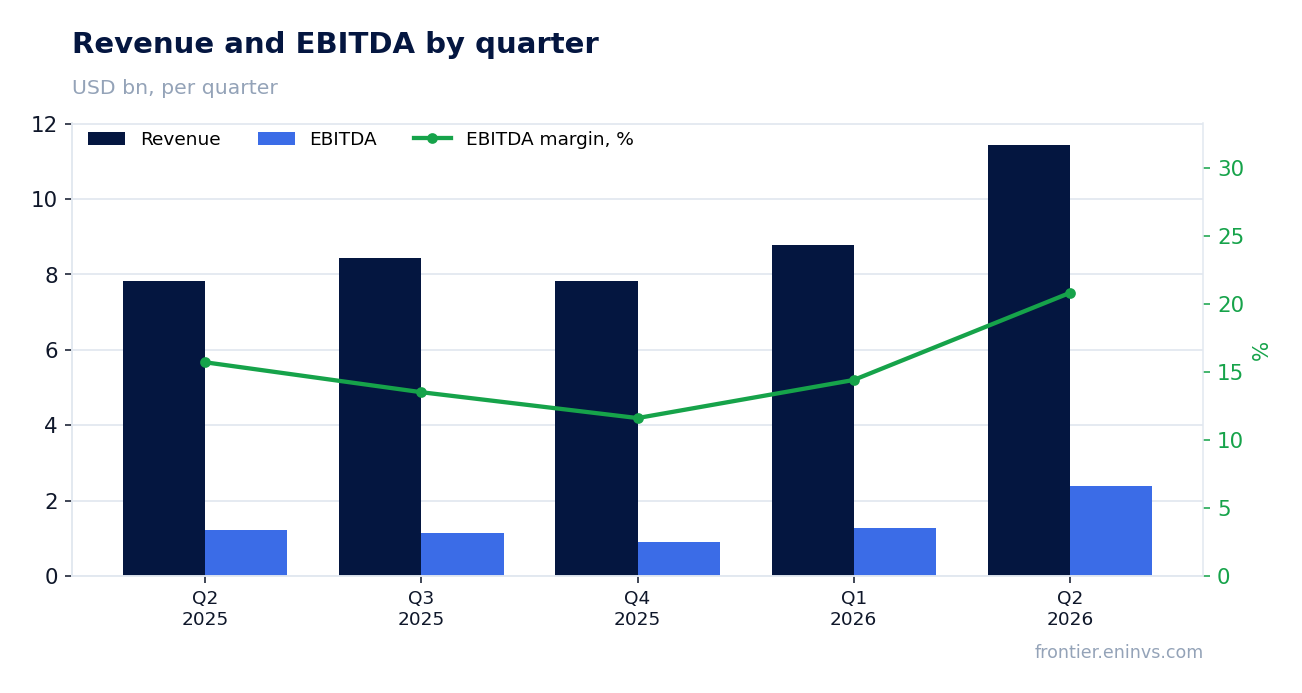
Revenue in the second quarter of 2026 was USD 11,443.8 million, up 46.0% from the second quarter of 2025. This is the highest quarterly figure in at least four quarters: in Q1 2026 revenue was USD 8,772.4 million, in Q4 2025 – USD 7,816.8 million. The growth is driven primarily by oil and refined product prices, which were significantly higher in the reporting period than a year earlier.
The company does not disclose production or refining volumes in the provided data, so it is impossible to separate the price and volume factors. However, the fact that revenue growth (46.0%) lags EBITDA growth (95.3%) indicates operating leverage: with relatively small or no increase in physical volumes, revenue rises on prices while costs remain relatively fixed.
For an investor, this means the current revenue level is sensitive to commodity prices. If prices roll back to last year's levels, revenue could return to USD 8–9 billion per quarter, and today's valuation multiples would look inflated.
EBITDA climbed 95.3% to USD 2,434.6 million, and the 21.3% margin is the best in recent quarters
EBITDA in Q2 2026 reached USD 2,434.6 million, up 95.3% from Q2 2025. The EBITDA margin rose to 21.3% from 15.9% a year earlier. This is the highest margin level in at least four quarters: in Q1 2026 it was around 14.4%, in Q4 2025 – around 11.6%.
This margin expansion is explained by revenue growing faster than costs. With revenue up 46.0%, operating expenses, judging by the EBITDA dynamics, increased only slightly. This is the classic operating leverage effect in a commodity company: when product prices rise, variable costs grow more slowly and fixed costs remain unchanged.
However, the sustainability of such a margin is questionable. If oil prices decline, the margin could quickly return to 2025 levels. In addition, part of the EBITDA growth may be related to one-off factors that the company does not disclose in the provided data.
Net profit rose 129.5% to USD 1,575.1 million, but part of this growth may be one-off
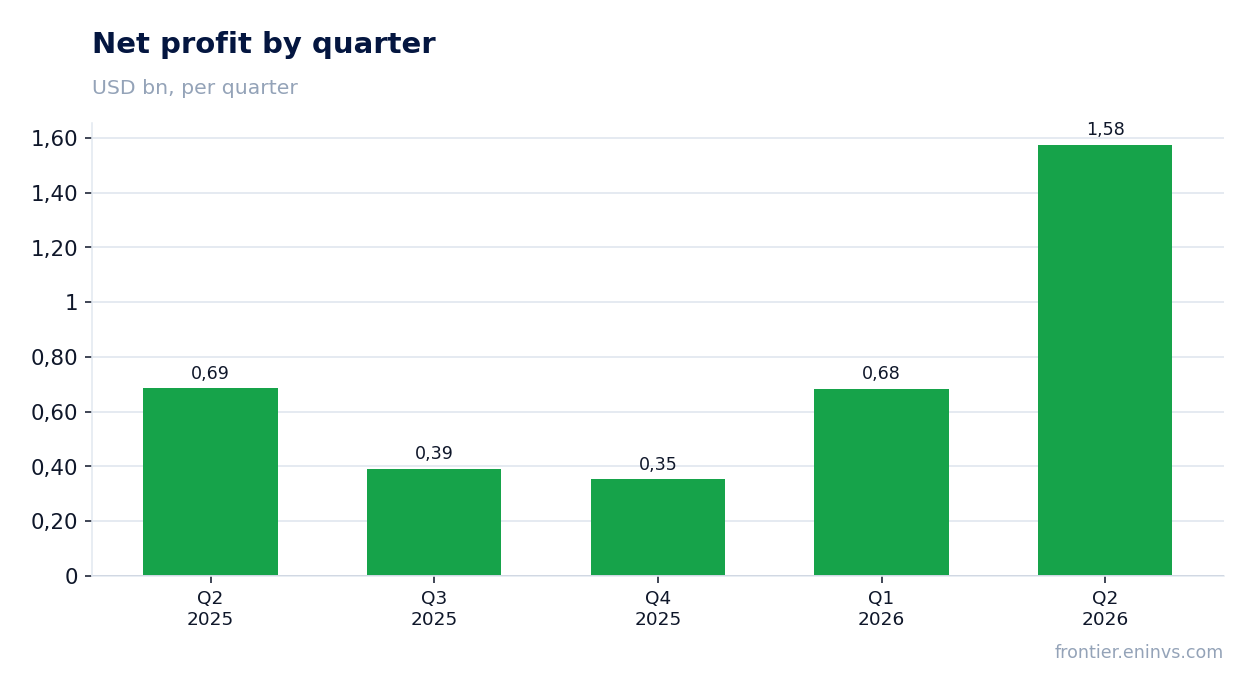
Net profit in Q2 2026 was USD 1,575.1 million, up 129.5% from Q2 2025. The net margin rose to 13.8% from 8.8% a year earlier. This is the highest quarterly profit figure in at least four quarters.
Profit growth outpaces EBITDA growth (129.5% vs 95.3%), which may indicate a lower effective tax rate, reduced interest expenses, or other below-the-line factors. The company does not disclose details, so it is impossible to say exactly what drove this outperformance.
For an investor, it is important that part of this growth may be one-off. If profit rose due to a lower tax rate or other non-operating factors, it could return to more modest levels next quarter. The sustainability of profit at USD 1.5 billion per quarter is questionable.
Net debt fell from USD 1.7 billion at 31 March to USD 0.4 billion at 30 June, and from USD 0.8 billion to USD 0.4 billion over the year
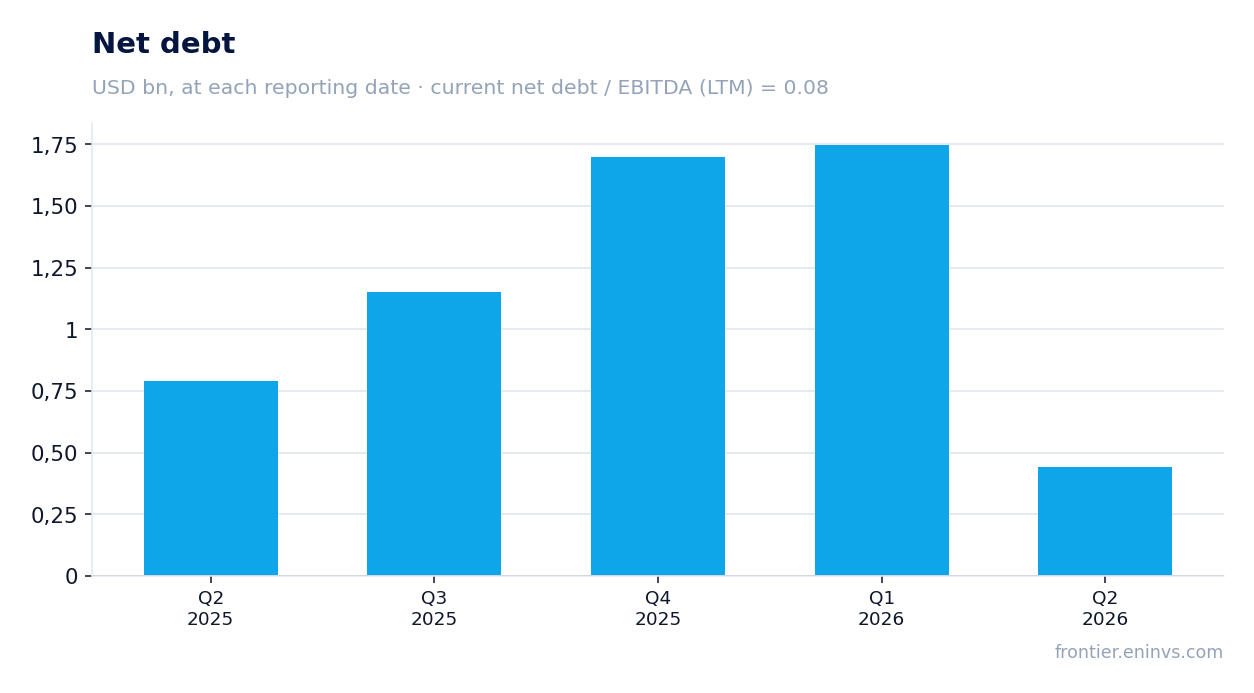
Net debt at 30 June 2026 was USD 0.4 billion. This is noticeably below the level at 31 March 2026 (USD 1.7 billion) and at 30 June 2025 (USD 0.8 billion). The decline over the quarter was USD 1.3 billion, over the year – USD 0.3 billion. The company directed a significant portion of operating cash flow to debt repayment.
Operating cash flow in Q2 2026 was USD 1,944.8 million, significantly above the Q1 level (USD 549.5 million) and Q2 2025 (USD 1,059.4 million). This flow more than covered capital expenditure needs, which the company does not disclose in the provided data, and allowed it to reduce debt.
The net debt to EBITDA ratio for the last 12 months is 0.08. This is a very low level, giving the company significant financial flexibility. However, comparing it with previous values is impossible, as the provided data does not contain earlier values of this ratio.
Trailing dividend yield of 2.0% is modest for a company with such profitability and cash flow
The dividend yield over the last 12 months is 2.0%. This is a modest level for a company that generates operating cash flow of USD 5,177.0 million over the last 12 months and has net profit of USD 3,003.0 million over the same period. The company pays out only a small portion of its profit as dividends.
Our estimate of the dividend for the current year is based on the current profit trajectory and the historical payout ratio. If the company maintains the current payout level, the dividend for 2026 may be close to last year's level. However, this estimate is ours, and it depends on whether profit remains at the current level and whether additional capital expenditure is required.
A yield of 2.0% looks low against the key rate, which in the US remains above 4%. For an income-oriented investor, this is not an attractive level. The dividend could be increased if the company decides to raise the payout ratio, but there are few prerequisites for this so far.
EV/EBITDA of 10.6x against a three-year average of 7.8 – the market already prices in sustained high prices
The current EV/EBITDA multiple is 10.6x, above its own three-year average of 7.8x. This means the market values the company more expensively than on average over the last three years. Such a premium can only be justified by sustained high oil and refined product prices.
The P/E multiple for the last 12 months is 19.8x. This is also a high level, suggesting investors expect profit to remain at current levels or grow. If profit returns to 2025 levels, the multiple could rise even further, making the stock less attractive.
According to the portal model, which re-prices EBITDA at current commodity prices at the target EV/EBITDA, the upside to fair value is +20%. This is our own estimate, not a market consensus. It shows that even at current high commodity prices, the stock may have some upside, but it is limited.
The portal model implies +20% upside to fair value, but that is our estimate, not a consensus
Our model, which re-prices EBITDA at current commodity prices at the target EV/EBITDA multiple, shows +20% upside to fair value. This means that at current oil and gas prices, the stock may be undervalued by 20% relative to our estimate.
However, this calculation is sensitive to two parameters: commodity prices and the target multiple. If oil prices decline, fair value will also decline. If the market values the company at a lower multiple, the upside will shrink. We use a target multiple that we consider justified, but it may differ from the market's.
It is important to understand that this is not a buy or sell recommendation, but merely an estimate of fair value based on our model. The investor must decide whether such upside matches their risk and return expectations.
Valuation on the latest reported figures
| Metric | Value |
|---|---|
| Market cap | 59.5 bn USD |
| P/E (LTM) | 19.8 |
| EV/EBITDA (LTM) | 10.6 |
| P/B | 3.66 |
| Net debt / EBITDA (LTM) | 0.08 |
| Operating cash flow (LTM) | 5.18 bn |
| ROE | 37.5% |
| Dividend yield (12m) | 2.0% |
| EV/EBITDA, 3-year average | 7.8 |
Bottom line
Bottom line: Imperial Oil delivered very strong results for Q2 2026. Revenue rose 46.0%, EBITDA – 95.3%, net profit – 129.5%. The company reduced net debt to USD 0.4 billion and has a very low net debt to EBITDA ratio of 0.08. However, these results are largely driven by high commodity prices, and their sustainability is questionable. The EV/EBITDA valuation of 10.6x is above its own three-year average of 7.8, which limits upside. The dividend yield of 2.0% is modest. Our model implies +20% upside, but that is our estimate. Given all this, we rate the stock as neutral: strong current results are already priced in, and the risks of falling oil prices are high.
Open the company's financial profile IMO →
See also: market overview · valuation map · stock screeners