International Petroleum: revenue up 20.8%, but profit and margin fell back to last year's levels
On 13 August International Petroleum released its Q2 2026 results. Revenue rose 20.8% year-on-year to USD 218.1 million, EBITDA fell 11.4% to USD 53.3 million, and net profit dropped 28.4% to USD 9.9 million. Revenue growth did not translate into profit: the EBITDA margin compressed from 33.3% to 24.4%, and the net margin from 7.7% to 4.5%. Meanwhile, net debt over 12 months rose from USD 0.4 billion to USD 0.5 billion, and EV/EBITDA LTM of 13.5x is more than double its own three-year average of 6.6x. The share looks unattractive at current levels: the market has already priced in a margin recovery that the report does not yet show.
Key takeaways
— Revenue rose 20.8% year-on-year, but EBITDA fell 11.4% – growth did not reach profit
— EBITDA margin compressed from 33.3% to 24.4%, net margin from 7.7% to 4.5%
— Net debt over 12 months rose from USD 0.4 billion to USD 0.5 billion; net debt/EBITDA LTM stands at 2.14
— EV/EBITDA LTM of 13.5x is more than double its own three-year average of 6.6x
— Operating cash flow for the quarter was USD 49.2 million, USD 4.1 million below EBITDA
— On the portal's model, the share is valued 15% above fair value
— Return on equity is 4.4% – profit does not cover the cost of capital
Attractiveness
Key figures, USD bn
| Metric | Q2 2025 | Q2 2026 | Change |
|---|---|---|---|
| Revenue | 0.18 | 0.22 | +20.8% |
| EBITDA | 0.06 | 0.05 | -11.4% |
| Operating profit | 0.02 | 0.03 | +91.8% |
| Net profit | 0.01 | 0.01 | -28.4% |
| Operating cash flow | 0.07 | 0.05 | -32.6% |
| EBITDA margin | 33.3% | 24.4% | -8.9 pp |
| Net margin | 7.7% | 4.5% | -3.2 pp |
Revenue rose 20.8% year-on-year, but EBITDA fell 11.4% – growth did not reach profit
Revenue in Q2 2026 was USD 218.1 million, up 20.8% year-on-year. This is a marked acceleration from Q1 2026, when revenue declined 5.2% year-on-year. However, sales growth was not accompanied by profit growth: EBITDA fell 11.4% to USD 53.3 million, while operating profit rose from USD 15.5 million to USD 29.7 million – operating profit grew, but EBITDA fell, indicating higher depreciation or one-off write-offs.
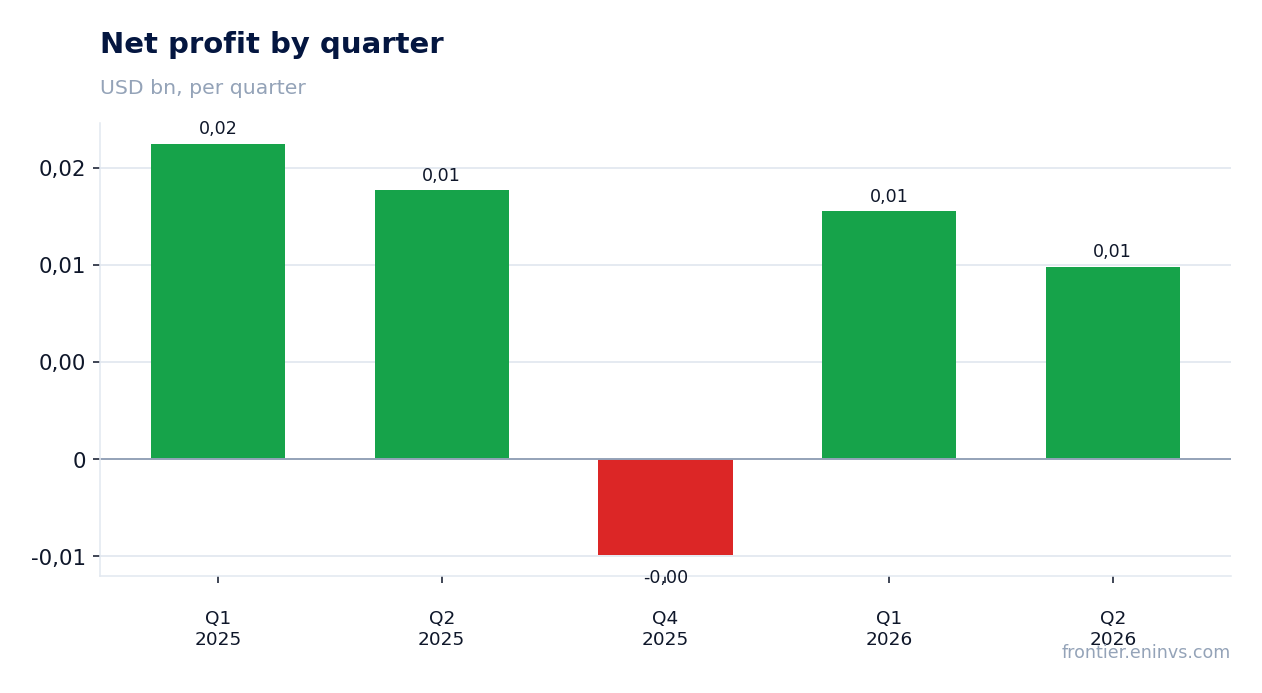
Net profit fell 28.4% to USD 9.9 million. The gap between revenue and profit dynamics is explained by the fact that revenue growth was not matched by proportional gross profit growth: cost of sales grew faster. This could be due to higher production costs or a change in sales mix, but the report does not disclose specific reasons. Importantly, operating profit rose while net profit fell, pointing to higher financial expenses or tax burden.
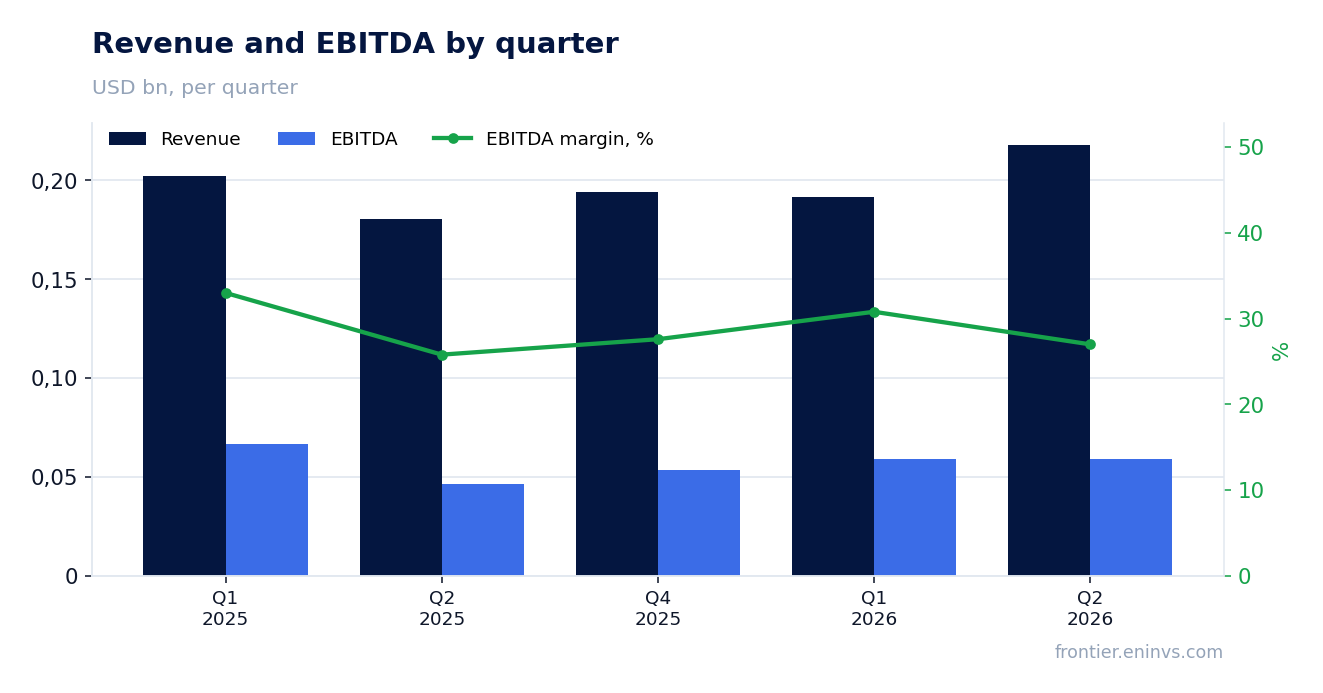
EBITDA margin compressed from 33.3% to 24.4%, net margin from 7.7% to 4.5%
EBITDA margin in Q2 2026 was 24.4% versus 33.3% a year earlier. A decline of almost 9 percentage points is a significant deterioration, indicating that revenue growth was accompanied by even faster growth in operating costs. Net margin fell from 7.7% to 4.5%, meaning the business's profitability dropped by more than one and a half times.
Margin compression is the key negative signal from the report. If last year the company earned 33.3 cents of EBITDA per dollar of revenue, now it earns only 24.4 cents. This could be due to higher energy, logistics costs, or lower selling prices. Without a breakdown of costs, the exact cause is unclear, but the fact of margin compression means that operating leverage is working against the company: revenue grows, but profit falls.
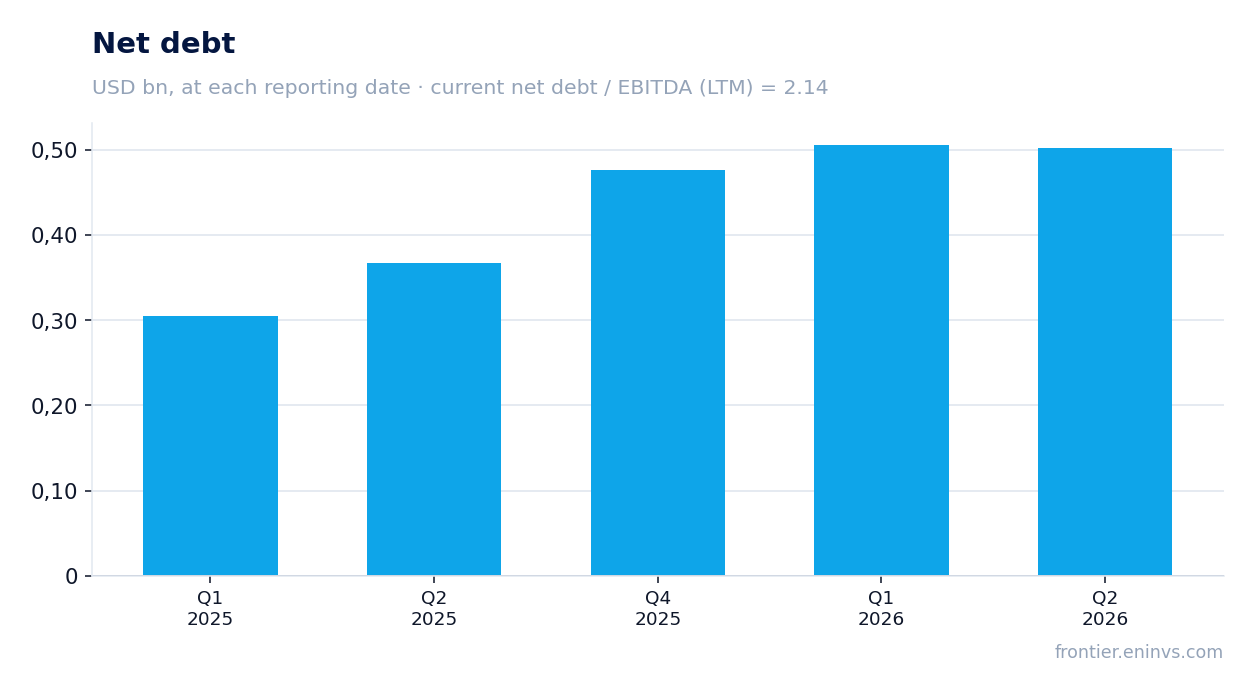
Net debt over 12 months rose from USD 0.4 billion to USD 0.5 billion; net debt/EBITDA LTM stands at 2.14
Net debt as of 30 June 2026 was USD 0.5 billion. Over 12 months it rose from USD 0.4 billion on 30 June 2025 to USD 0.5 billion on 30 June 2026, an increase of USD 0.1 billion. The net debt/EBITDA ratio for the trailing twelve months is 2.14. This is a moderate level of leverage, but it requires monitoring, especially against falling EBITDA.
Rising debt with falling EBITDA is a worrying combination. If EBITDA continues to decline, the ratio could rise even without additional borrowing. Operating cash flow for the quarter was USD 49.2 million, USD 4.1 million below EBITDA, meaning the company does not fully convert profit into cash. This limits its ability to reduce debt.
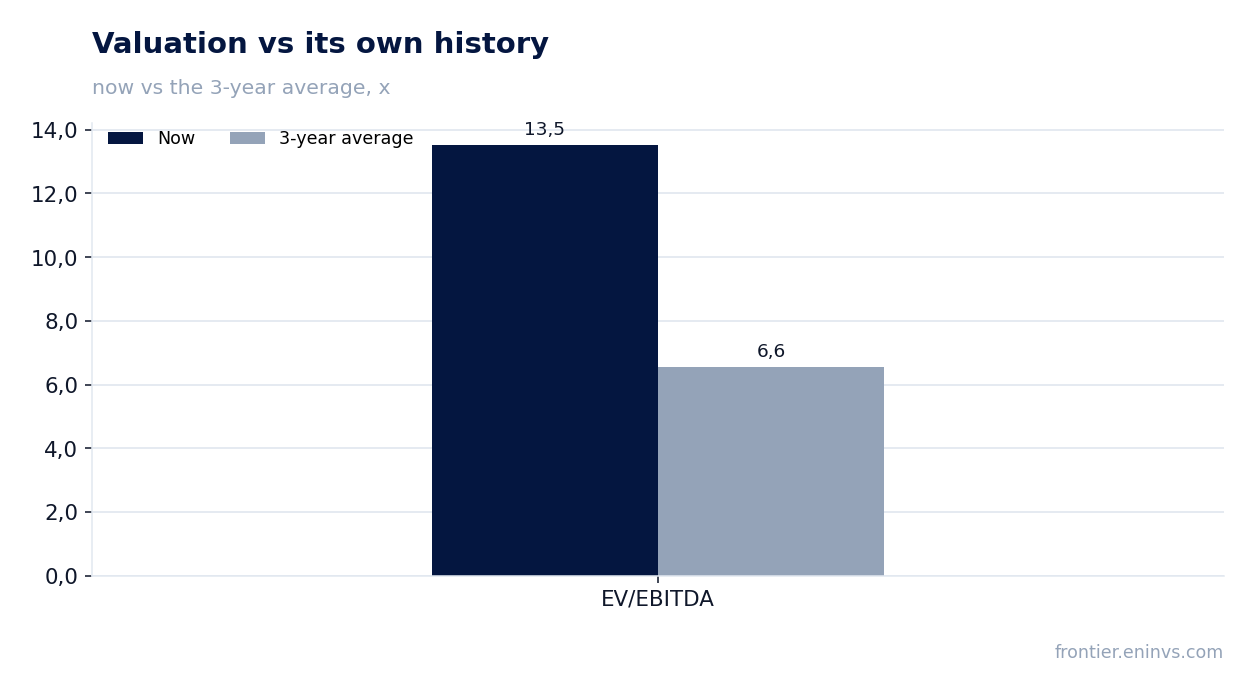
EV/EBITDA LTM of 13.5x is more than double its own three-year average of 6.6x
The current EV/EBITDA LTM is 13.5x. This is more than double its own three-year average of 6.6x. The share trades at a significant premium to its historical valuation, implying market expectations of profit recovery. However, the Q2 report does not show signs of such a recovery: EBITDA is falling, margin is compressing.
P/E LTM is 108.1x, reflecting extremely low profit over the last 12 months – USD 25.0 million. Return on equity is 4.4%, below the cost of capital for most companies. Such a valuation does not look justified against current dynamics. On the portal's model, the share is valued 15% above fair value, confirming overvaluation.
Operating cash flow for the quarter was USD 49.2 million, USD 4.1 million below EBITDA
Operating cash flow in Q2 2026 was USD 49.2 million. This is USD 4.1 million less than EBITDA, indicating that part of the profit is not converted into cash. For a capital-intensive business, this could be due to working capital growth or taxes and interest paid.
Over the last 12 months, operating cash flow was USD 170.2 million. Capital expenditures are not disclosed in the provided data, which prevents assessing free cash flow. However, the fact that OCF is below EBITDA means the company does not generate enough funds to quickly reduce debt. This limits opportunities for dividends or deleveraging.
On the portal's model, the share is valued 15% above fair value
On the portal's model, which reprices EBITDA at current commodity prices at the target EV/EBITDA, the share is valued 15% above fair value. This is the portal's own estimate, not market consensus. It takes into account current commodity prices and assumes the multiple returns to the target level.
The company's market capitalisation is USD 2.7 billion. With current LTM EBITDA of USD 234.9 million and EV/EBITDA of 13.5x, the market values the company significantly above its historical multiples. If profit does not recover, the share could face further pressure.
Return on equity is 4.4% – profit does not cover the cost of capital
Return on equity (ROE) is 4.4%. This is a low figure, indicating that the company generates insufficient profit relative to equity. For an investor, this means the business does not create value if the cost of capital is above this level.
Low ROE combined with a high EV/EBITDA valuation and falling margin creates an unfavourable picture. The company operates in a capital-intensive industry where significant investment is required to grow profit. As long as profitability remains at this level, the share is unlikely to be attractive to long-term investors.
Valuation on the latest reported figures
| Metric | Value |
|---|---|
| Market cap | 2.70 bn USD |
| P/E (LTM) | 108.1 |
| EV/EBITDA (LTM) | 13.5 |
| P/B | 2.92 |
| Net debt / EBITDA (LTM) | 2.14 |
| Operating cash flow (LTM) | 0.17 bn |
| ROE | 4.4% |
| EV/EBITDA, 3-year average | 6.6 |
Bottom line
Bottom line: International Petroleum's revenue rose 20.8% year-on-year, but this did not translate into profit – EBITDA fell 11.4%, net profit dropped 28.4%, and the margin compressed from 33.3% to 24.4%. Revenue growth is not converting into cash: operating cash flow for the quarter was USD 4.1 million below EBITDA. Debt over 12 months rose from USD 0.4 billion to USD 0.5 billion, and the EV/EBITDA valuation of 13.5x is more than double its own three-year average of 6.6x. On the portal's model, the share is valued 15% above fair value. The verdict is unattractive: the market is pricing in a margin recovery that the report does not show.
Open the company's financial profile IPCO →
See also: market overview · valuation map · stock screeners