Ivanhoe Mines: revenue up 57.7% but profit up only 12.9% as margin compressed
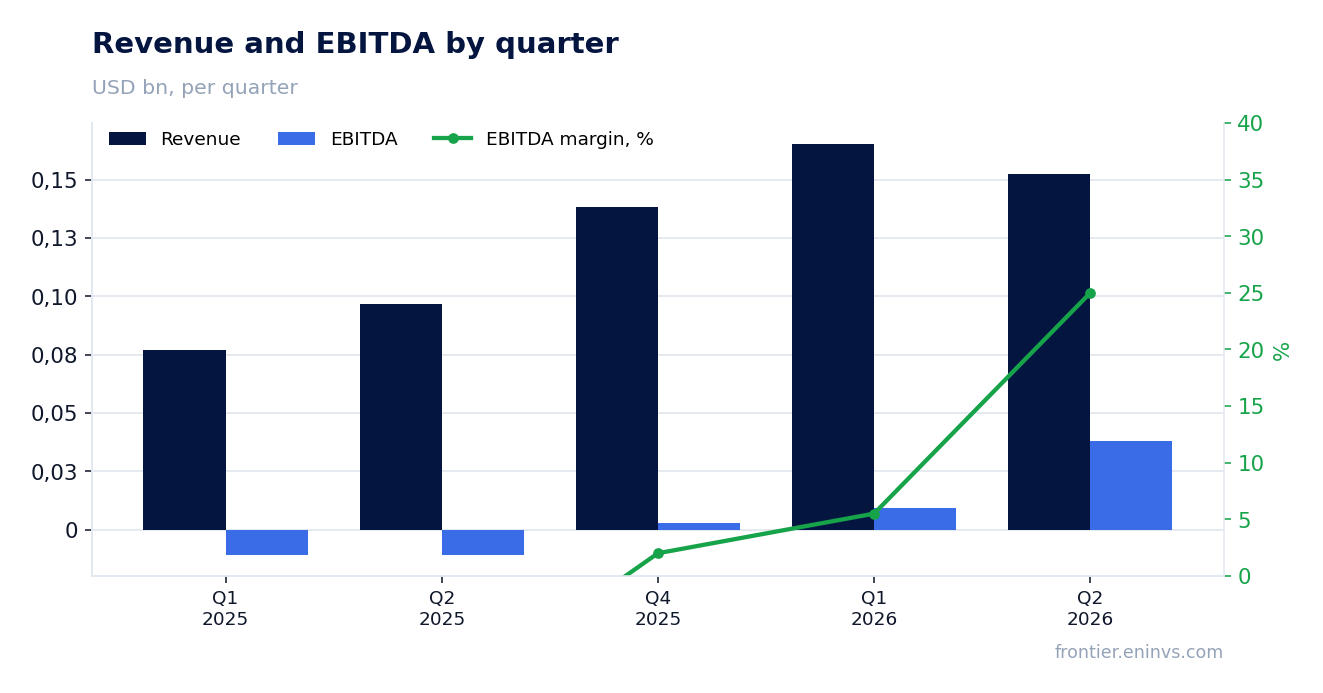
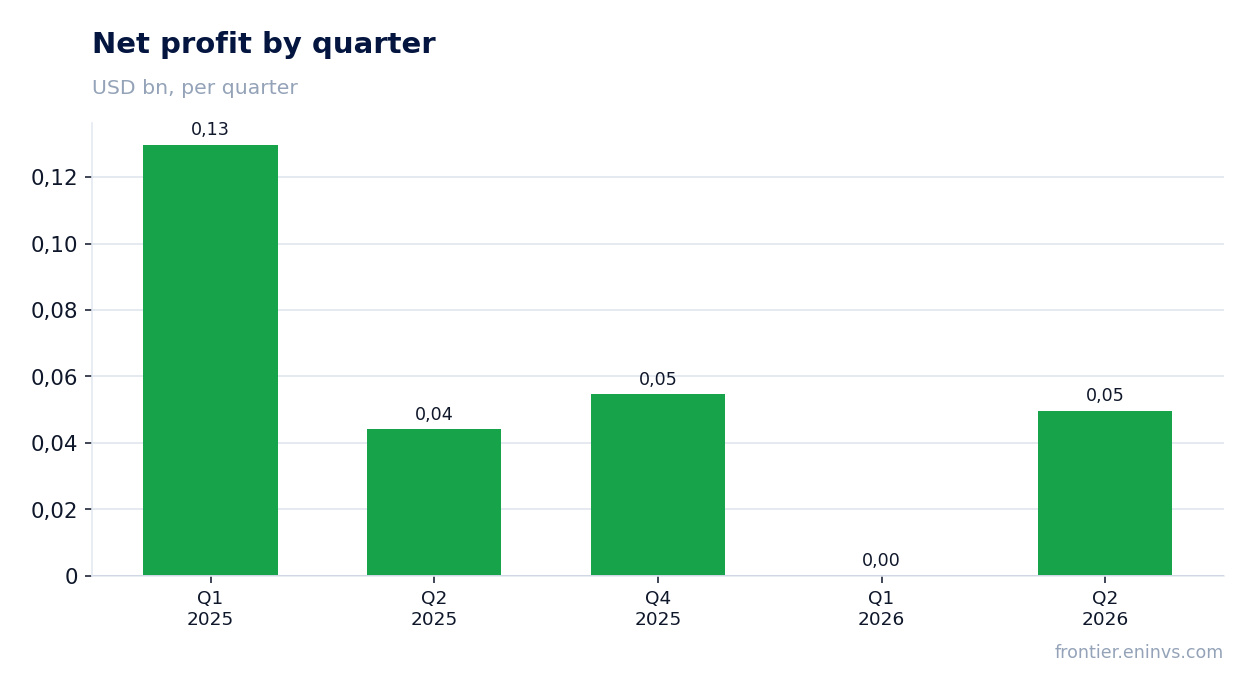
On August 29, Ivanhoe Mines released its second-quarter 2026 results. Revenue rose 57.7% year on year to $152.6 million, EBITDA jumped 107.2% to $76.6 million, but net profit increased only 12.9% to $49.7 million. The EBITDA margin widened to 50.2%, while the net margin fell to 32.6% from 45.5% a year earlier. The shares look neutral: revenue growth decelerated from the first quarter, and leverage remains high with EV/EBITDA at 394.8.
Key takeaways
— Revenue grew 57.7% year on year, but this is a deceleration from 114.9% in the first quarter
— EBITDA jumped 107.2%, and its margin widened to 50.2% from 38.2%
— Net profit added only 12.9%, and the net margin compressed to 32.6% from 45.5%
— Operating cash flow in the second quarter was $45.6 million, but over the last 12 months it is negative at -$82.3 million
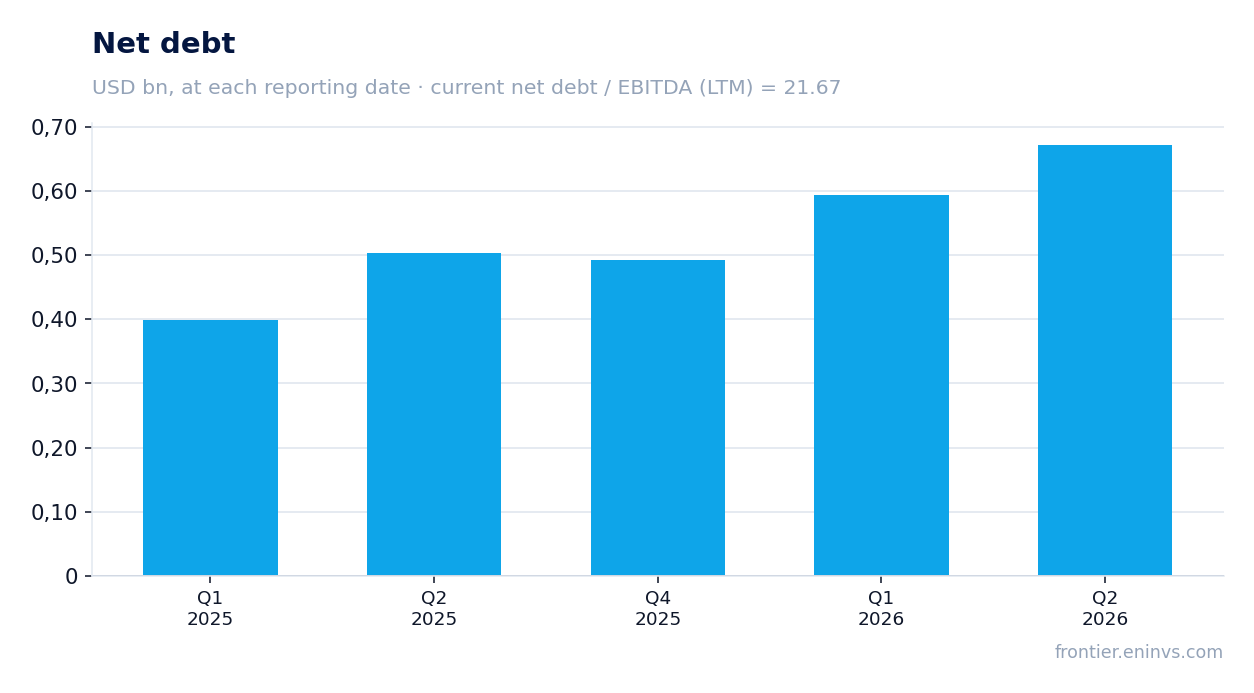
— Net debt rose to $671.8 million on June 30, 2026, from $593.6 million on March 31
— The net debt/EBITDA LTM ratio stands at 21.67 – this is a level, not a trend
— Valuation at EV/EBITDA LTM of 394.8 and P/E LTM of 44.0 leaves no room for error
Attractiveness
Key figures, USD bn
| Metric | Q2 2025 | Q2 2026 | Change |
|---|---|---|---|
| Revenue | 0.10 | 0.15 | +57.7% |
| EBITDA | 0.04 | 0.08 | +107.2% |
| Operating profit | -0.03 | 0.01 | to profit |
| Net profit | 0.04 | 0.05 | +12.9% |
| Operating cash flow | 0.00 | 0.05 | +9462.3% |
| EBITDA margin | 38.2% | 50.2% | +12.0 pp |
| Net margin | 45.5% | 32.6% | -12.9 pp |
Revenue grew 57.7% year on year, but this is a deceleration from 114.9% in the first quarter
In the second quarter of 2026, revenue was $152.6 million, up 57.7% year on year. However, in the first quarter growth was 114.9%, meaning the dynamics decelerated. The slowdown may reflect a high base effect or a possible decline in volumes or prices, but the exact cause is not specified in the provided data.
A sequential comparison with the first quarter of 2026 shows a 7.8% decline in revenue ($165.5 million in Q1 vs. $152.6 million in Q2). This could indicate seasonality or one-off factors, but without additional information it is premature to draw conclusions.
Nevertheless, annual growth remains significant, and the company continues to increase revenue in absolute terms compared to last year.
EBITDA jumped 107.2%, and its margin widened to 50.2% from 38.2%
EBITDA in the second quarter of 2026 reached $76.6 million, up 107.2% year on year. The EBITDA margin rose to 50.2% from 38.2% in the same period last year. Such margin growth may be associated with cost control or a change in revenue structure, but the specific drivers are not disclosed in the data.
The margin improvement of 12 percentage points is a significant result, indicating increased operational efficiency. However, without a breakdown of cost items, it is difficult to assess the sustainability of this improvement.
It is worth noting that EBITDA growth outpaces revenue growth, indicating positive operating leverage.
Net profit added only 12.9%, and the net margin compressed to 32.6% from 45.5%
Net profit in the second quarter of 2026 was $49.7 million, up only 12.9% year on year. At the same time, the net margin fell to 32.6% from 45.5% a year earlier. This divergence from EBITDA dynamics indicates rising expenses below the operating line – possibly higher interest payments or taxes.
Operating profit in the second quarter was $11.2 million, significantly lower than EBITDA, indicating substantial depreciation or other non-cash expenses. This may also explain the gap between EBITDA and net profit.
The decline in net margin despite revenue and EBITDA growth is a warning signal that requires further analysis of the cost structure.
Operating cash flow in the second quarter was $45.6 million, but over the last 12 months it is negative at -$82.3 million
In the second quarter of 2026, operating cash flow was positive at $45.6 million. This is an improvement from the first quarter, when the flow was negative at -$71.3 million. However, over the last 12 months, operating cash flow remains negative at -$82.3 million.
Negative operating cash flow for the year despite positive net profit may indicate significant non-cash items or changes in working capital. Without a detailed cash flow statement, it is difficult to determine the cause.
The company did not disclose capital expenditure data, so it is impossible to assess how much is directed to investments and how this affects free cash flow.
Net debt rose to $671.8 million on June 30, 2026, from $593.6 million on March 31
Net debt as of June 30, 2026, was $671.8 million, an increase of $78.2 million from $593.6 million on March 31, 2026. Over 12 months, net debt increased by $169.4 million: from $502.4 million on June 30, 2025, to $671.8 million on June 30, 2026.
The net debt/EBITDA LTM ratio is 21.67. This is a high level, indicating significant debt burden relative to current EBITDA. However, we do not have data on the previous value of this ratio, so we cannot state whether the burden has increased or decreased.
The rise in net debt amid negative operating cash flow over the last 12 months raises questions about the company's ability to service debt through operating activities.
The net debt/EBITDA LTM ratio stands at 21.67 – this is a level, not a trend
As of June 30, 2026, the net debt/EBITDA LTM ratio is 21.67. This is a very high figure, indicating that debt burden significantly exceeds current EBITDA. For comparison, a comfortable level is usually considered 2-3x, but here we are talking about a mining company at an investment stage.
We do not have data on the previous value of this ratio, so we cannot judge the direction of its change. However, the level of 21.67 itself indicates increased risk.
High debt burden limits financial flexibility and may require additional financing or restructuring.
Valuation at EV/EBITDA LTM of 394.8 and P/E LTM of 44.0 leaves no room for error
EV/EBITDA LTM is 394.8, which is an extremely high level. P/E LTM is 44.0. Such multiples imply significant future growth, and any slowdown could lead to a revaluation.
We do not have data on the average values of these multiples over the last three years, so we cannot compare the current level with the historical one. However, the absolute values appear inflated relative to current financial performance.
Market capitalisation is $11.8 billion, significantly exceeding annual revenue ($497.5 million over the last 12 months). This reflects market expectations related to the company's future projects.
Valuation on the latest reported figures
| Metric | Value |
|---|---|
| Market cap | 11.8 bn USD |
| P/E (LTM) | 44.0 |
| EV/EBITDA (LTM) | 394.8 |
| P/B | 1.99 |
| Net debt / EBITDA (LTM) | 21.67 |
| Operating cash flow (LTM) | -0.08 bn |
| ROE | 3.4% |
Bottom line
The strong point of the report was EBITDA growth of 107.2% and margin expansion to 50.2%. However, net profit rose only 12.9%, and the net margin compressed to 32.6%, indicating rising expenses below the operating line. Operating cash flow over the last 12 months remains negative, and net debt rose to $671.8 million. Valuation at EV/EBITDA of 394.8 leaves no room for error. The shares look neutral: current multiples already price in significant future growth, but additional data are needed to confirm the company's sustainability.
Open the company's financial profile IVN →
See also: market overview · valuation map · stock screeners