Keyera: profit tripled, but the entire quarterly EBITDA gain was consumed by interest and capex
On 25 August Keyera released its results for the second quarter of 2026. Revenue rose 48.6% year on year to USD 1.73bn, EBITDA by 89.5% to USD 428.2m, and net profit by 142.0% to USD 221.4m. The EBITDA margin climbed to 24.8% from 19.4%, and the net margin to 12.8% from 7.9%. Yet operating cash flow for the quarter was negative at minus USD 222.0m, and net debt at end-June stood at USD 5.3bn against USD 2.6bn on 31 March. On multiples the stock trades above its own three-year history, and the portal's model implies 36% downside to fair value, so at the current price the share looks rather unattractive.
Key takeaways
— Revenue rose 48.6% year on year, the strongest quarterly result in four quarters
— EBITDA added 89.5%, but the 24.8% margin is still below the level that justifies the current valuation
— Net profit rose 142.0%, yet operating cash flow turned negative at minus USD 222.0m
— Net debt rose from USD 2.6bn on 31 March to USD 5.3bn on 30 June, the main risk in the report
— EV/EBITDA of 18.3 against its own three-year average of 12.4 – the stock trades above its history
— Dividend yield of 4.25% with a payout ratio that may come under pressure from the debt load
— The portal's model implies 36% downside to fair value, which outweighs the strong report
Attractiveness
Key figures, USD bn
| Metric | Q2 2025 | Q2 2026 | Change |
|---|---|---|---|
| Revenue | 1.16 | 1.73 | +48.6% |
| EBITDA | 0.23 | 0.43 | +89.5% |
| Operating profit | 0.16 | 0.33 | +102.3% |
| Net profit | 0.09 | 0.22 | +142.0% |
| Operating cash flow | 0.11 | -0.22 | -310.5% |
| EBITDA margin | 19.4% | 24.8% | +5.4 pp |
| Net margin | 7.9% | 12.8% | +4.9 pp |
Revenue rose 48.6% year on year, the strongest quarterly result in four quarters
In the second quarter of 2026, Keyera's revenue reached USD 1,728.8m, up 48.6% year on year. This is the highest quarterly figure in four quarters: in Q1 2026 revenue was USD 945.5m, in Q4 2025 – USD 1,218.4m, in Q3 2025 – USD 1,297.8m. Growth accelerated compared with previous periods, when revenue fluctuated between USD 0.9bn and USD 1.3bn.
Such a jump in revenue is likely linked to a recovery in processing and transportation volumes after a weak first quarter, when the figure fell to USD 945.5m. However, without access to the operational details of the report, the exact cause cannot be identified. Importantly, the revenue growth is not accompanied by a proportional increase in cash flow, which points to a possible build-up in working capital or one-off factors.
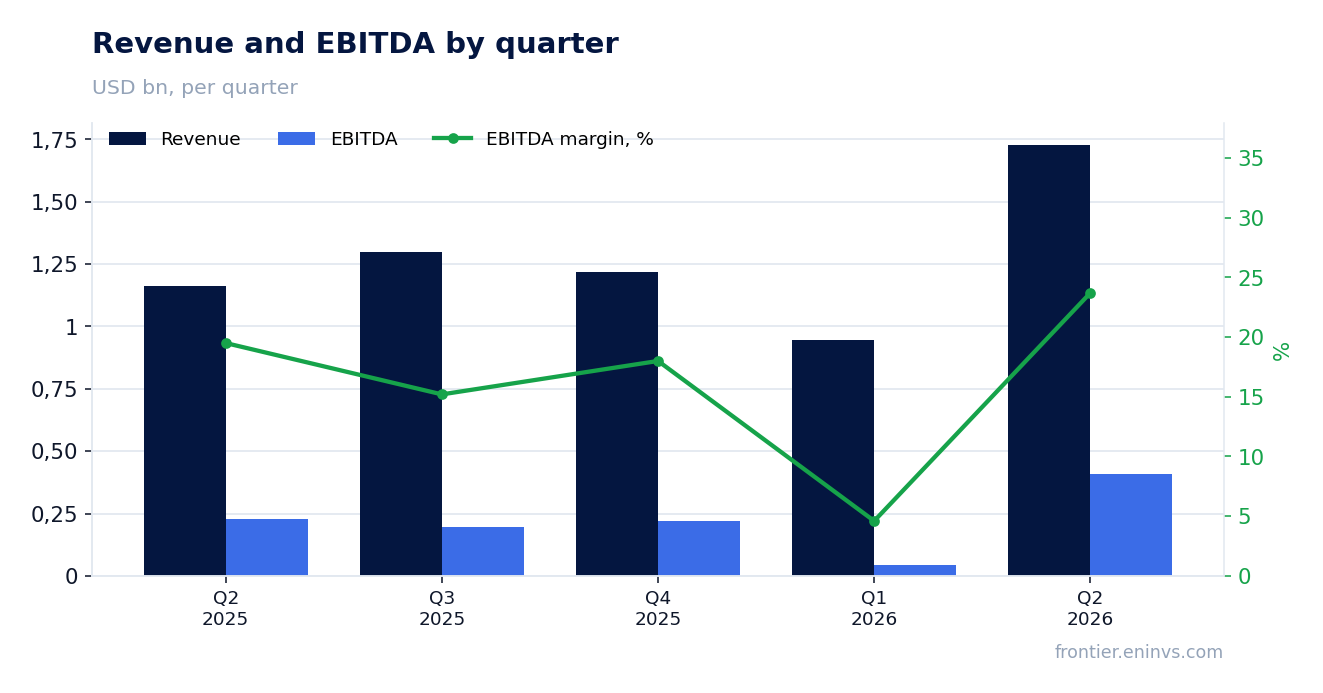
EBITDA added 89.5%, but the 24.8% margin is still below the level that justifies the current valuation
EBITDA in Q2 2026 was USD 428.2m, up 89.5% year on year. The EBITDA margin rose to 24.8% from 19.4% a year earlier. This is a notable improvement, but the margin is still far from the levels that typically justify high multiples. For comparison, in Q1 2026 EBITDA was only USD 43.2m, giving a margin of about 4.6%.
EBITDA growth outpaces revenue growth, indicating positive operating leverage. However, part of this growth may be due to one-off factors, as operating profit rose to USD 325.5m and net profit to USD 221.4m. Without segment detail, it is difficult to assess the sustainability of such a margin. Nevertheless, the current profitability level is significantly better than in previous quarters, when EBITDA fluctuated between USD 196m and USD 227m.
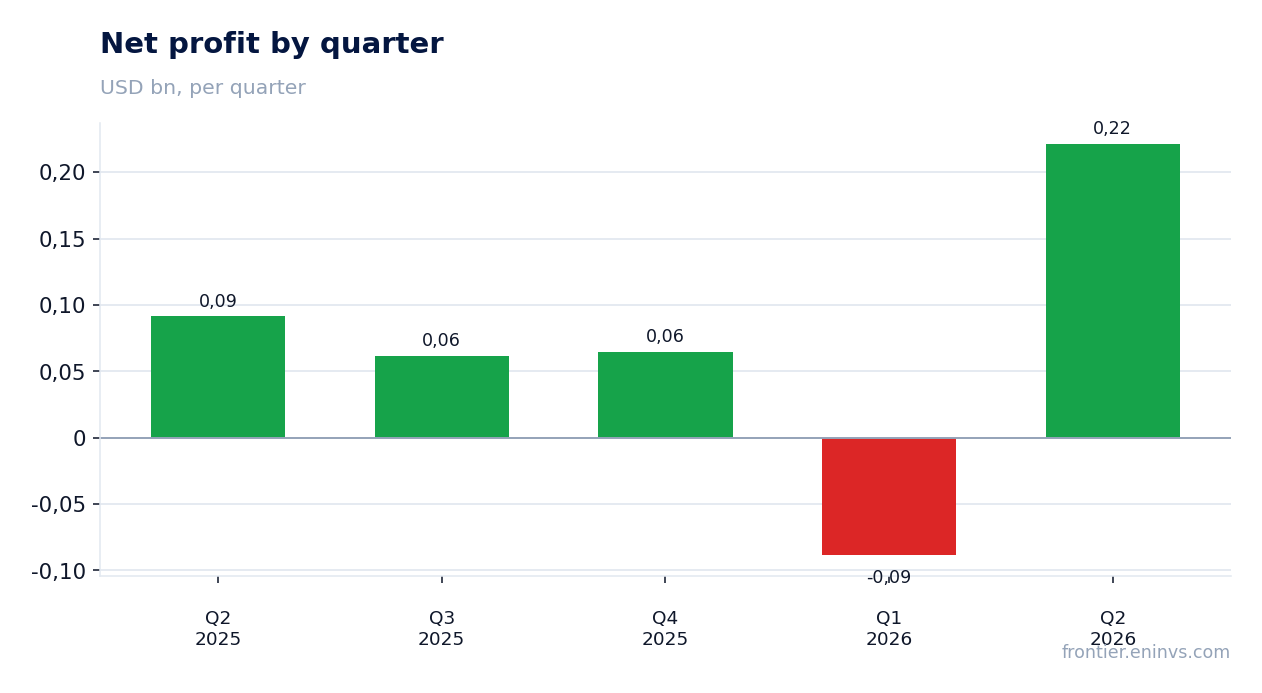
Net profit rose 142.0%, yet operating cash flow turned negative at minus USD 222.0m
Net profit in Q2 2026 was USD 221.4m, up 142.0% year on year. The net margin rose to 12.8% from 7.9%. However, operating cash flow for the same period was negative at minus USD 222.0m. This is a sharp contrast to the profit and indicates that profit growth is not converting into cash.
Negative operating cash flow may be linked to an increase in working capital, such as higher receivables or inventories, or to one-off payments. In Q1 2026 operating cash flow was positive at USD 234.1m, and in Q2 2025 it was USD 105.4m. Such a reversal requires an explanation that is not provided in the facts. For an investor, this is a signal that the quality of profit in this quarter is low.
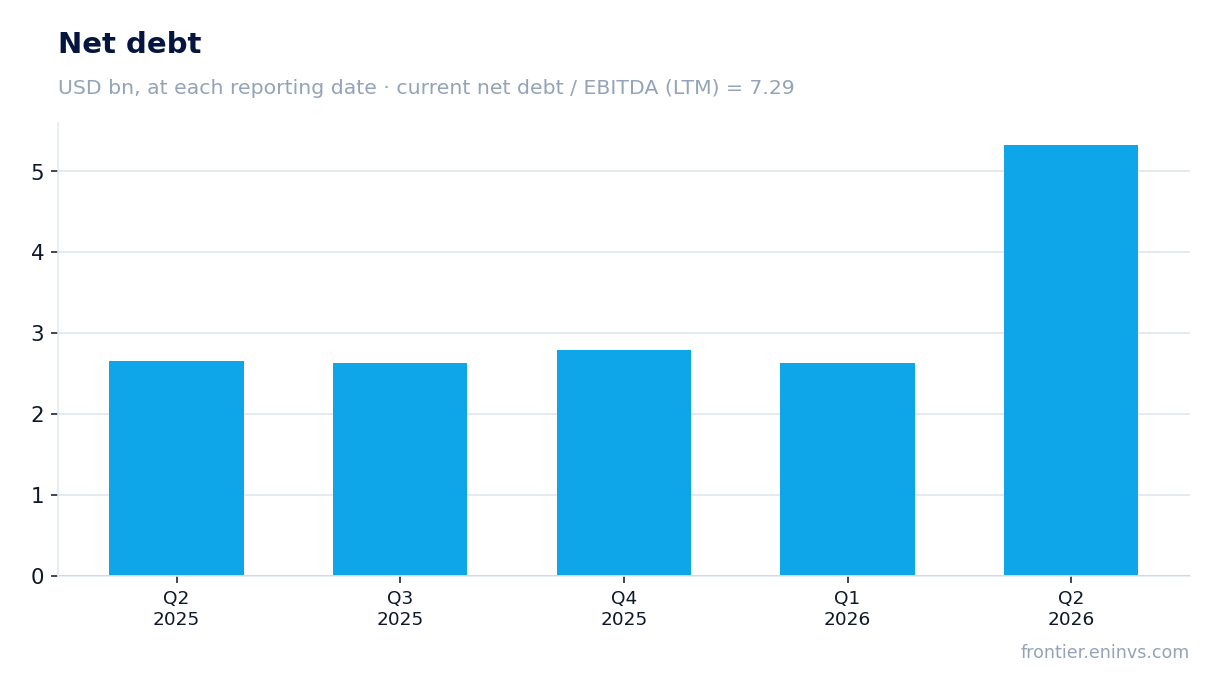
Net debt rose from USD 2.6bn on 31 March to USD 5.3bn on 30 June, the main risk in the report
Keyera's net debt as of 30 June 2026 was USD 5,327.9m. This is a sharp increase from USD 2,624.5m on 31 March 2026, i.e. an increase of USD 2.7bn over three months. A year earlier, on 30 June 2025, net debt was USD 2,657.8m, and over the last 12 months it also rose by USD 2.7bn. Such debt growth raises questions, especially against the backdrop of negative operating cash flow.
The net debt to EBITDA ratio for the last 12 months is 7.29. This is a high level that limits the company's financial flexibility. At the same time, the facts do not provide a previous value for this ratio, so it cannot be stated that leverage rose or fell – only the current level can be noted. High debt increases interest expenses and may consume a significant portion of operating profit.
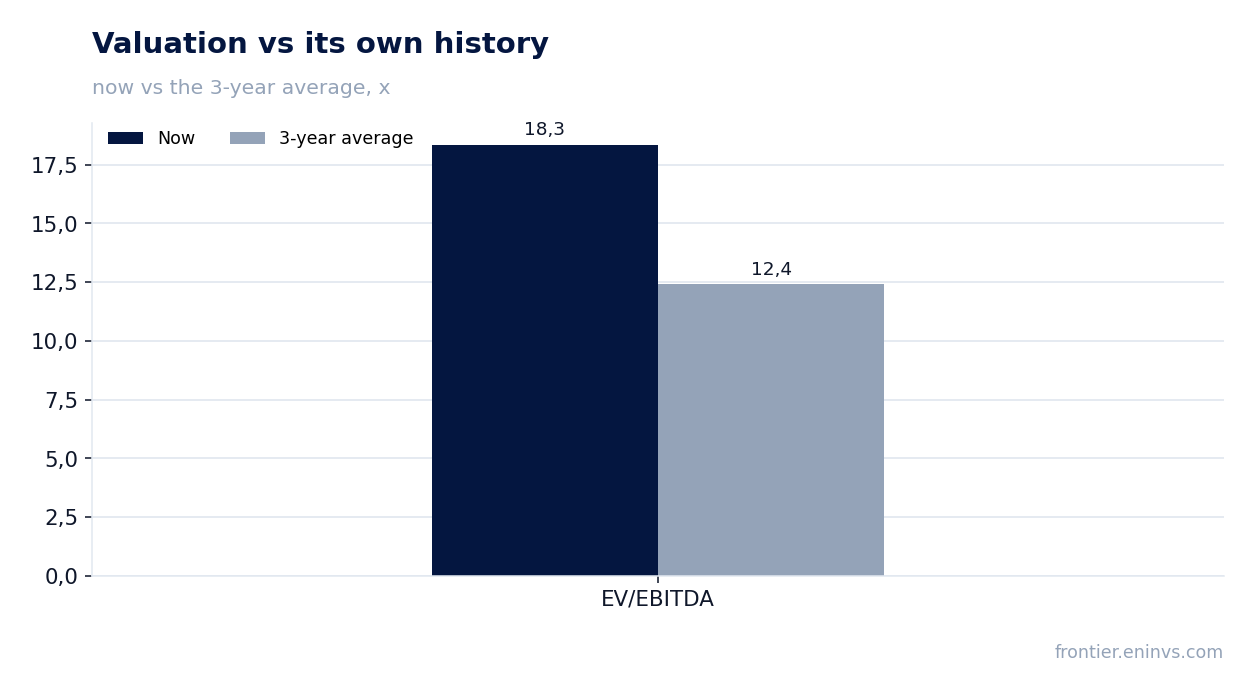
EV/EBITDA of 18.3 against its own three-year average of 12.4 – the stock trades above its history
Keyera's current EV/EBITDA multiple is 18.35, significantly above its own three-year average of 12.40. This means the market values the company more expensively than on average over the last three years. At the same time, the P/E for the last 12 months is 40.95, also indicating a high valuation. The profit growth in the reporting quarter did not lead to a reduction in multiples, as the share price likely already reflects positive expectations.
Such a high multiple can only be justified by sustained profit growth in the future. However, negative operating cash flow and high net debt create risks for future results. If profit does not continue to grow at the same pace, the multiple may decline, putting pressure on the share price. Comparison with its own history shows that the current valuation is at the upper end of the range.
Dividend yield of 4.25% with a payout ratio that may come under pressure from the debt load
Keyera's dividend yield over the last 12 months is 4.25%. This is a moderate level that may be attractive to income investors, but it is not exceptionally high. With net profit of USD 259.4m over the last 12 months and a market capitalisation of USD 10,624.1m, the payout ratio appears sustainable, but rising debt may limit the company's ability to increase dividends.
The facts do not provide information on the specific dividend amount for the last year or on the company's policy. However, with a net debt/EBITDA ratio of 7.29 and negative operating cash flow in Q2, the likelihood of a dividend cut or freeze increases. If the company directs part of its free funds to reduce debt, dividend payments may be revised downwards. This is a key risk for income-oriented holders.
The portal's model implies 36% downside to fair value, which outweighs the strong report
According to the portal's model, Keyera's fair value is 36% below the current market price. This is the portal's own calculation, which re-prices EBITDA at current commodity prices and a target EV/EBITDA multiple. Such significant downside suggests that the market overvalues the company relative to its fundamental value. Even with the strong Q2 report, the model indicates limited upside.
The combination of factors – high EV/EBITDA relative to its own history, negative operating cash flow, rising net debt, and moderate dividend yield – creates a negative backdrop for the stock. The portal's model confirms that the current price leaves no margin for error. For an investor, this means the downside risk outweighs the potential benefit from profit growth.
Valuation on the latest reported figures
| Metric | Value |
|---|---|
| Market cap | 10.6 bn USD |
| P/E (LTM) | 40.9 |
| EV/EBITDA (LTM) | 18.3 |
| P/B | 5.26 |
| Net debt / EBITDA (LTM) | 7.29 |
| Operating cash flow (LTM) | 0.35 bn |
| ROE | 32.1% |
| Dividend yield (12m) | 4.3% |
| EV/EBITDA, 3-year average | 12.4 |
Bottom line
Bottom line: Keyera delivered strong revenue and profit growth in Q2 2026, but the quality of these results is questionable. Profit rose 142.0%, yet operating cash flow turned negative at minus USD 222.0m, and net debt increased to USD 5.3bn. The EV/EBITDA multiple of 18.3 is well above its own three-year average of 12.4, limiting upside potential. The portal's model implies 36% downside to fair value, so at the current price the share looks rather unattractive.
Open the company's financial profile KEYCA →
See also: market overview · valuation map · stock screeners