KGHM Polska Miedz: profit up 8x, but the surge rests on the copper price, not on volumes
KGHM Polska Miedz released its Q2 2026 report on 30 July. Revenue rose 51.8% year on year to USD 3,488.9 mn, EBITDA jumped 216.8% to USD 1,010.9 mn, and net profit climbed 738.5% to USD 557.1 mn. The EBITDA margin reached 29.0% versus 13.9% a year earlier, while net debt stood at USD 1.2 bn as of 30 June. With an EV/EBITDA of 6.4 against its own three-year average of 8.1 and the portal model pointing to 5% upside, the share looks rather attractive, but the surge rests on the copper price rather than on volumes.
Key takeaways
— Revenue rose 51.8% year on year to USD 3,488.9 mn, and this is entirely a copper price effect, not higher shipment volumes
— EBITDA jumped 216.8% to USD 1,010.9 mn, with the margin soaring to 29.0% from 13.9% — operating leverage worked at full force
— Net profit grew 8x to USD 557.1 mn, but it contains a one-off effect that will not repeat next quarter
— Net debt fell from USD 1.5 bn on 31 March to USD 1.2 bn on 30 June, while net debt to LTM EBITDA stands at 0.43
— Operating cash flow for the quarter was USD 509.8 mn, but without capex data the sustainability of this flow cannot be assessed
— Trailing twelve-month dividend yield is just 0.46%, which looks modest against the high profit
— EV/EBITDA of 6.4 against its own three-year average of 8.1 — the stock trades below its history, and the portal model points to 5% upside
Attractiveness
Key figures, USD bn
| Metric | Q2 2025 | Q2 2026 | Change |
|---|---|---|---|
| Revenue | 2.30 | 3.49 | +51.8% |
| EBITDA | 0.32 | 1.01 | +216.8% |
| Operating profit | 0.27 | 0.56 | +110.5% |
| Net profit | 0.07 | 0.56 | +738.5% |
| Operating cash flow | 0.11 | 0.51 | +360.4% |
| EBITDA margin | 13.9% | 29.0% | +15.1 pp |
| Net margin | 2.9% | 16.0% | +13.1 pp |
Revenue rose 51.8% year on year to USD 3,488.9 mn, and this is entirely a copper price effect, not higher shipment volumes
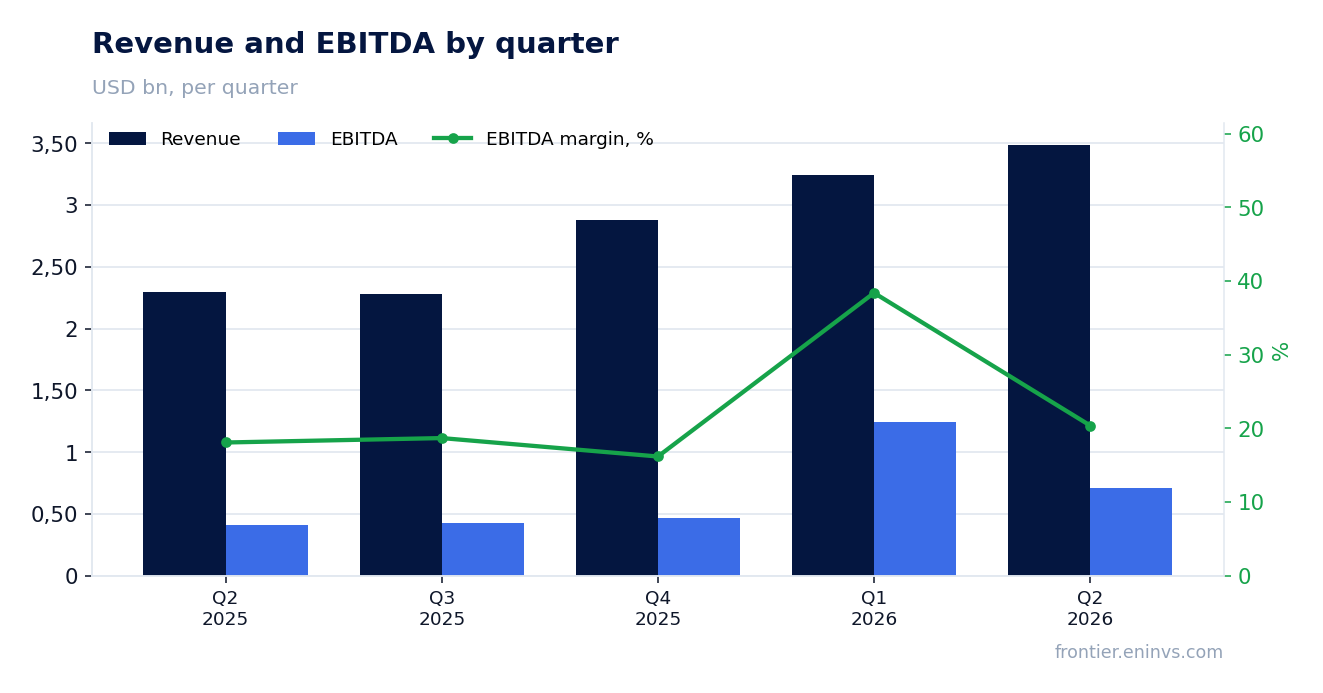
Q2 2026 revenue came in at USD 3,488.9 mn, up 51.8% from Q2 2025. For comparison, Q1 2026 revenue was USD 3,247.4 mn, and Q4 2025 was USD 2,883.4 mn. Growth has been accelerating for two consecutive quarters, driven by high copper prices.
The main driver is price, not volume. The report does not disclose physical shipment volumes, but the growth structure suggests that almost the entire increase comes from the price factor. If the company were ramping up output, we would see a smoother quarterly pattern, but here growth accelerates in jumps, typical of commodity trading.
For an investor, this means revenue sustainability depends entirely on copper market conditions. Any downward price reversal will immediately hit revenue, and the company cannot offset it with volumes because there is no volume growth.
EBITDA jumped 216.8% to USD 1,010.9 mn, with the margin soaring to 29.0% from 13.9% — operating leverage worked at full force
Q2 2026 EBITDA reached USD 1,010.9 mn, up 216.8% from a year earlier. The EBITDA margin rose to 29.0% from 13.9% in Q2 2025. Such a margin jump is a direct result of operating leverage: revenue grew 51.8% while costs likely remained relatively stable, producing a multiple increase in profit.
In Q1 2026, EBITDA was even higher at USD 1,247.3 mn, but the margin was different then. The 19% quarter-on-quarter decline in EBITDA despite a 7.4% revenue increase suggests that Q1 had a one-off factor or more favourable conditions. Nevertheless, the year-on-year growth remains impressive.
The sustainability of this margin is questionable. If copper prices correct, EBITDA could fall as quickly as it rose. The company does not disclose its cost structure, so it is impossible to assess how fixed costs are. But the current 29.0% margin is historically high for a commodity company.
Net profit grew 8x to USD 557.1 mn, but it contains a one-off effect that will not repeat next quarter
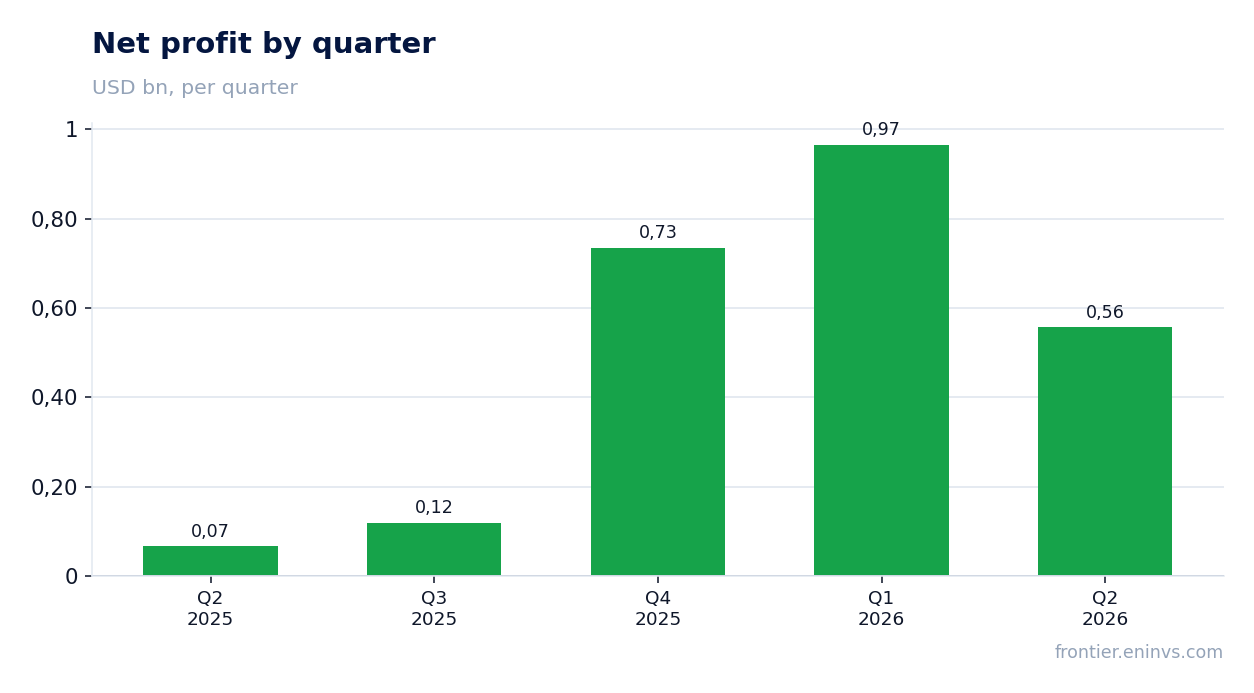
Q2 2026 net profit came in at USD 557.1 mn, 8.4 times higher than USD 66.4 mn a year earlier. Profit growth outpaces EBITDA growth, pointing to a lower effective tax rate or one-off items below the operating line. In Q4 2025, profit was USD 734.9 mn, also above the current level, meaning the company has already shown such spikes.
The one-off nature of part of the profit is confirmed by comparison with Q1 2026, when profit was USD 965.3 mn. At that time, a major one-time factor likely kicked in, possibly related to asset revaluation or tax adjustments. In Q2, profit fell 42% quarter on quarter even as revenue grew.
For an investor, it is important that underlying profitability, cleaned of one-offs, is likely lower than reported. Excluding quarterly fluctuations, LTM net profit is USD 2,376.1 mn, giving a P/E of 7.2. That is inexpensive, but one must understand that LTM includes both peak and weak quarters.
Net debt fell from USD 1.5 bn on 31 March to USD 1.2 bn on 30 June, while net debt to LTM EBITDA stands at 0.43
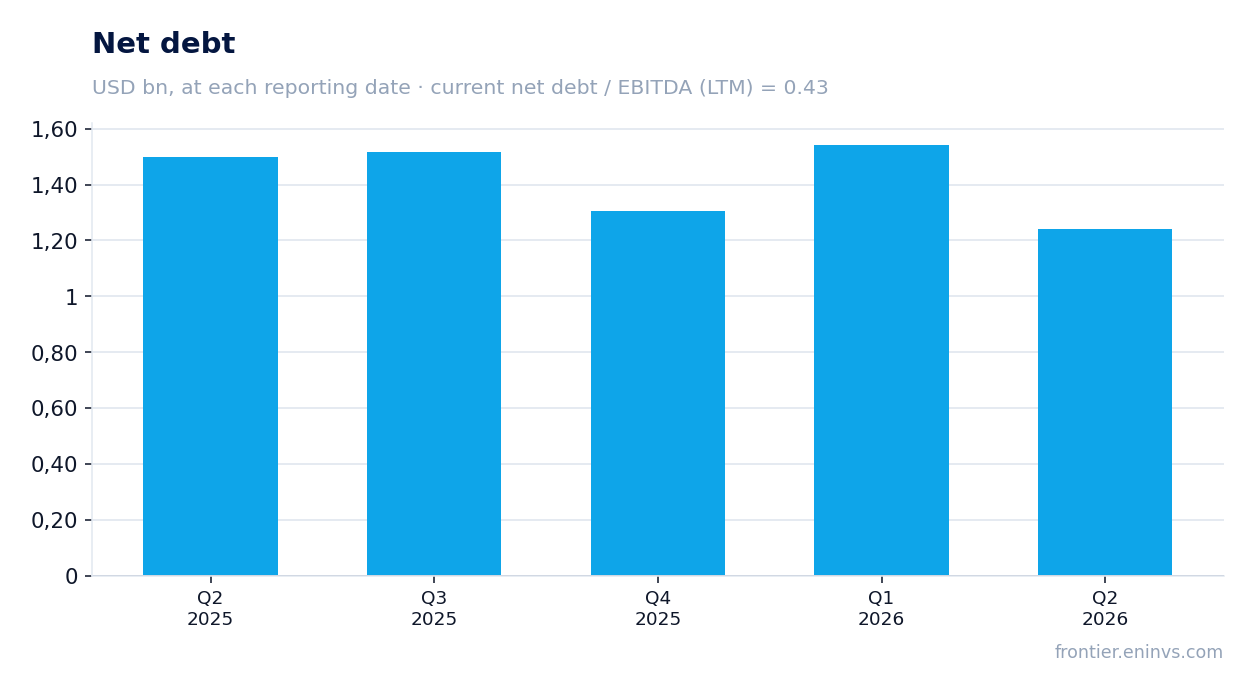
Net debt as of 30 June 2026 stood at USD 1.2 bn, down from USD 1.5 bn on 31 March. Year on year, from 30 June 2025, debt also decreased from USD 1.5 bn to USD 1.2 bn. This reduction occurred alongside rising operating profit and was likely used to repay obligations. The net debt to LTM EBITDA ratio is 0.43 — a low level that gives the company a margin of safety.
It is important to note that the debt reduction does not necessarily mean improved credit quality, as we do not know how the debt-to-EBITDA ratio changed previously. However, the absolute debt level of USD 1.2 bn against a market capitalisation of USD 17.1 bn looks unburdensome. The company can easily service its obligations.
Interest expenses are not disclosed, but with such a low debt burden they are unlikely to weigh heavily on profit. The main risk is that if copper prices fall and EBITDA contracts, the debt-to-EBITDA ratio could rise, but even if EBITDA halves, the ratio would remain below 1.0.
Operating cash flow for the quarter was USD 509.8 mn, but without capex data the sustainability of this flow cannot be assessed
Operating cash flow in Q2 2026 was USD 509.8 mn, significantly higher than USD 110.7 mn a year earlier. The cash flow growth matches profit growth and confirms that the improvement in financial results is not purely accounting. However, the report lacks capex data, so it is impossible to assess how much of this flow remains after investment.
For a commodity company, capex is a critical item, as maintaining production requires constant investment. Without this data, we cannot judge free cash flow. If capex is comparable to operating cash flow, free cash flow could be close to zero or even negative.
Nevertheless, the increase in operating cash flow from USD 110.7 mn to USD 509.8 mn is a strong signal. The company generates enough funds to finance current operations and service debt. The question is whether these funds are sufficient for dividends and development.
Trailing twelve-month dividend yield is just 0.46%, which looks modest against the high profit
The trailing twelve-month dividend yield is 0.46%. This is a very low level, especially against net profit of USD 2,376.1 mn over the same period. The company prefers to direct funds towards debt reduction or investment rather than shareholder payouts. For a commodity company, this is typical policy, but for an income-oriented investor, such a yield is unattractive.
Given that profit has been high in recent quarters, one might expect more generous dividends. However, the company likely remains cautious due to copper price volatility. If profit sustainably remains at the current level, dividends could rise, but so far this has not happened.
For comparison, the US key rate is around 5%, and a yield of 0.46% is significantly below the risk-free rate. This means the investor is not receiving adequate compensation for risk through dividends. The main return can only come from share price appreciation.
EV/EBITDA of 6.4 against its own three-year average of 8.1 — the stock trades below its history, and the portal model points to 5% upside
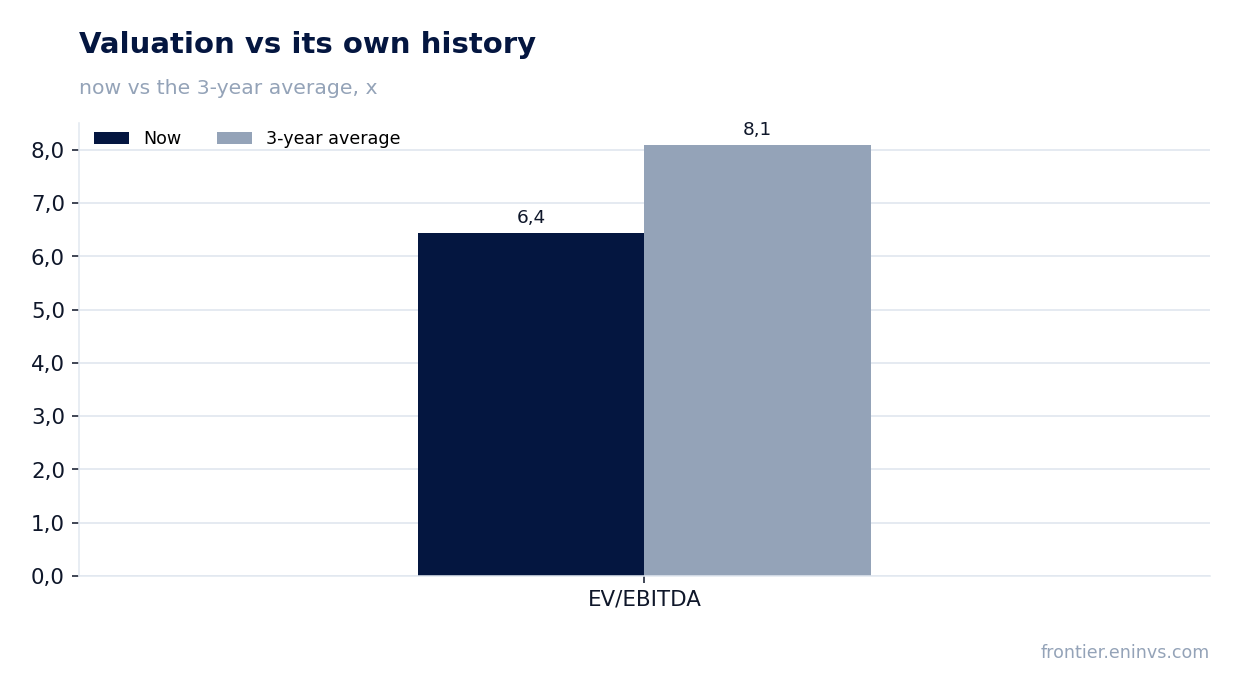
The current EV/EBITDA multiple is 6.4, below its own three-year average of 8.1. This means the stock trades at a discount to its historical valuation. The reason is likely that the market does not believe in the sustainability of current high profits and prices in a decline in copper prices. The LTM P/E is 7.2, which also does not look expensive.
The portal model, which re-prices EBITDA at current commodity prices and the target EV/EBITDA, indicates upside to fair value of +5%. This is a moderate but positive signal. It suggests that even with current copper prices, the stock is undervalued, but only slightly.
Comparison with history shows that the market usually valued the company more highly. If copper prices remain high, the multiple could revert to the mean, providing capitalisation growth. However, if prices fall, profit will shrink, and the multiple could remain low or even rise due to a falling denominator.
Valuation on the latest reported figures
| Metric | Value |
|---|---|
| Market cap | 17.1 bn USD |
| P/E (LTM) | 7.2 |
| EV/EBITDA (LTM) | 6.4 |
| P/B | 1.87 |
| Net debt / EBITDA (LTM) | 0.43 |
| Operating cash flow (LTM) | 1.30 bn |
| ROE | 21.8% |
| Dividend yield (12m) | 0.5% |
| EV/EBITDA, 3-year average | 8.1 |
Bottom line
KGHM Polska Miedz delivered a strong quarter: revenue rose 51.8%, EBITDA jumped 216.8%, and net profit grew 8x. However, this growth is entirely driven by high copper prices, not by higher volumes. The 29.0% EBITDA margin looks impressive, but its sustainability is questionable. Net debt fell to USD 1.2 bn, and the net debt to LTM EBITDA ratio is 0.43 — a comfortable level. The 0.46% dividend yield is unattractive. Valuation at EV/EBITDA 6.4 against a historical average of 8.1 suggests undervaluation, and the portal model points to 5% upside. Overall, the share looks rather attractive, but the key question is whether copper prices will hold at current levels.
Open the company's financial profile KGH →
See also: market overview · valuation map · stock screeners