Kimbell Royalty Partners: record quarter delivered $47.3m net income, but half of revenue came from one-off items
On August 7, Kimbell Royalty Partners reported Q2 2026 results. Revenue rose 30.0% year-on-year to $112.5m, adjusted EBITDA – 24.4% to $84.9m, net income – 77.3% to $47.3m. However, $6.1m of revenue came from a one-off gain on hedges and $3.3m from lease bonuses, while a quarter earlier these items were negative or minimal. At the same time, leverage of 1.61x LTM EBITDA and EV/EBITDA LTM of 7.29 look neutral, while the portal's model points to 54% downside. Verdict – neutral: record operating results are already priced in, and one-off factors distort the picture.
Key takeaways
— Revenue rose 30.0% year-on-year to $112.5m, but $6.1m came from a one-off gain on hedges and $3.3m from lease bonuses
— Adjusted EBITDA added 24.4% to $84.9m, but margin fell to 75.5% from 78.9% a year earlier
— Net income rose 77.3% to $47.3m, but $30.2m of it was depreciation and $8.4m interest expense
— Leverage of 1.61x LTM EBITDA and EV/EBITDA LTM of 7.29 give no clear signal
— Dividend of $0.47 per unit rose 15% quarter-on-quarter, but 25% of cash flow goes to debt repayment
— The portal's model points to 54% downside from the current price
Attractiveness
Key figures, USD bn
| Metric | Q2 2025 | Q2 2026 | Change |
|---|---|---|---|
| Revenue | 0.09 | 0.11 | +30.0% |
| EBITDA | 0.07 | 0.08 | +24.4% |
| Operating profit | 0.04 | 0.06 | +57.9% |
| Net profit | 0.03 | 0.05 | +77.3% |
| Operating cash flow | 0.07 | 0.07 | -5.6% |
| Capex | 0.00 | 0.05 | +35163.2% |
| EBITDA margin | 78.9% | 75.5% | -3.4 pp |
| Net margin | 30.8% | 42.1% | +11.3 pp |
Revenue rose 30.0% year-on-year to $112.5m, but $6.1m came from a one-off gain on hedges and $3.3m from lease bonuses
Kimbell Royalty Partners' revenue in Q2 2026 was $112.5m, up 30.0% year-on-year. The main contribution came from oil, natural gas and NGL revenues – $103.0m, a record for the company. However, the reporting period also included a $6.1m gain on hedges and $3.3m in lease bonuses, which a quarter earlier were negative or minimal.
Production growth to 25,830 barrels of oil equivalent per day (6:1) was partly driven by the $145.9m acquisition of Mesa Royalties, which closed on June 22, 2026. Excluding this asset, the company also notes organic production growth. The average realised price was $94.67 per barrel of oil, $2.01 per Mcf of gas, and $29.12 per barrel of NGLs.
Thus, the 30.0% revenue growth looks impressive, but a significant portion of the increase came from one-off items and the acquisition. Without them, the dynamics would be more modest, which is important to consider when assessing the sustainability of results.
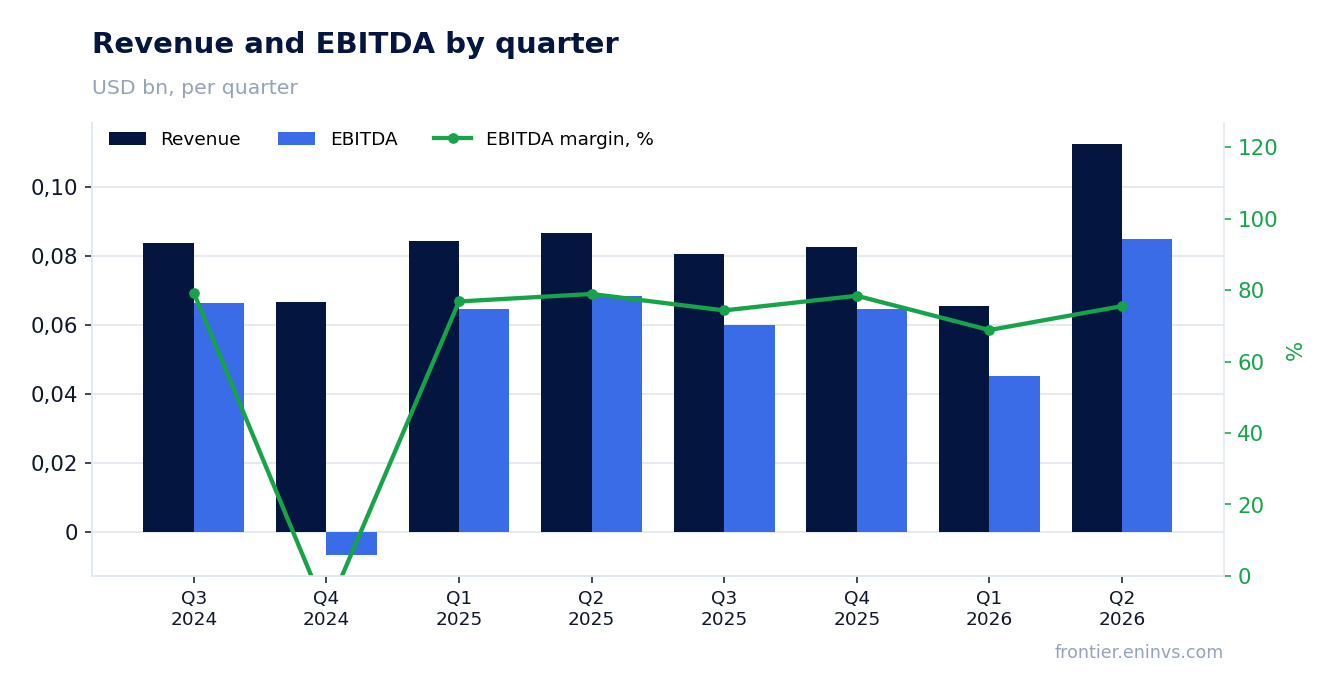
Adjusted EBITDA added 24.4% to $84.9m, but margin fell to 75.5% from 78.9% a year earlier
Adjusted EBITDA in Q2 2026 reached $84.9m, up 24.4% year-on-year. However, the margin on this metric fell to 75.5% from 78.9% in the same period last year. This is because revenue grew faster than EBITDA due to outpacing growth in production and administrative expenses.
Total costs rose to $52.8m from $48.8m a year earlier. In particular, production and ad valorem taxes increased to $8.2m, marketing and other deductions – to $4.2m, general and administrative expenses – to $10.2m. Depreciation remained virtually flat at $30.2m.
The margin decline amid absolute growth suggests that the company could not fully convert revenue growth into profit. This may be due to the integration of acquired assets and cost inflation.
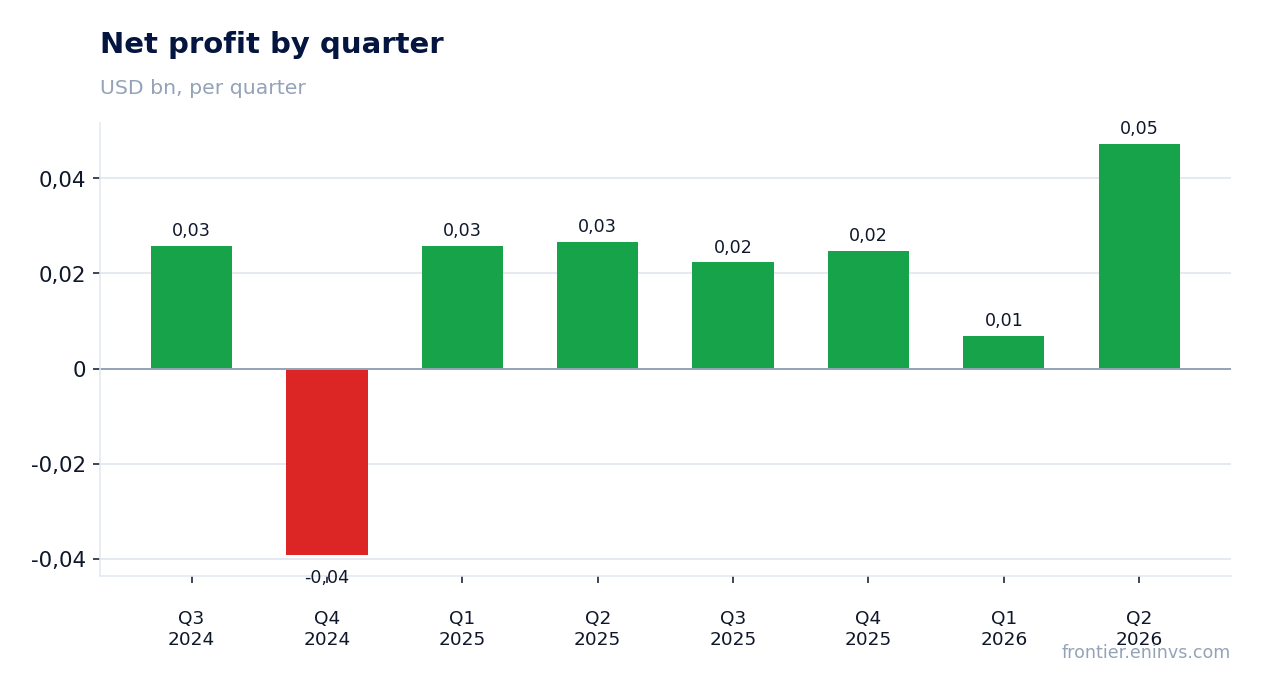
Net income rose 77.3% to $47.3m, but $30.2m of it was depreciation and $8.4m interest expense
Net income in Q2 2026 was $47.3m, up 77.3% year-on-year. However, a significant portion of this amount was formed by non-cash items: depreciation was $30.2m and interest expense $8.4m. Excluding depreciation, profit would be substantially higher, but it reflects reserve depletion.
Operating income rose to $59.7m from $37.8m a year earlier. At the same time, net income attributable to common units was only $38.4m, or $0.40 per unit, due to distributions on Series A preferred units of $2.6m and net income attributable to non-controlling interests of $6.3m.
The 77.3% increase in net income looks very strong, but it is largely driven by one-off gains on hedges and lease bonuses, as well as the acquisition effect. The sustainability of this growth is questionable.
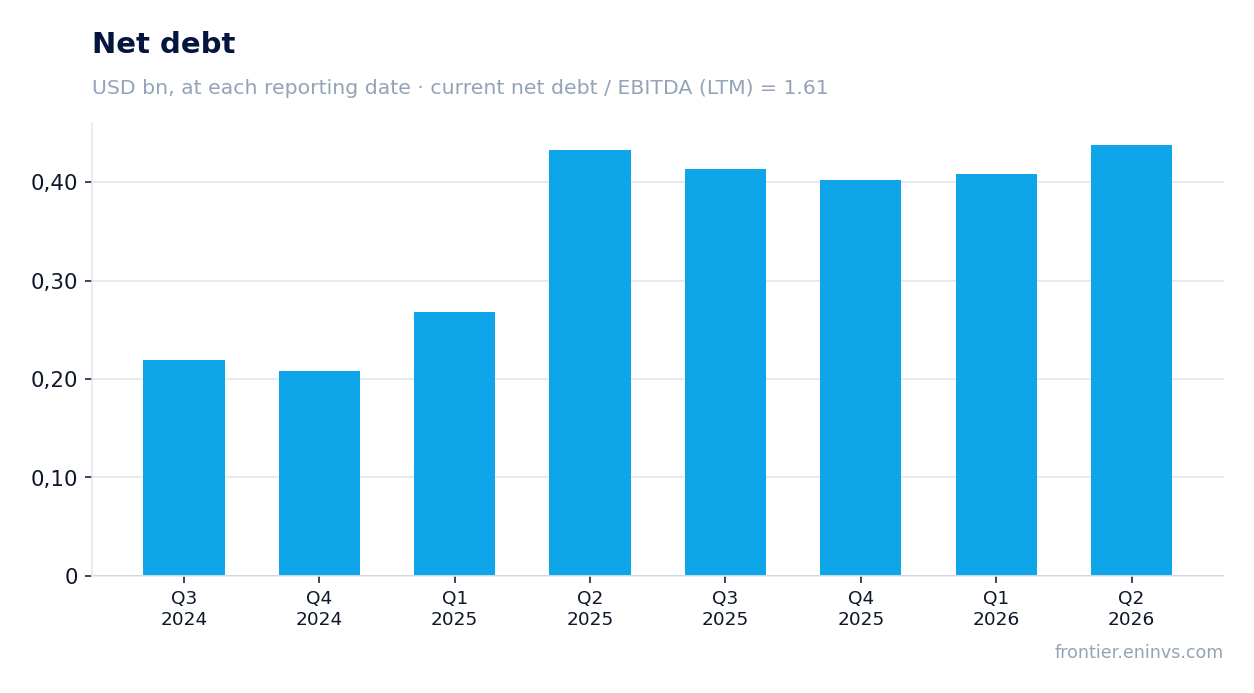
Leverage of 1.61x LTM EBITDA and EV/EBITDA LTM of 7.29 give no clear signal
Net debt at the end of Q2 2026 was $401.9m, and the ratio of net debt to LTM EBITDA was 1.61. This is a moderate level for a company with a market capitalisation of $1.42bn. However, in the report the company states that under its credit agreement the net debt to EBITDA ratio is 1.4x, which may reflect a different calculation, including the pro forma effect of the acquisition.
EV/EBITDA LTM is 7.29, and P/E LTM is 13.98. Return on equity (ROE) is 27.1%. These multiples do not look clearly overvalued or undervalued relative to historical levels, but we do not have data on three-year averages for direct comparison.
Operating cash flow over the last 12 months was $246.5m, which covers interest expenses and dividends. However, capital expenditures in the reporting quarter were zero, which is typical for a royalty company but does not reflect possible future acquisitions.
Dividend of $0.47 per unit rose 15% quarter-on-quarter, but 25% of cash flow goes to debt repayment
For Q2 2026, the company declared a distribution of $0.47 per common unit, 15% higher than in Q1. This represents 75% of cash available for distribution, which was $60.0m, or $0.59 per unit. The remaining 25% will be used to repay borrowings under the credit facility.
The annualised yield at the current price of $14.51 is 13.0%. The company notes that approximately 47% of the distribution may be non-taxable as a return of capital. This makes the dividend attractive for income-oriented investors, especially against current interest rates.
However, the sustainability of the dividend depends on commodity prices and production volumes. If prices decline, cash flow may shrink, leading to lower payouts. In addition, the company actively funds acquisitions with debt, increasing financial risk.
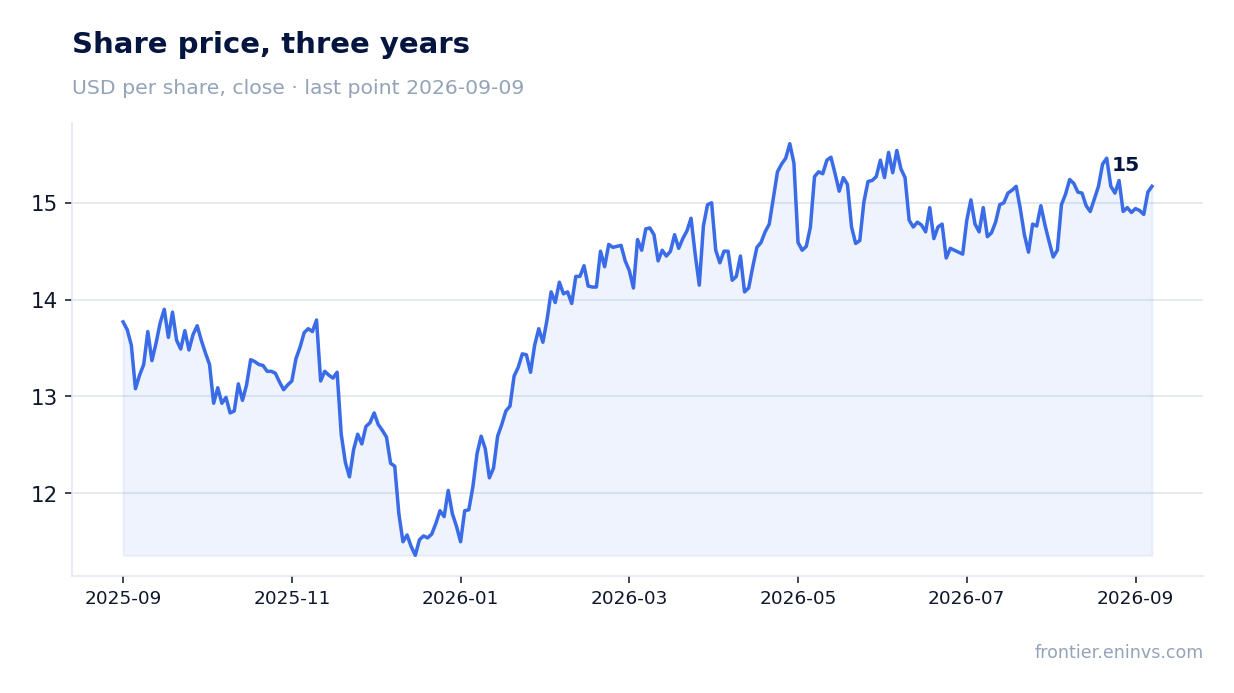
The portal's model points to 54% downside from the current price
According to our model, which re-prices EBITDA at current commodity prices at the target EV/EBITDA, the fair value of Kimbell Royalty Partners' shares is 54% below the current market price. This means the market is pricing in higher commodity prices or sustainably high production than our model assumes.
It is worth noting that the model is based on current forward curves and may not account for potential production growth from acquisitions. Nevertheless, the significant gap between the market price and the model's valuation suggests possible overvaluation.
For investors, this is a signal for caution: even with the high dividend, the downside potential looks substantial if energy prices do not exceed current expectations.
Valuation on the latest reported figures
| Metric | Value |
|---|---|
| Market cap | 1.42 bn USD |
| P/E (LTM) | 14.0 |
| EV/EBITDA (LTM) | 7.3 |
| P/B | 2.31 |
| Net debt / EBITDA (LTM) | 1.61 |
| Operating cash flow (LTM) | 0.25 bn |
| ROE | 27.1% |
Bottom line
Kimbell Royalty Partners reported a record Q2 2026: revenue rose 30.0% to $112.5m, net income – 77.3% to $47.3m. However, a significant portion of this growth was driven by one-off gains on hedges and lease bonuses, as well as the Mesa Royalties acquisition. EBITDA margin fell to 75.5% from 78.9%, indicating rising costs. Leverage of 1.61x LTM EBITDA and EV/EBITDA LTM of 7.29 do not look critical, but the portal's model points to 54% downside. The dividend of $0.47 per unit with a 13.0% yield is attractive, but its sustainability depends on commodity prices. Verdict – neutral: the current price already reflects record results, and one-off factors distort the picture.
Open the company's financial profile KRP →
See also: market overview · valuation map · stock screeners