Meren Energy: revenue tripled, but the quarter's profit rests on a one-off, not on production
On 25 August Meren Energy released its results for the second quarter of 2026. Revenue rose 183.8% year on year to 196.7 million dollars, EBITDA added 17.3% to 123.6 million, and net profit reached 31.8 million against 3.1 million a year earlier. At the same time the EBITDA margin narrowed from 152.1% to 62.8%, and the entire quarterly result rests on one-off items, while over the trailing twelve months EBITDA stands at 367.6 million on revenue of 727.4 million. At an EV/EBITDA of 3.14 and a dividend yield of 9.8% the share looks attractive, but the sustainability of earnings is open to question.
Key takeaways
— Revenue rose 183.8% year on year, but EBITDA added only 17.3% – growth barely converts into operating profit
— The EBITDA margin narrowed from 152.1% to 62.8% because the prior-year base was inflated by one-off receipts
— Net profit rose to 31.8 million dollars, but without one-off items the quarter could have been loss-making
— The company moved into a net cash position: net debt gave way to net cash of 76.7 million dollars
— Operating cash flow for the quarter was 67.3 million dollars, but over the trailing twelve months it is 265.7 million – the quarter is weaker than the annual run-rate
— A 9.8% dividend yield with a payout only partly covered by profit makes the dividend the key question for a holder
— EV/EBITDA of 3.14 and ROE of 18.1% look cheap, but trailing-twelve-month profit includes one-off items
Attractiveness
Key figures, USD bn
| Metric | Q2 2025 | Q2 2026 | Change |
|---|---|---|---|
| Revenue | 0.07 | 0.20 | +183.8% |
| EBITDA | 0.11 | 0.12 | +17.3% |
| Operating profit | 0.04 | 0.08 | +118.3% |
| Net profit | 0.00 | 0.03 | +925.8% |
| Operating cash flow | 0.01 | 0.07 | +547.1% |
| EBITDA margin | 152.1% | 62.8% | -89.3 pp |
| Net margin | 4.5% | 16.2% | +11.7 pp |
Revenue rose 183.8% year on year, but EBITDA added only 17.3% – growth barely converts into operating profit
Revenue for the second quarter of 2026 was 196.7 million dollars, 183.8% above the level of the second quarter of 2025. Such growth looks impressive, but it mainly reflects a low base a year earlier, when revenue was 69.3 million dollars.
EBITDA for the same quarter rose only 17.3%, to 123.6 million dollars. The gap between revenue and EBITDA dynamics is explained by the fact that the prior-year base included one-off receipts that are not repeated. Operating profit was 80.1 million dollars against 36.7 million a year earlier.
Over the trailing twelve months revenue reached 727.4 million dollars and EBITDA 367.6 million. These figures show that the quarterly revenue spike does not change the annual scale of the business: the company remains small in revenue but with high operating profitability.
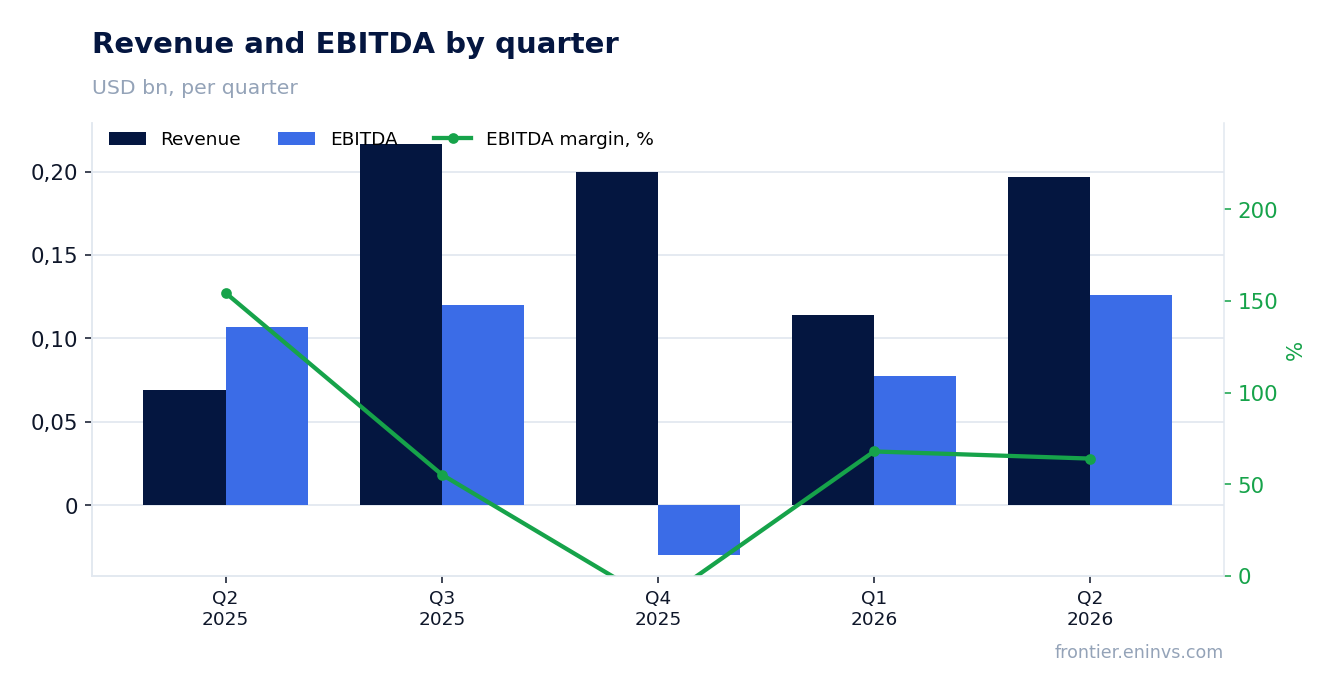
The EBITDA margin narrowed from 152.1% to 62.8% because the prior-year base was inflated by one-off receipts
The EBITDA margin in the second quarter of 2026 was 62.8% against 152.1% a year earlier. The margin decline is explained not by deteriorating operating efficiency but by the fact that the prior-year base was inflated by one-off receipts that are not repeated.
The net margin, by contrast, rose from 4.5% to 16.2%. This divergence is due to the fact that last year a significant part of EBITDA did not reach net profit because of non-operating write-offs, whereas in the current quarter net profit was 31.8 million dollars.
The cost structure is not disclosed in the provided data, so it is impossible to say which line drove the net margin increase. However, the gap between the EBITDA margin and the net margin remains significant, pointing to substantial non-operating expenses or taxes.
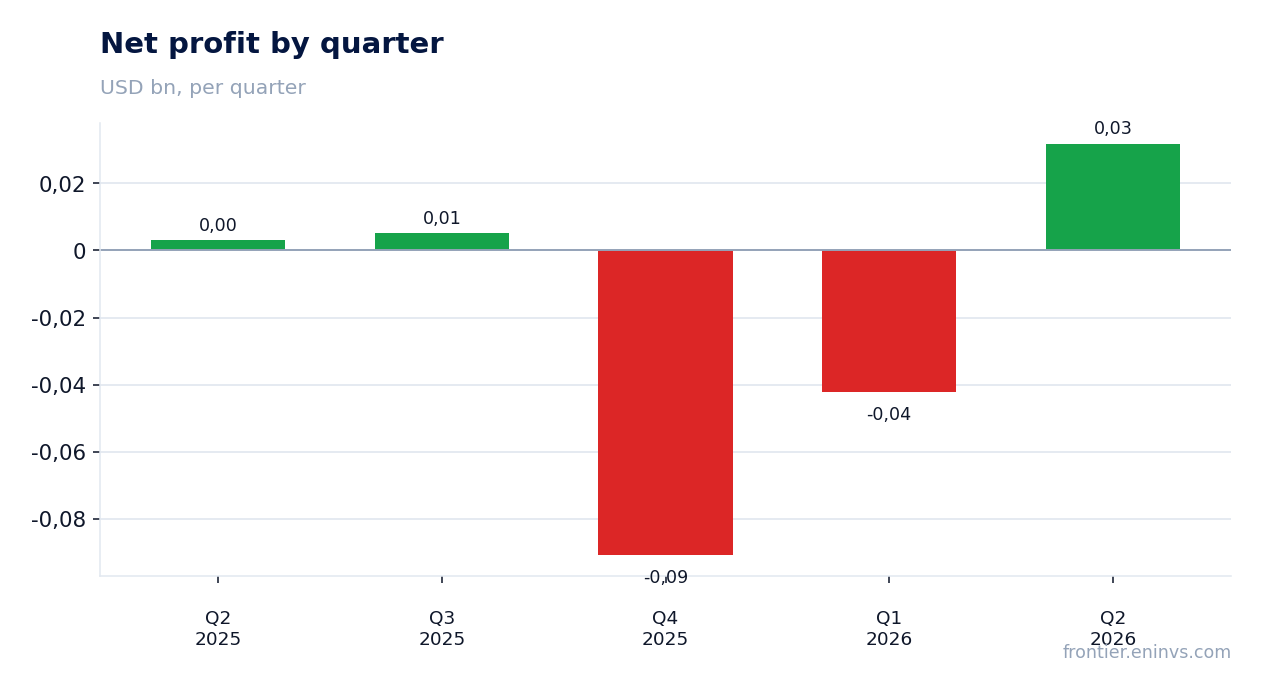
Net profit rose to 31.8 million dollars, but without one-off items the quarter could have been loss-making
Net profit in the second quarter of 2026 was 31.8 million dollars against 3.1 million a year earlier. The nearly tenfold increase looks impressive, but it rests on one-off items whose nature is not disclosed in the provided data.
Operating profit for the quarter was 80.1 million dollars, significantly above net profit. This means that about 48 million dollars went to non-operating expenses, interest and taxes. Without one-off receipts, net profit could have been substantially lower or even negative.
Over the trailing twelve months net profit is not disclosed in the provided data, but ROE stands at 18.1%, indicating the company's ability to generate profit on capital. However, the sustainability of this figure depends on the recurrence of the one-off items that drove the quarterly result.
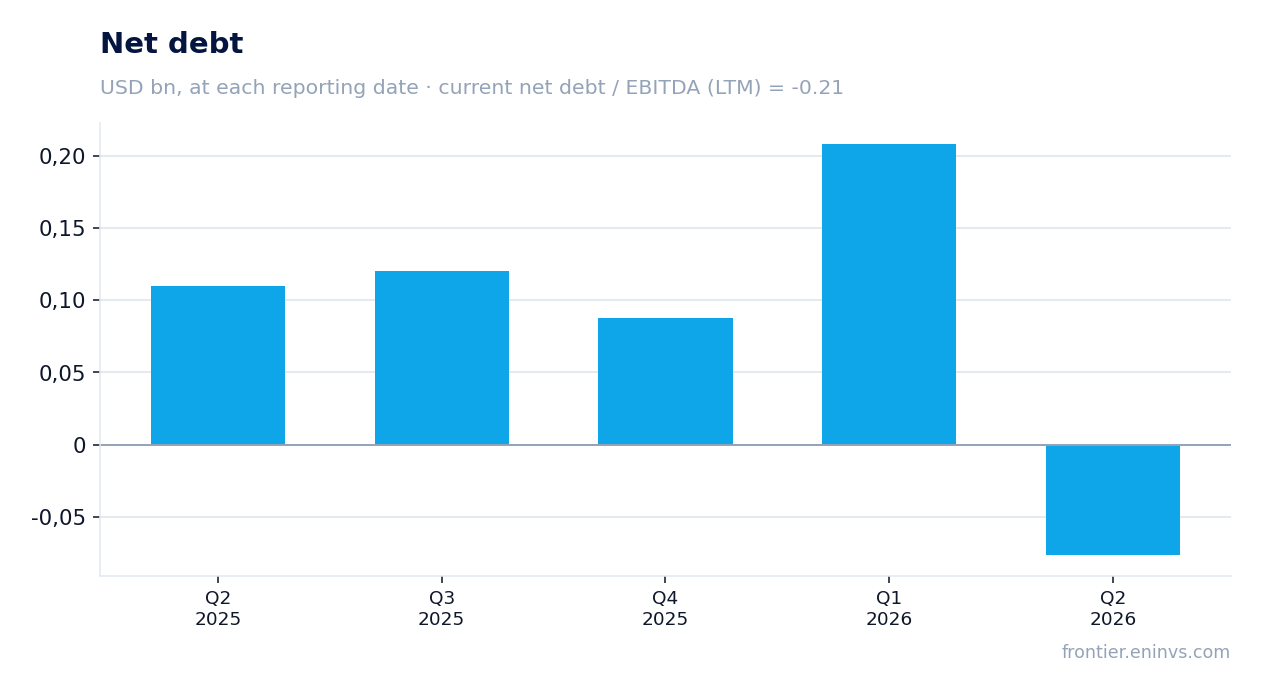
The company moved into a net cash position: net debt gave way to net cash of 76.7 million dollars
As of 30 June 2026, the company's net debt was -76.7 million dollars, meaning it has a net cash position. This change occurred from a level of 0.2 billion dollars on 31 March 2026, so over the quarter net debt decreased by 0.3 billion dollars.
Over the trailing twelve months net debt also decreased: from 0.1 billion dollars on 30 June 2025 to -0.1 billion dollars on 30 June 2026, a change of -0.2 billion dollars. Moving into net cash reduces debt burden and gives the company financial flexibility.
The net debt to EBITDA ratio over the trailing twelve months is -0.21, reflecting negative net debt. This is a level, not a direction of change: comparison with previous values of the ratio is absent from the provided data.
Operating cash flow for the quarter was 67.3 million dollars, but over the trailing twelve months it is 265.7 million – the quarter is weaker than the annual run-rate
Operating cash flow in the second quarter of 2026 was 67.3 million dollars. This is a positive figure, but it is noticeably below quarterly EBITDA of 123.6 million dollars, pointing to working capital outflow or other non-cash items.
Over the trailing twelve months operating cash flow is 265.7 million dollars. This is below annual EBITDA of 367.6 million dollars, confirming a systematic lag of cash flow behind operating profit.
Capital expenditure data is absent from the provided facts, so it is impossible to assess how much of the operating flow goes to investment. However, positive operating cash flow alongside a net cash position allows the company to fund dividends without borrowing.
A 9.8% dividend yield with a payout only partly covered by profit makes the dividend the key question for a holder
The dividend yield over the trailing twelve months is 9.8%. This is a high level, noticeably above the key rate, making the share attractive to income-oriented investors.
However, dividend coverage by profit raises questions. Over the trailing twelve months net profit is not disclosed in the provided data, but quarterly profit of 31.8 million dollars with a market capitalisation of about 996 million dollars suggests that annual profit may be insufficient to fully cover dividend payments.
Our estimate: if the company maintains the current payout level, the dividend can be funded from the net cash position, but the sustainability of payments depends on the recurrence of one-off items. A decline in one-off receipts or an increase in capital expenditure could lead to a dividend cut.
EV/EBITDA of 3.14 and ROE of 18.1% look cheap, but trailing-twelve-month profit includes one-off items
The EV/EBITDA multiple over the trailing twelve months is 3.14. This is a low level, suggesting that the market values the company cheaply relative to its operating profit. ROE is 18.1%, indicating efficient use of capital.
However, trailing-twelve-month profit includes one-off items that inflate the base. Without them the multiple would be higher and ROE lower. Comparison with the company's own 3-year average multiple is absent from the provided data, so it is impossible to say whether the share is above or below its historical level.
Market capitalisation is 996.3 million dollars. With a net cash position of 76.7 million dollars, enterprise value is below market capitalisation, further supporting the valuation. However, the sustainability of profit remains the key question for an investor.
Valuation on the latest reported figures
| Metric | Value |
|---|---|
| Market cap | 1.00 bn USD |
| EV/EBITDA (LTM) | 3.1 |
| P/B | 1.30 |
| Net debt / EBITDA (LTM) | -0.21 |
| Operating cash flow (LTM) | 0.27 bn |
| ROE | 18.1% |
| Dividend yield (12m) | 9.8% |
Bottom line
Meren Energy delivered a strong quarter: revenue rose 183.8%, net profit reached 31.8 million dollars, and the company moved into a net cash position. However, profit growth rests on one-off items, and the EBITDA margin narrowed from 152.1% to 62.8%. A 9.8% dividend yield and an EV/EBITDA of 3.14 look attractive, but the sustainability of profit and dividend coverage remain key questions. For a holder, the main question is whether the one-off receipts will recur next quarter.
Open the company's financial profile MEREN →
See also: market overview · valuation map · stock screeners